| Param | Original file | Final file |
|---|---|---|
| Filename | modeM0/AS1A05_088T03_9000003042_20572cztM0_level2.evt | modeM0/AS1A05_088T03_9000003042_20572cztM0_level2_quad_clean.evt |
| Size (bytes) | 484,329,600 | 97,464,960 |
| Size | 461.9 MB | 92.9 MB |
| Events in quadrant A | 3,329,867 | 622,570 |
| Events in quadrant B | 3,525,210 | 620,324 |
| Events in quadrant C | 3,412,286 | 608,470 |
| Events in quadrant D | 3,909,152 | 596,712 |
| Mode SS | |||
|---|---|---|---|
| Quadrant | BADHDUFLAG | Total packets | Discarded packets |
| A | 0 | 146 | 0 |
| B | 0 | 146 | 0 |
| C | 0 | 146 | 0 |
| D | 0 | 146 | 0 |
| Mode M9 | |||
|---|---|---|---|
| Quadrant | BADHDUFLAG | Total packets | Discarded packets |
| A | 0 | 11 | 0 |
| B | 0 | 12 | 0 |
| C | 0 | 12 | 0 |
| D | 0 | 12 | 0 |
| Mode M0 | |||
|---|---|---|---|
| Quadrant | BADHDUFLAG | Total packets | Discarded packets |
| A | 0 | 14768 | 2 |
| B | 0 | 15198 | 2 |
| C | 0 | 14835 | 2 |
| D | 0 | 16647 | 2 |
| Quadrant | Total seconds | Saturated seconds | Saturation percentage |
|---|---|---|---|
| A | 7235 | 45 | 0.621977% |
| B | 7235 | 85 | 1.174845% |
| C | 7235 | 75 | 1.036628% |
| D | 7235 | 70 | 0.967519% |
Noise dominated data is calculated using 1-second bins in cleaned event files. If a bin has >2000 counts, and if more than 50% of those come from <1% of pixels, then it is considered to be noise-dominated and hence unusable.
| Quadrant | # 1 sec bins | Bins with >0 counts | Bins with >2000 counts | High rate bins dominated by noise | Noise dominated (total time) | Noise dominated (detector-on time) | Marked lightcurve |
|---|---|---|---|---|---|---|---|
| A | 7705 | 7237 | 0 | 0 | 0.00% | 0.00% | 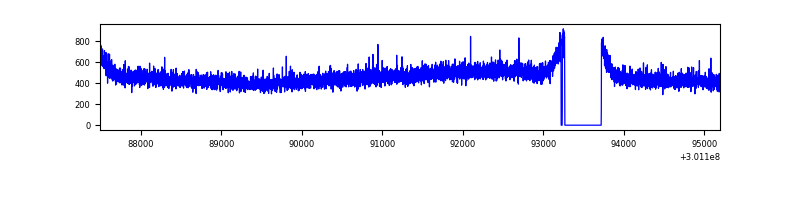 |
| B | 7705 | 7237 | 12 | 12 | 0.16% | 0.17% | 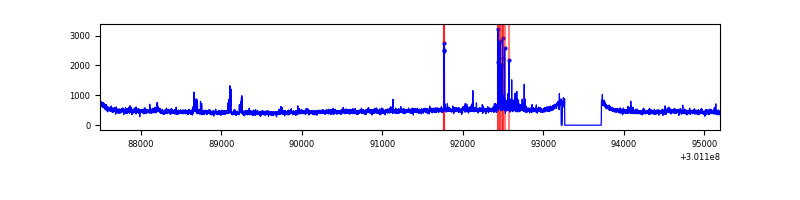 |
| C | 7705 | 7237 | 0 | 0 | 0.00% | 0.00% | 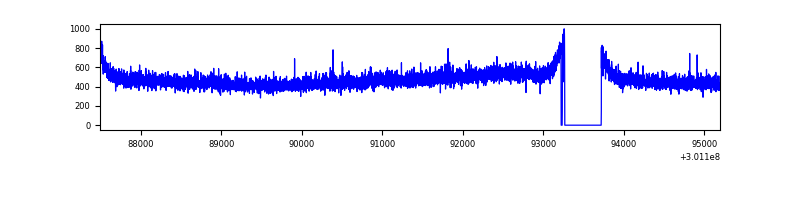 |
| D | 7705 | 7237 | 25 | 25 | 0.32% | 0.35% |  |
Top three noisy pixels from each quadrant. If the there are fewer than three noisy pixels in the level2.evt file, extra rows are filled as -1
| Pixel properties | Quadrant properties | ||||||
|---|---|---|---|---|---|---|---|
| Quadrant | DetID | PixID | Counts | Sigma | Mean | Median | Sigma |
| A | 0 | 226 | 7449 | 37.9 | 866 | 845 | 174.2 |
| A | 3 | 137 | 7400 | 37.62 | 866 | 845 | 174.2 |
| A | 12 | 194 | 6048 | 29.86 | 866 | 845 | 174.2 |
| B | 7 | 220 | 61869 | 372.47 | 862 | 841 | 163.8 |
| B | 0 | 230 | 40573 | 242.5 | 862 | 841 | 163.8 |
| B | 0 | 219 | 21715 | 127.4 | 862 | 841 | 163.8 |
| C | 14 | 238 | 129844 | 652.68 | 840 | 847 | 197.6 |
| C | 9 | 54 | 5949 | 25.81 | 840 | 847 | 197.6 |
| C | 13 | 61 | 5698 | 24.54 | 840 | 847 | 197.6 |
| D | 1 | 52 | 470321 | 2295.14 | 846 | 820 | 204.6 |
| D | 1 | 20 | 67512 | 326.02 | 846 | 820 | 204.6 |
| D | 7 | 238 | 35939 | 171.68 | 846 | 820 | 204.6 |
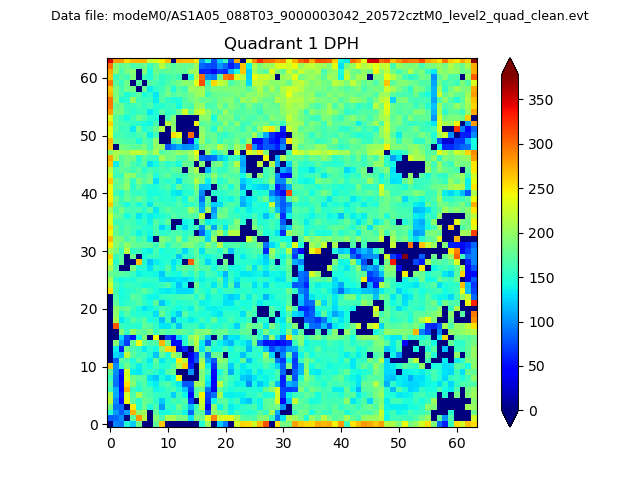
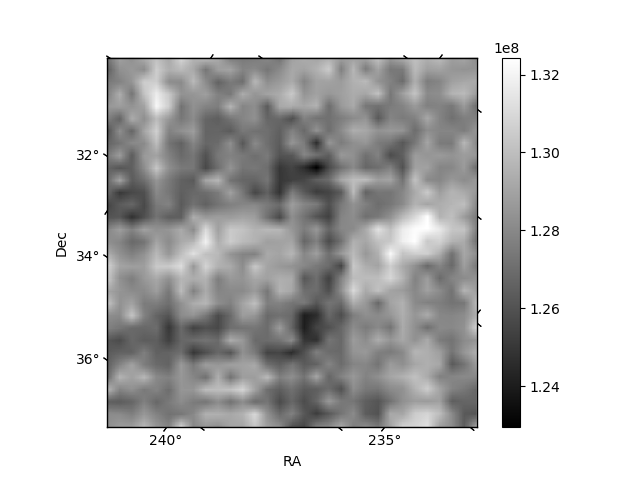
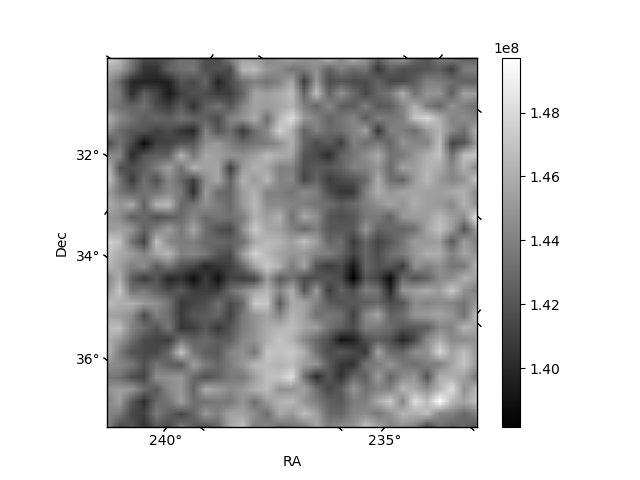
Histogram calculated using DETX and DETY for each event in the final _common_clean file
| Quadrant A |  |
 |
Quadrant B |
|---|---|---|---|
| Quadrant D |  |
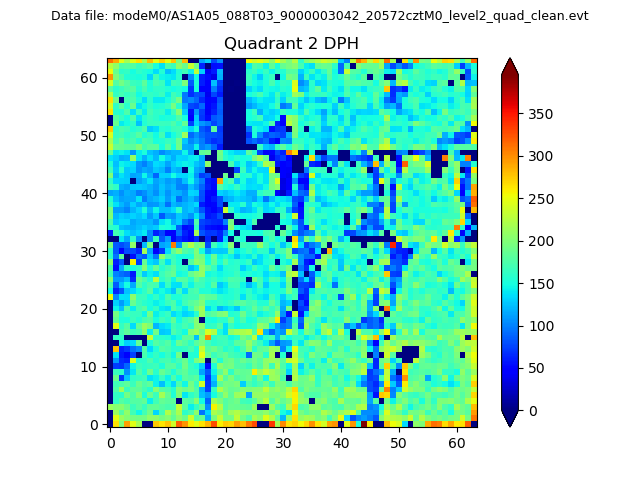 |
Quadrant C |
| Plot type | Count rate plots | Images |
|---|---|---|
| Comparison with Poisson distribution Blue bars denote a histogram of data divided into 1 sec bins. Red curve is a Poisson curve with rate = median count rate of data. |
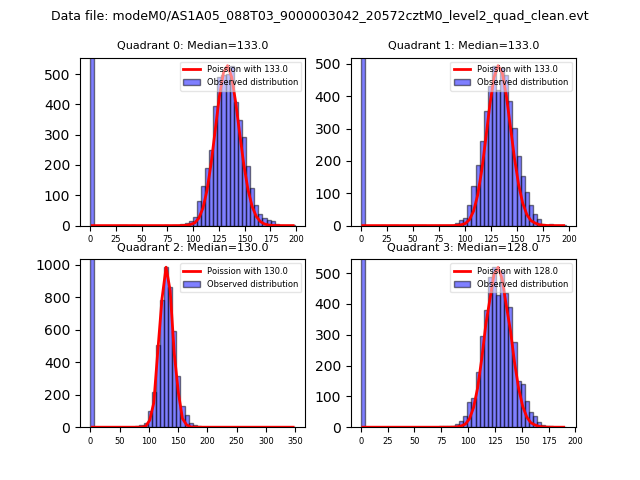 |
 |
| Quadrant-wise count rates Data is divided into 100 sec bins |
 |
|
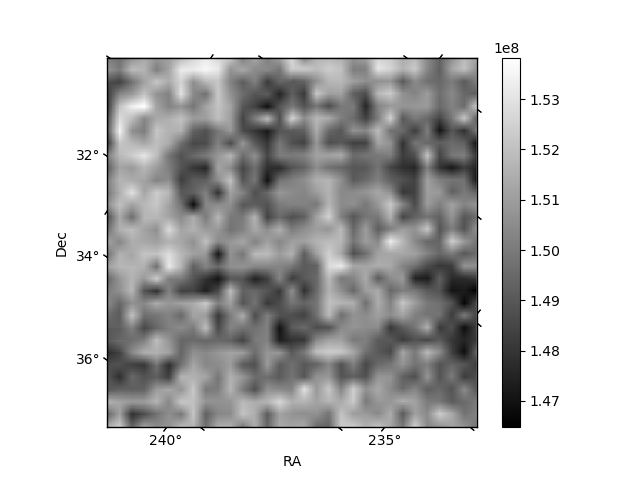
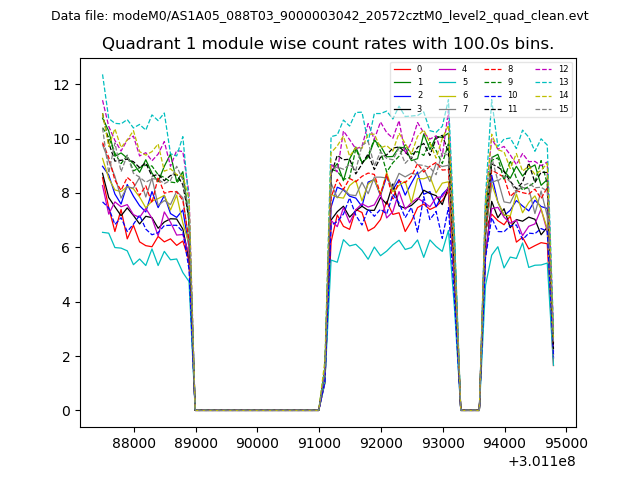
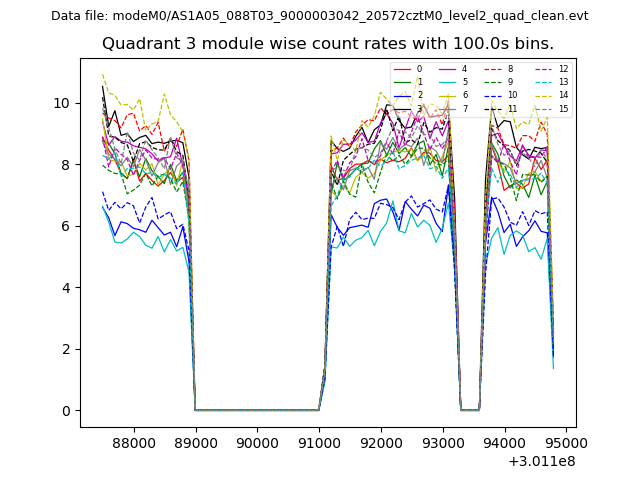
| Module-wise count rates for Quadrant A Data is divided into 100 sec bins |
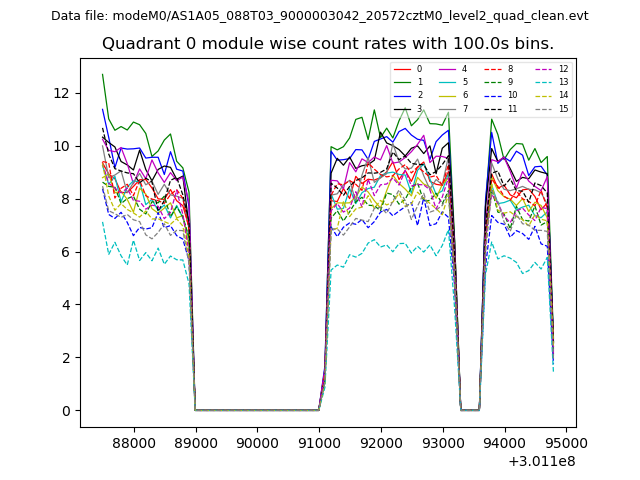 |
 |
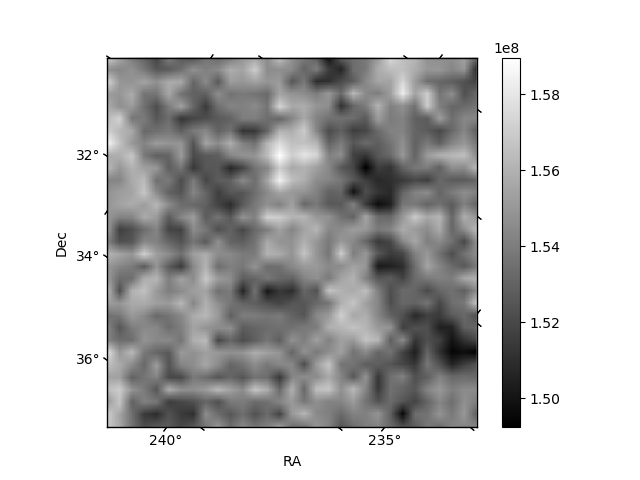
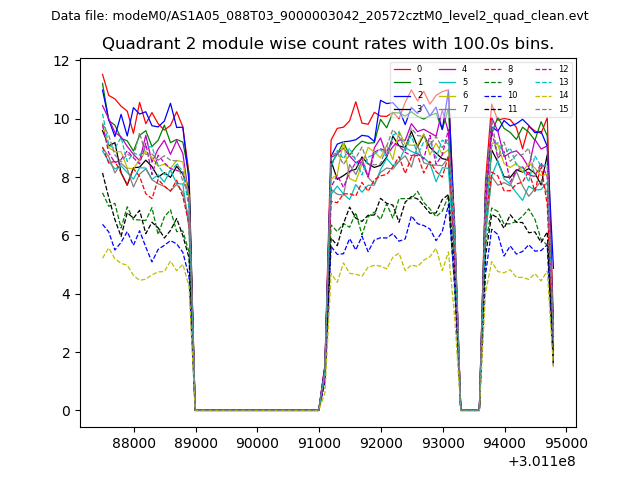
| Module-wise count rates for Quadrant B Data is divided into 100 sec bins |
 |
 |
| Module-wise count rates for Quadrant C Data is divided into 100 sec bins |
 |
 |
| Module-wise count rates for Quadrant D Data is divided into 100 sec bins |
 |
 |
| Parameter | Plot |
|---|---|
| CZT HV Monitor | 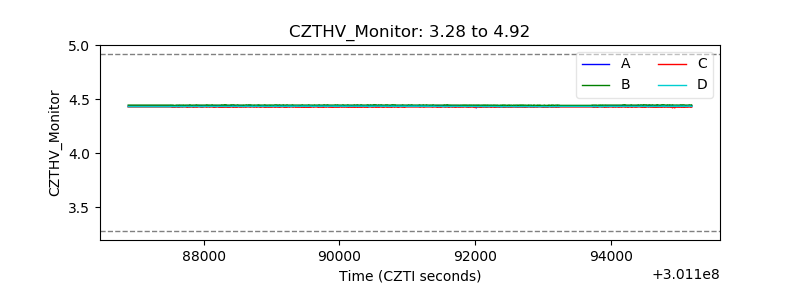 |
| D_VDD |  |
| Temperature 1 | 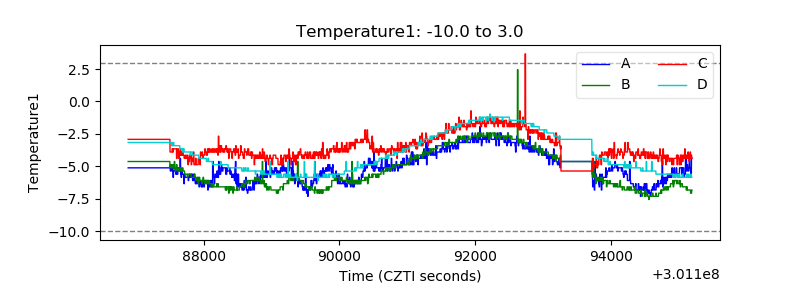 |
| Veto HV Monitor | 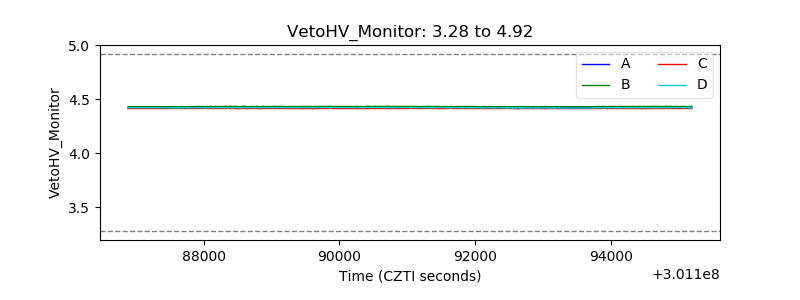 |
| Veto LLD | 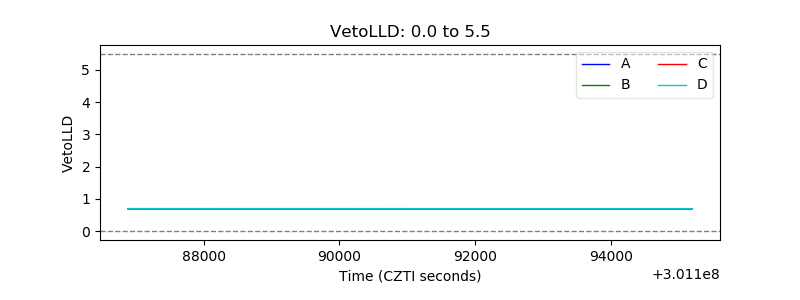 |
| Alpha Counter | 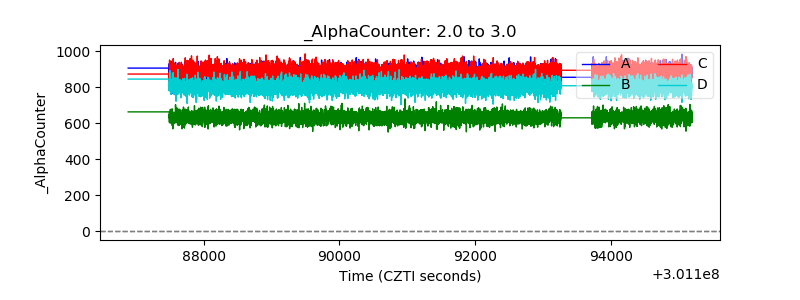 |
| _CPM_Rate | 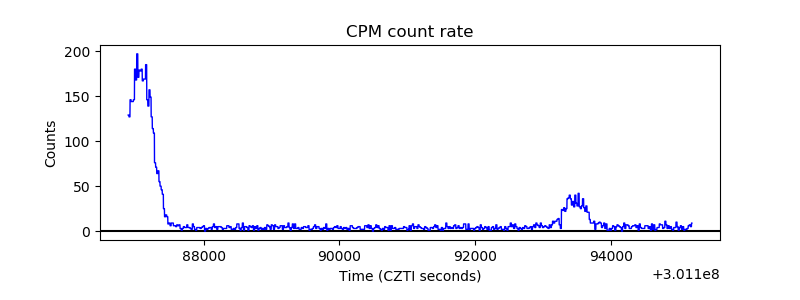 |
| CZT Counter | 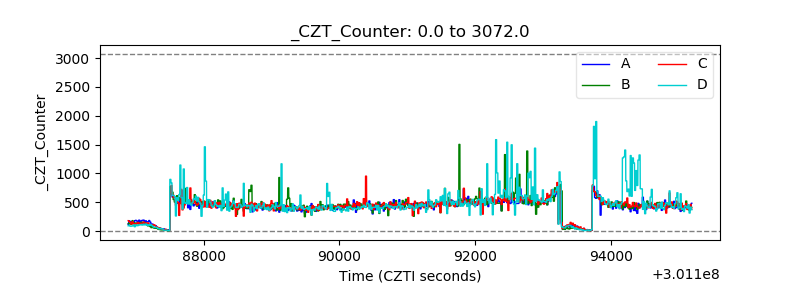 |
| +2.5 Volts monitor |  |
| +5 Volts monitor | 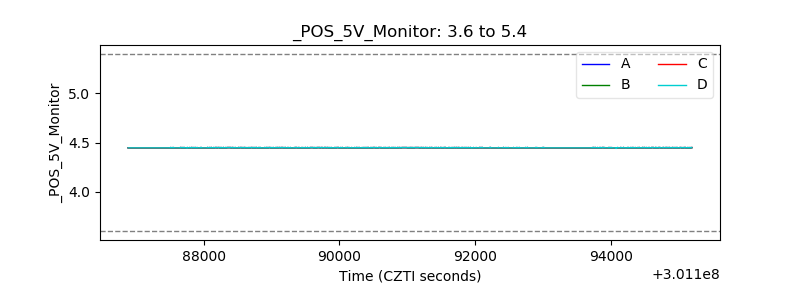 |
| _ROLL_ROT | 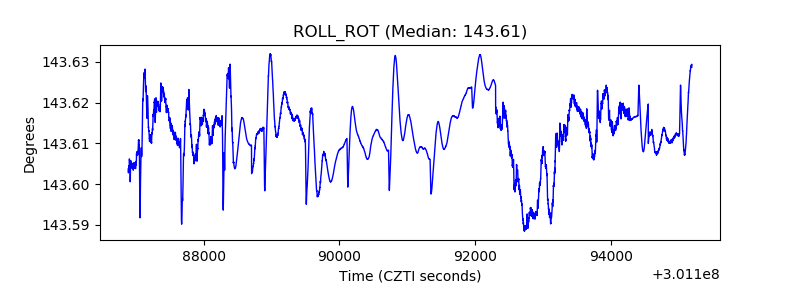 |
| _Roll_DEC | 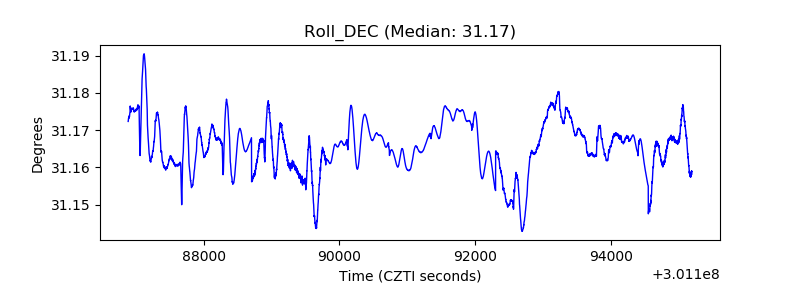 |
| _Roll_RA | 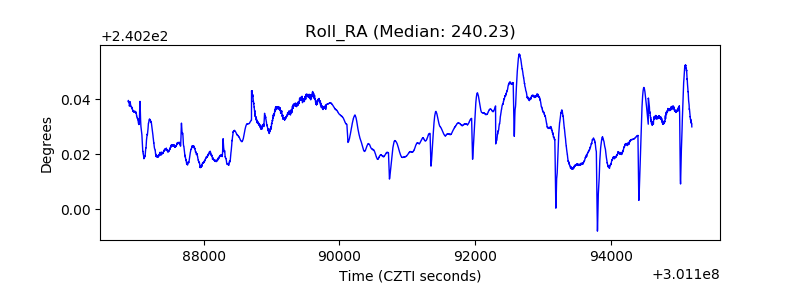 |
| Veto Counter | 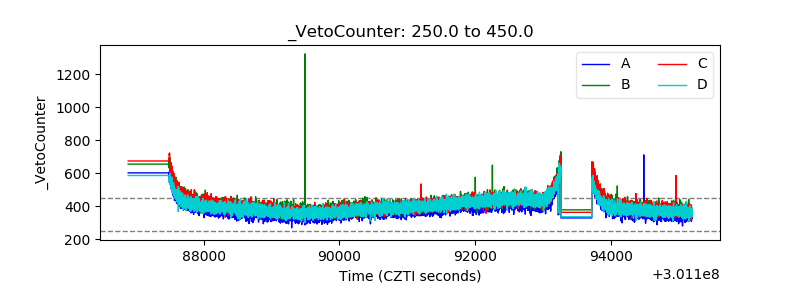 |