| Param | Original file | Final file |
|---|---|---|
| Filename | modeM0/AS1A05_088T03_9000003042_20574cztM0_level2.evt | modeM0/AS1A05_088T03_9000003042_20574cztM0_level2_quad_clean.evt |
| Size (bytes) | 406,385,280 | 65,566,080 |
| Size | 387.6 MB | 62.5 MB |
| Events in quadrant A | 2,483,397 | 411,886 |
| Events in quadrant B | 2,502,241 | 412,708 |
| Events in quadrant C | 2,477,988 | 400,900 |
| Events in quadrant D | 4,477,402 | 382,692 |
| Mode SS | |||
|---|---|---|---|
| Quadrant | BADHDUFLAG | Total packets | Discarded packets |
| A | 0 | 108 | 0 |
| B | 0 | 108 | 0 |
| C | 0 | 108 | 0 |
| D | 0 | 108 | 0 |
| Mode M0 | |||
|---|---|---|---|
| Quadrant | BADHDUFLAG | Total packets | Discarded packets |
| A | 0 | 10964 | 0 |
| B | 0 | 10896 | 0 |
| C | 0 | 10822 | 0 |
| D | 0 | 16948 | 0 |
| Quadrant | Total seconds | Saturated seconds | Saturation percentage |
|---|---|---|---|
| A | 5381 | 22 | 0.408846% |
| B | 5382 | 7 | 0.130063% |
| C | 5382 | 20 | 0.371609% |
| D | 5382 | 501 | 9.308807% |
Noise dominated data is calculated using 1-second bins in cleaned event files. If a bin has >2000 counts, and if more than 50% of those come from <1% of pixels, then it is considered to be noise-dominated and hence unusable.
| Quadrant | # 1 sec bins | Bins with >0 counts | Bins with >2000 counts | High rate bins dominated by noise | Noise dominated (total time) | Noise dominated (detector-on time) | Marked lightcurve |
|---|---|---|---|---|---|---|---|
| A | 5381 | 5381 | 16 | 16 | 0.30% | 0.30% | 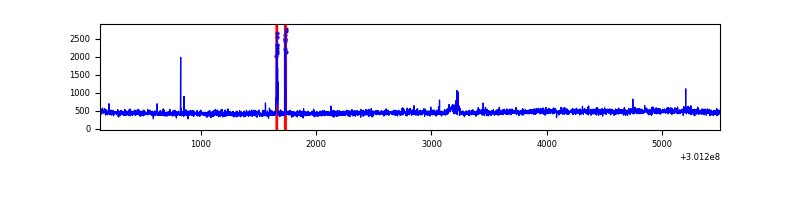 |
| B | 5382 | 5382 | 6 | 6 | 0.11% | 0.11% | 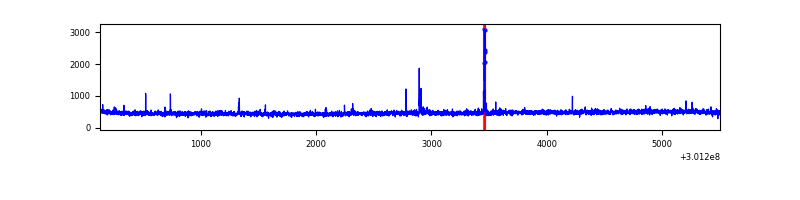 |
| C | 5382 | 5382 | 0 | 0 | 0.00% | 0.00% | 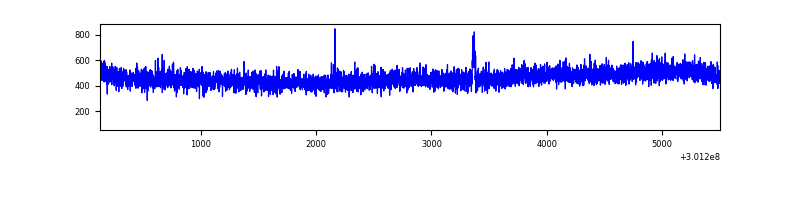 |
| D | 5382 | 5382 | 466 | 466 | 8.66% | 8.66% | 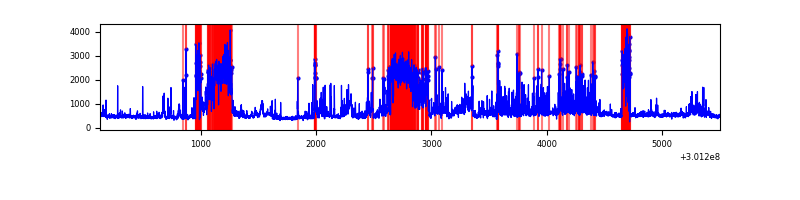 |
Top three noisy pixels from each quadrant. If the there are fewer than three noisy pixels in the level2.evt file, extra rows are filled as -1
| Pixel properties | Quadrant properties | ||||||
|---|---|---|---|---|---|---|---|
| Quadrant | DetID | PixID | Counts | Sigma | Mean | Median | Sigma |
| A | 15 | 174 | 62551 | 482.26 | 628 | 614 | 128.4 |
| A | 0 | 226 | 5339 | 36.79 | 628 | 614 | 128.4 |
| A | 3 | 137 | 5289 | 36.4 | 628 | 614 | 128.4 |
| B | 15 | 201 | 19231 | 152.73 | 626 | 609 | 121.9 |
| B | 12 | 111 | 14750 | 115.98 | 626 | 609 | 121.9 |
| B | 11 | 111 | 13053 | 102.06 | 626 | 609 | 121.9 |
| C | 14 | 238 | 95906 | 664.51 | 606 | 610 | 143.4 |
| C | 7 | 220 | 7971 | 51.33 | 606 | 610 | 143.4 |
| C | 9 | 54 | 4941 | 30.2 | 606 | 610 | 143.4 |
| D | 5 | 222 | 2063150 | 14147.7 | 592 | 575 | 145.8 |
| D | 1 | 52 | 62852 | 427.17 | 592 | 575 | 145.8 |
| D | 7 | 238 | 38567 | 260.6 | 592 | 575 | 145.8 |
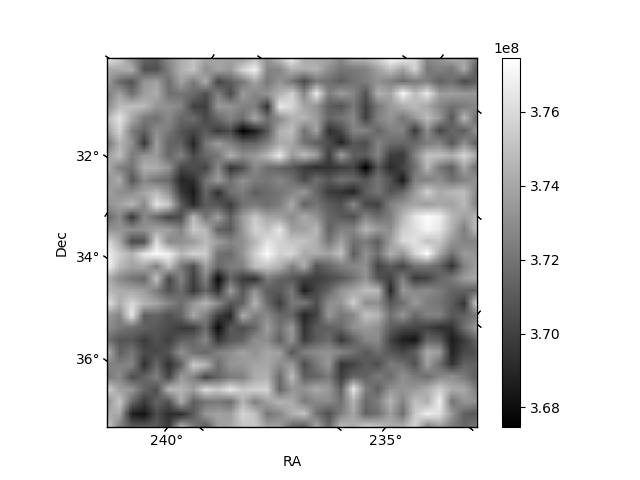
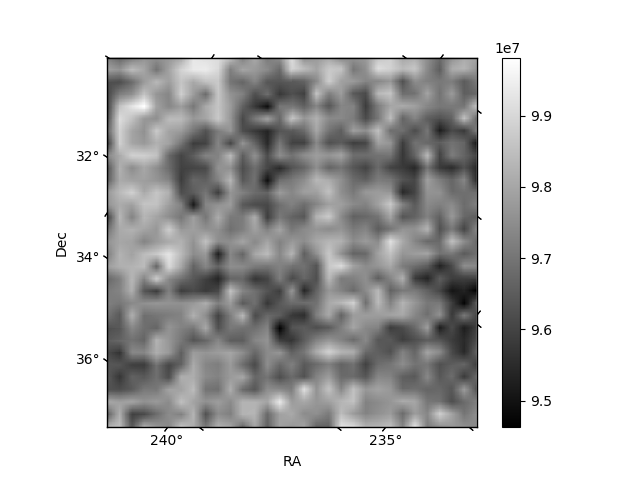
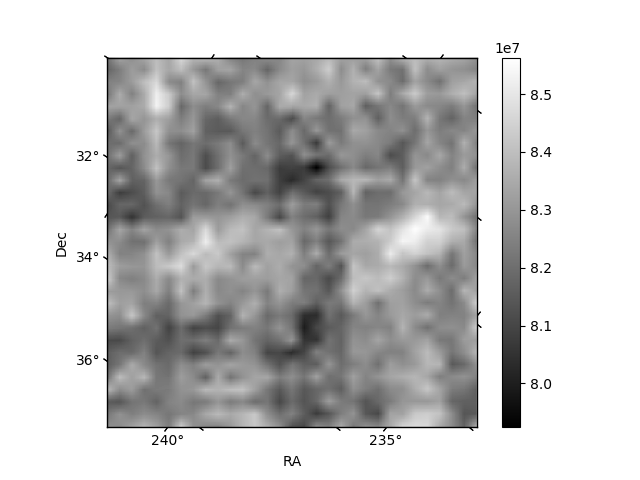
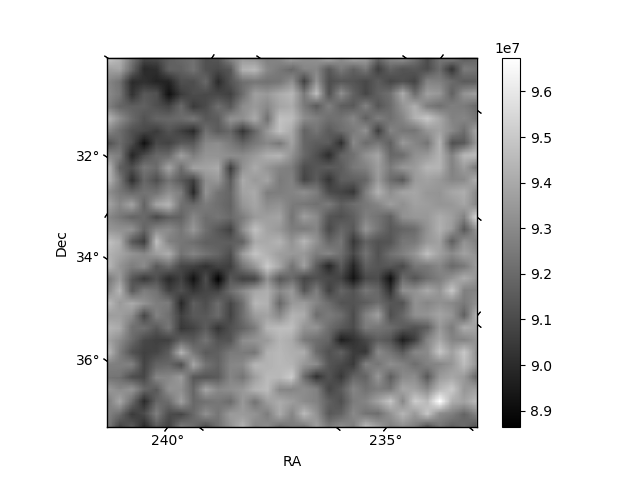
Histogram calculated using DETX and DETY for each event in the final _common_clean file
| Quadrant A | 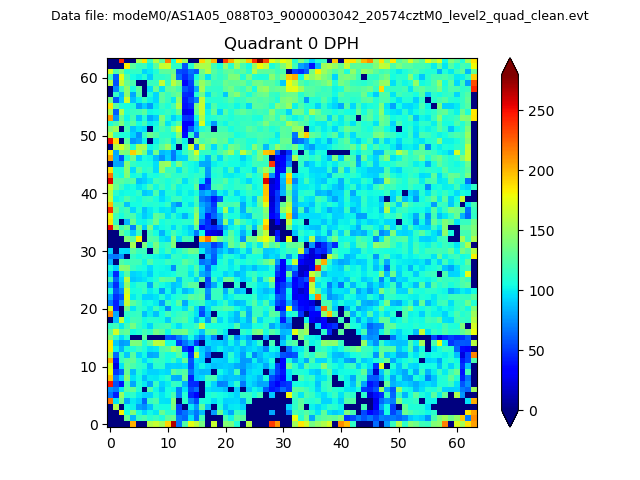 |
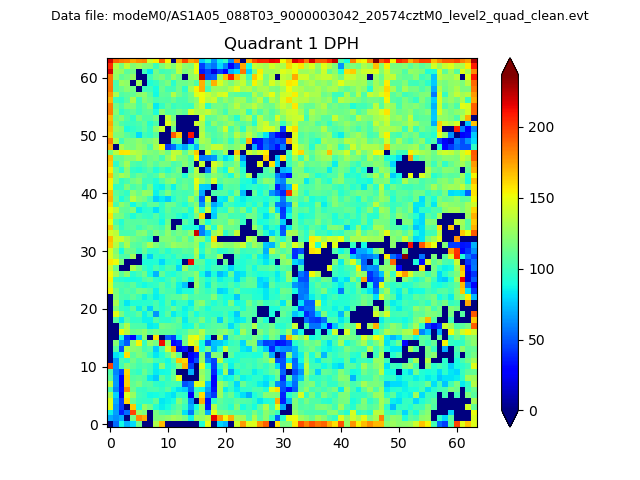 |
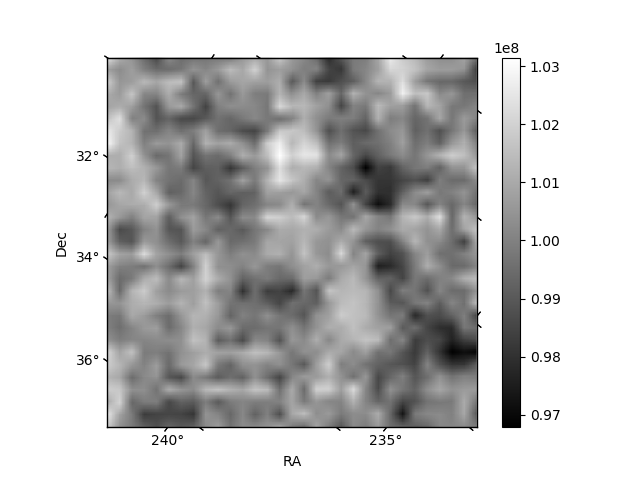
Quadrant B |
|---|---|---|---|
| Quadrant D | 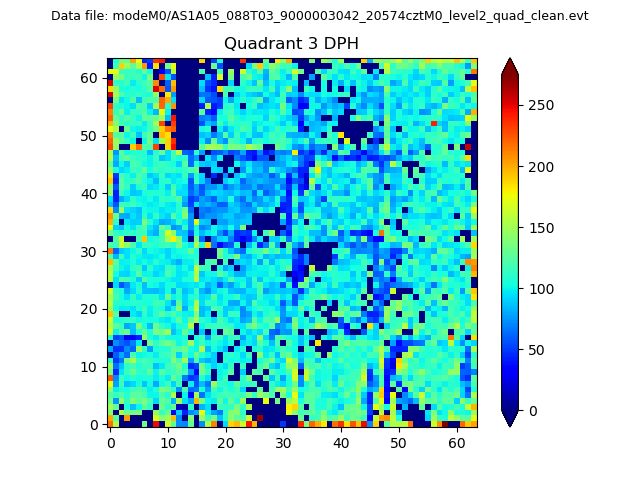 |
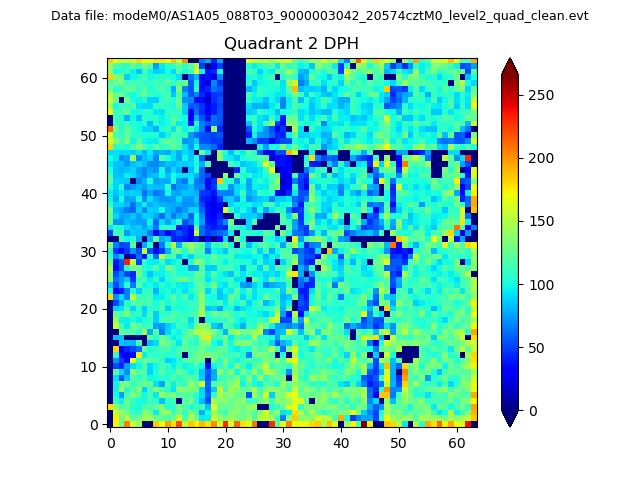 |
Quadrant C |
| Plot type | Count rate plots | Images |
|---|---|---|
| Comparison with Poisson distribution Blue bars denote a histogram of data divided into 1 sec bins. Red curve is a Poisson curve with rate = median count rate of data. |
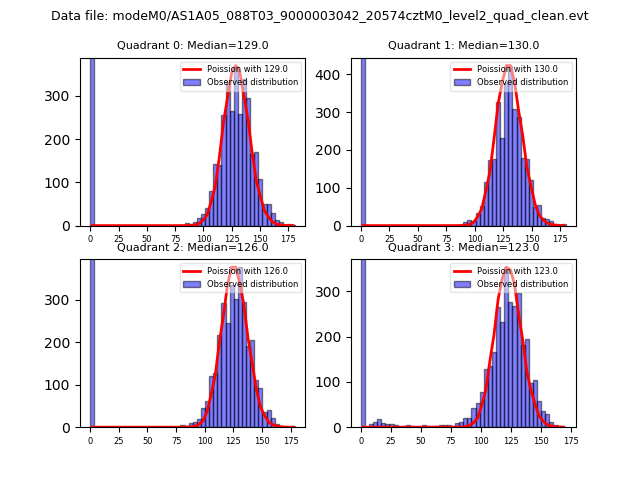 |
 |
| Quadrant-wise count rates Data is divided into 100 sec bins |
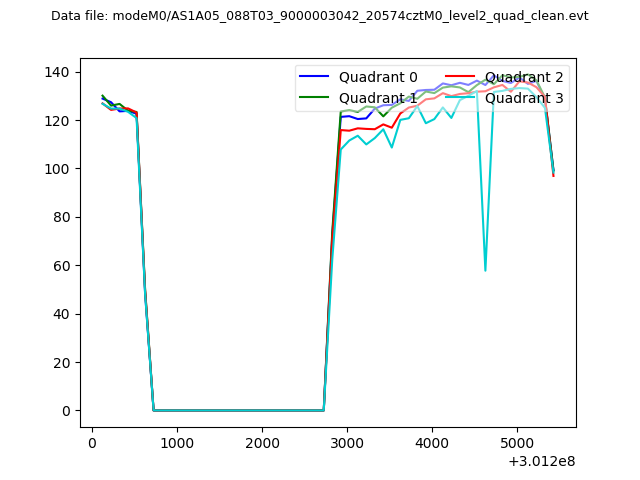 |
|
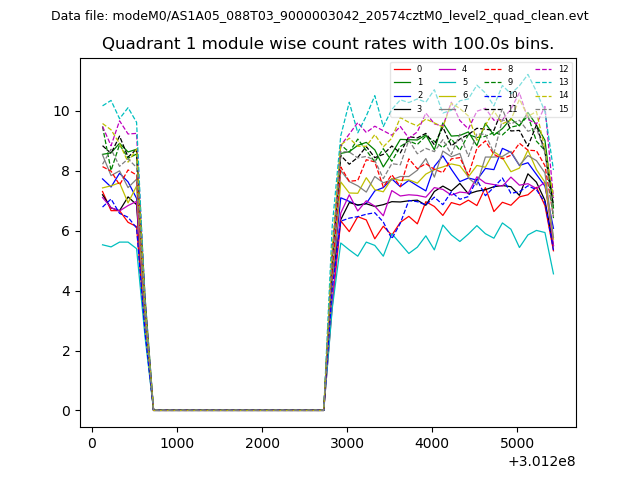
| Module-wise count rates for Quadrant A Data is divided into 100 sec bins |
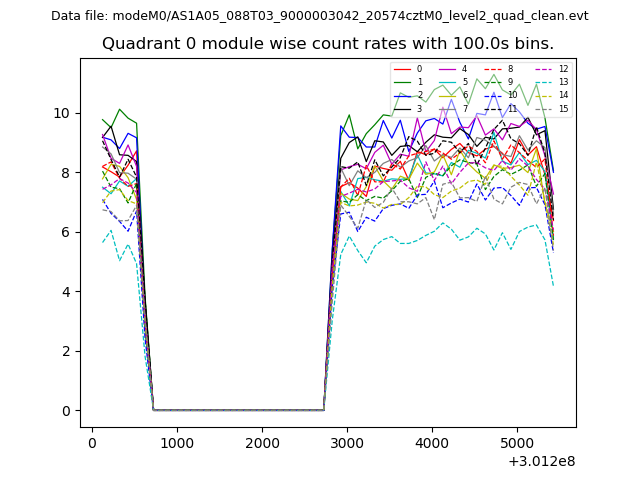 |
 |
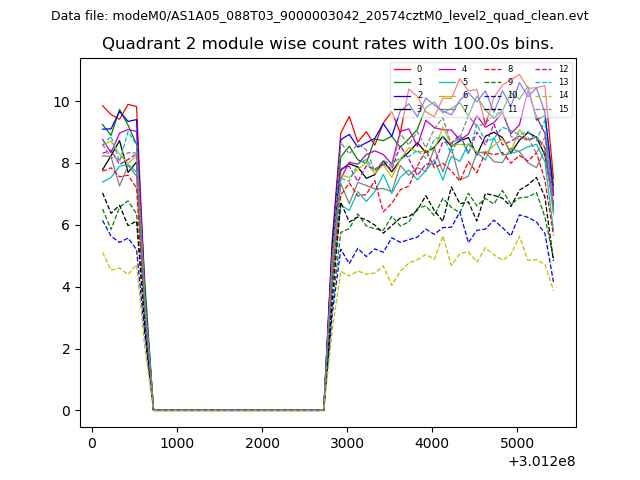
| Module-wise count rates for Quadrant B Data is divided into 100 sec bins |
 |
 |
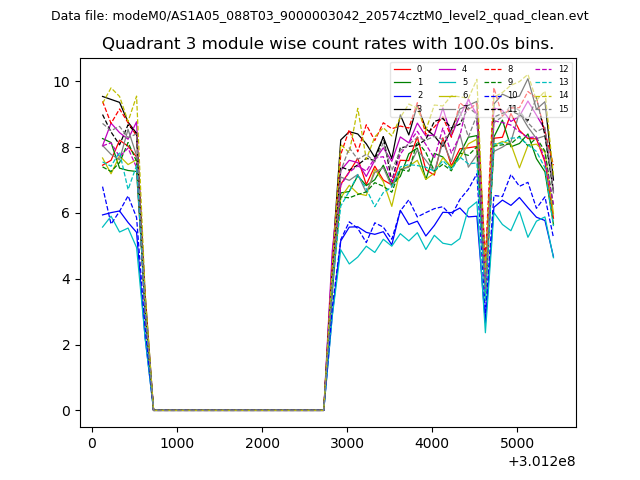
| Module-wise count rates for Quadrant C Data is divided into 100 sec bins |
 |
 |
| Module-wise count rates for Quadrant D Data is divided into 100 sec bins |
 |
 |
| Parameter | Plot |
|---|---|
| CZT HV Monitor | 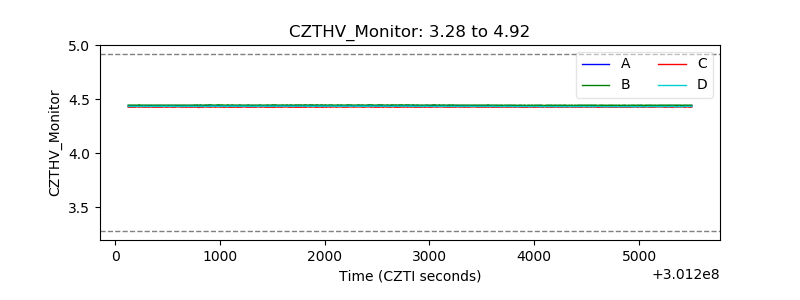 |
| D_VDD | 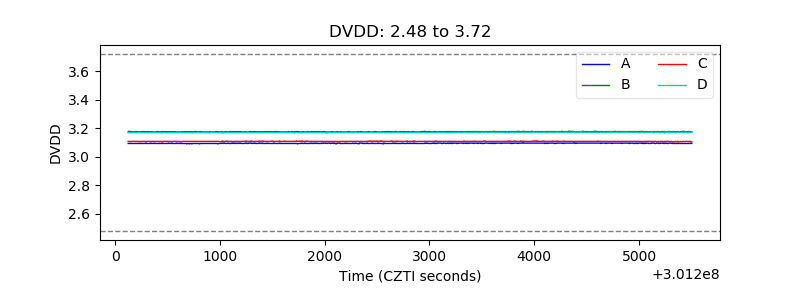 |
| Temperature 1 | 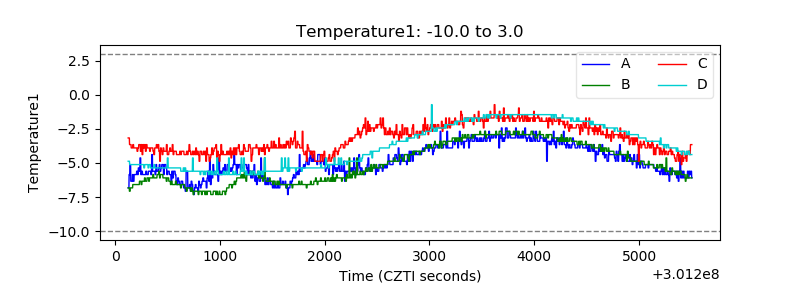 |
| Veto HV Monitor | 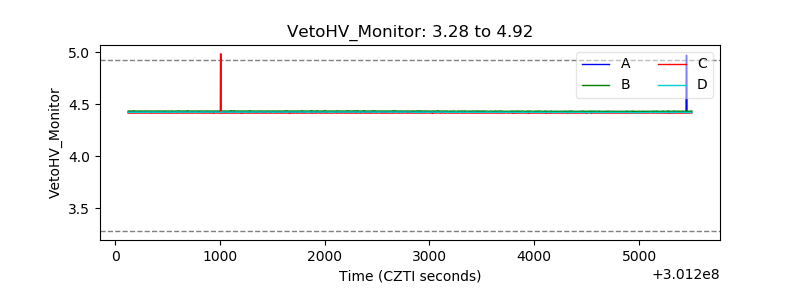 |
| Veto LLD | 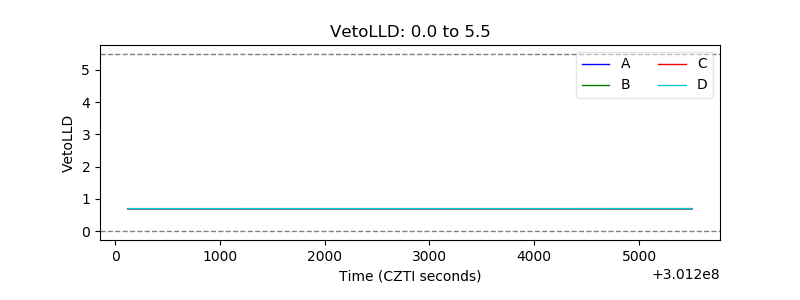 |
| Alpha Counter | 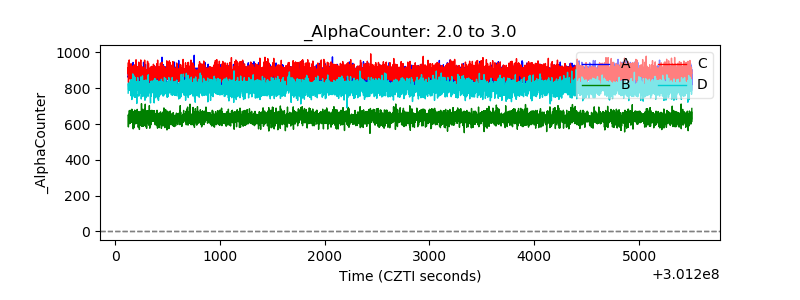 |
| _CPM_Rate | 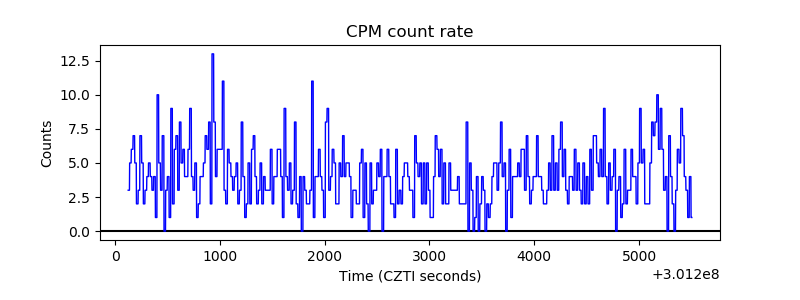 |
| CZT Counter | 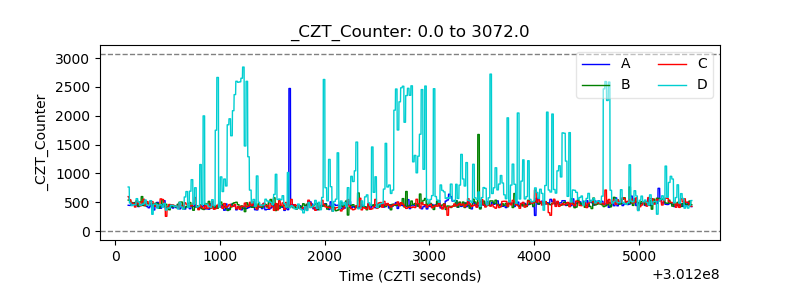 |
| +2.5 Volts monitor |  |
| +5 Volts monitor |  |
| _ROLL_ROT | 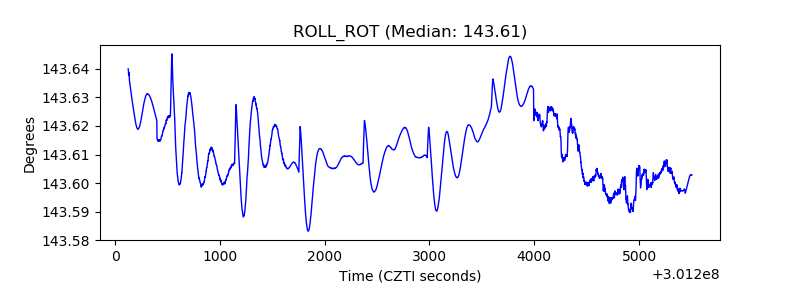 |
| _Roll_DEC | 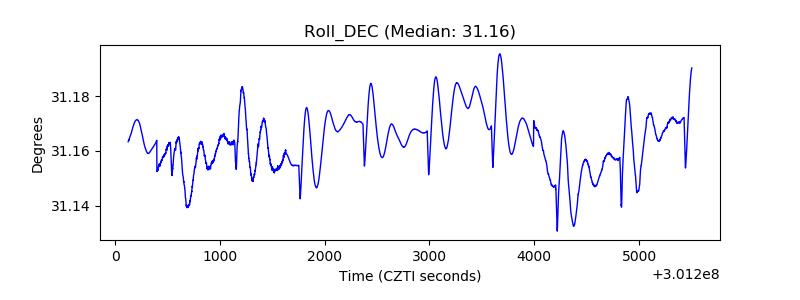 |
| _Roll_RA | 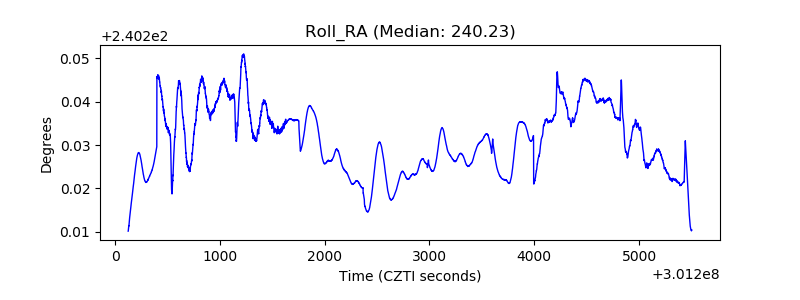 |
| Veto Counter | 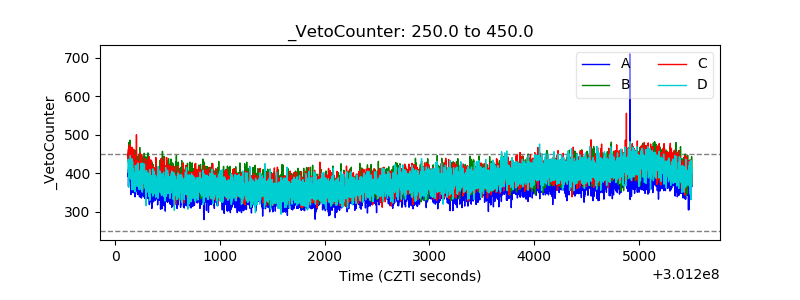 |