| Param | Original file | Final file |
|---|---|---|
| Filename | modeM0/AS1A05_088T03_9000003042_20745cztM0_level2.evt | modeM0/AS1A05_088T03_9000003042_20745cztM0_level2_quad_clean.evt |
| Size (bytes) | 128,643,840 | 25,738,560 |
| Size | 122.7 MB | 24.5 MB |
| Events in quadrant A | 911,933 | 163,845 |
| Events in quadrant B | 937,062 | 166,680 |
| Events in quadrant C | 913,158 | 159,796 |
| Events in quadrant D | 1,010,724 | 158,924 |
| Mode SS | |||
|---|---|---|---|
| Quadrant | BADHDUFLAG | Total packets | Discarded packets |
| A | 0 | 44 | 6 |
| B | 0 | 43 | 7 |
| C | 0 | 43 | 5 |
| D | 0 | 44 | 8 |
| Mode M9 | |||
|---|---|---|---|
| Quadrant | BADHDUFLAG | Total packets | Discarded packets |
| A | 0 | 4 | 1 |
| B | 0 | 4 | 2 |
| C | 0 | 4 | 2 |
| D | 0 | 5 | 3 |
| Mode M0 | |||
|---|---|---|---|
| Quadrant | BADHDUFLAG | Total packets | Discarded packets |
| A | 0 | 4467 | 779 |
| B | 0 | 4549 | 782 |
| C | 0 | 4482 | 767 |
| D | 0 | 4870 | 772 |
| Quadrant | Total seconds | Saturated seconds | Saturation percentage |
|---|---|---|---|
| A | 1761 | 9 | 0.511073% |
| B | 1761 | 7 | 0.397501% |
| C | 1767 | 23 | 1.301641% |
| D | 1772 | 16 | 0.902935% |
Noise dominated data is calculated using 1-second bins in cleaned event files. If a bin has >2000 counts, and if more than 50% of those come from <1% of pixels, then it is considered to be noise-dominated and hence unusable.
| Quadrant | # 1 sec bins | Bins with >0 counts | Bins with >2000 counts | High rate bins dominated by noise | Noise dominated (total time) | Noise dominated (detector-on time) | Marked lightcurve |
|---|---|---|---|---|---|---|---|
| A | 2677 | 1792 | 0 | 0 | 0.00% | 0.00% | 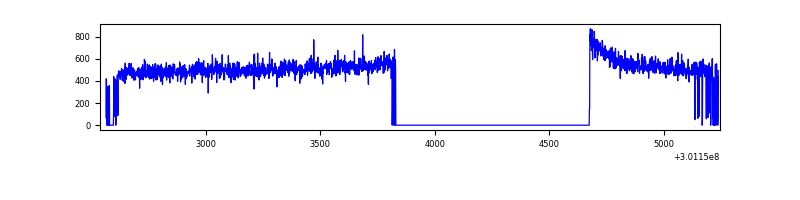 |
| B | 2668 | 1803 | 0 | 0 | 0.00% | 0.00% |  |
| C | 2693 | 1805 | 0 | 0 | 0.00% | 0.00% | 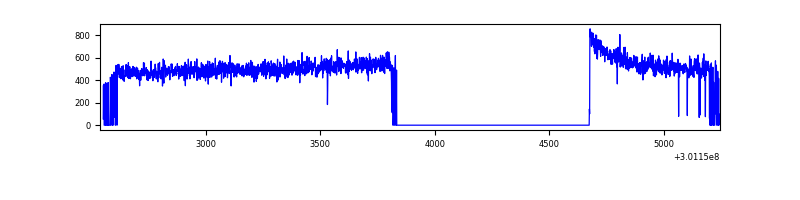 |
| D | 2710 | 1810 | 9 | 9 | 0.33% | 0.50% | 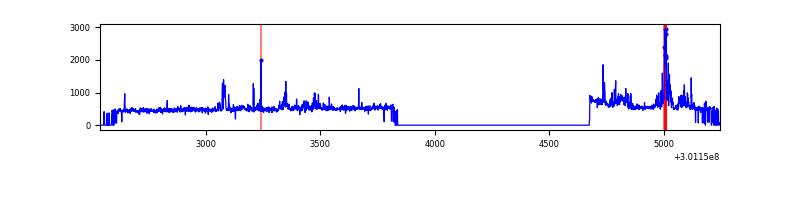 |
Top three noisy pixels from each quadrant. If the there are fewer than three noisy pixels in the level2.evt file, extra rows are filled as -1
| Pixel properties | Quadrant properties | ||||||
|---|---|---|---|---|---|---|---|
| Quadrant | DetID | PixID | Counts | Sigma | Mean | Median | Sigma |
| A | 3 | 137 | 2068 | 36.67 | 237 | 232 | 50.1 |
| A | 0 | 226 | 2052 | 36.35 | 237 | 232 | 50.1 |
| A | 12 | 194 | 1697 | 29.26 | 237 | 232 | 50.1 |
| B | 6 | 36 | 6989 | 144.24 | 233 | 226 | 46.9 |
| B | 0 | 197 | 5664 | 115.98 | 233 | 226 | 46.9 |
| B | 12 | 111 | 5619 | 115.02 | 233 | 226 | 46.9 |
| C | 14 | 238 | 35034 | 637.47 | 224 | 225 | 54.6 |
| C | 3 | 233 | 3297 | 56.26 | 224 | 225 | 54.6 |
| C | 13 | 61 | 1631 | 25.75 | 224 | 225 | 54.6 |
| D | 1 | 52 | 102679 | 1808.43 | 229 | 222 | 56.7 |
| D | 5 | 222 | 27681 | 484.67 | 229 | 222 | 56.7 |
| D | 1 | 20 | 8672 | 149.15 | 229 | 222 | 56.7 |
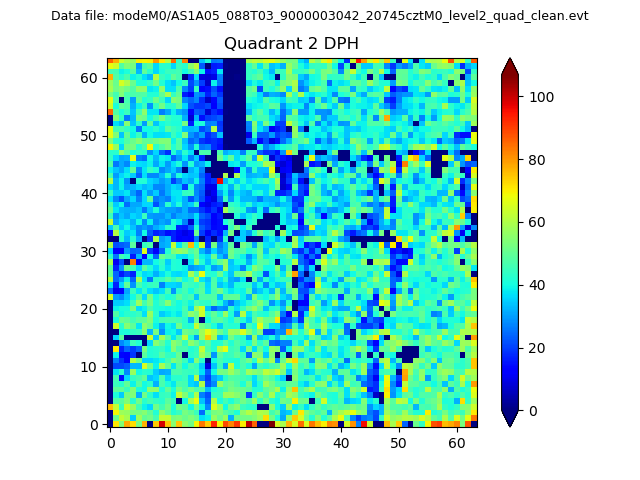
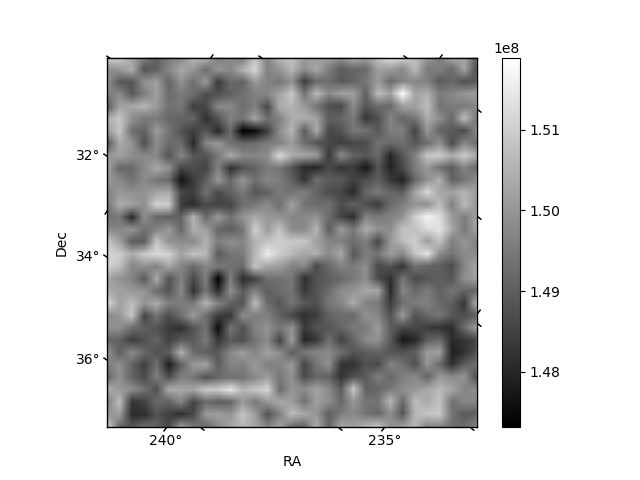
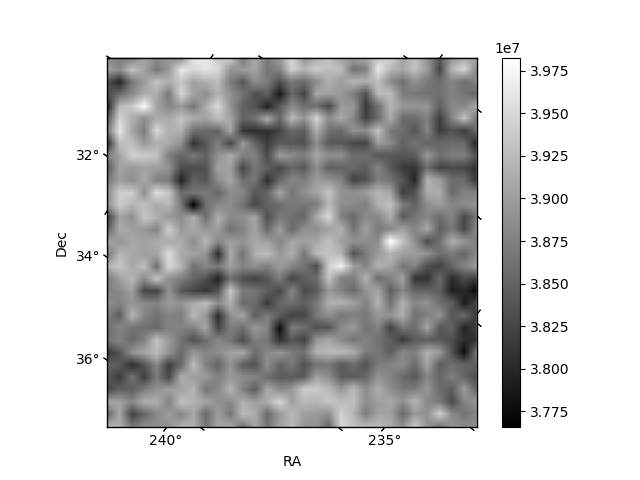
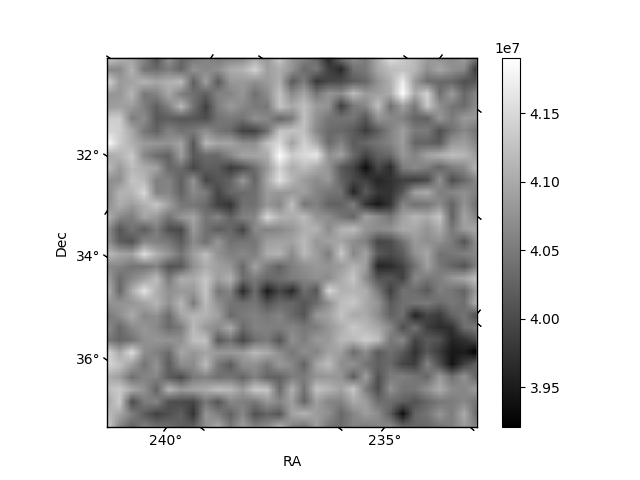
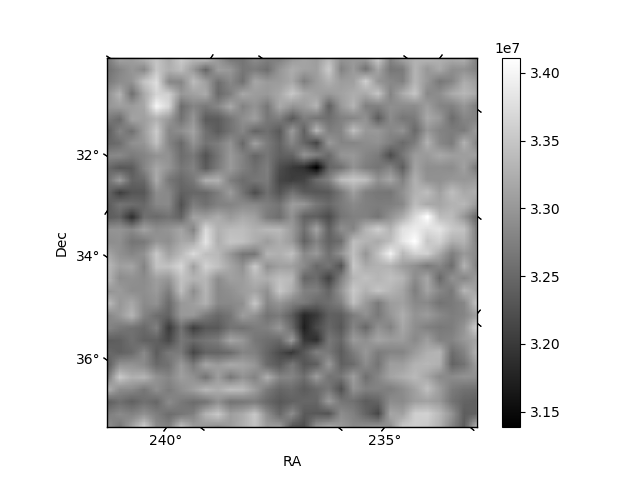
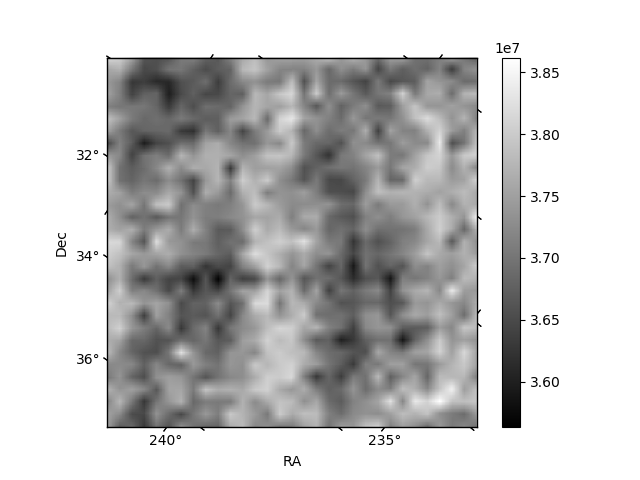
Histogram calculated using DETX and DETY for each event in the final _common_clean file
| Quadrant A | 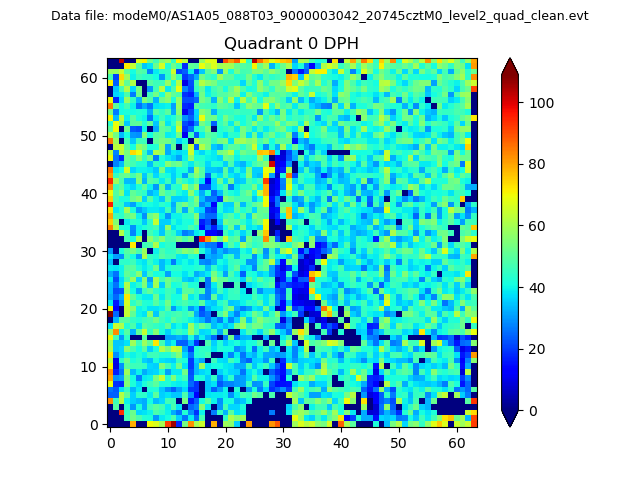 |
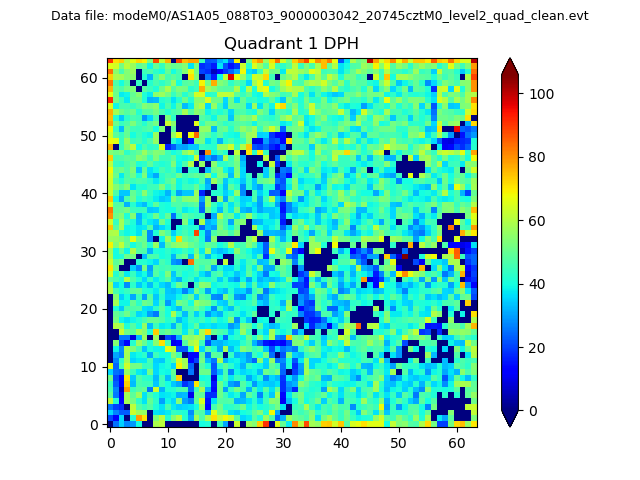 |
Quadrant B |
|---|---|---|---|
| Quadrant D | 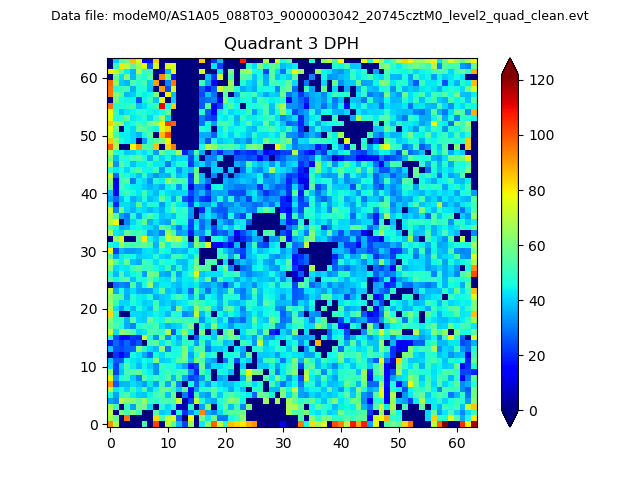 |
 |
Quadrant C |
| Plot type | Count rate plots | Images |
|---|---|---|
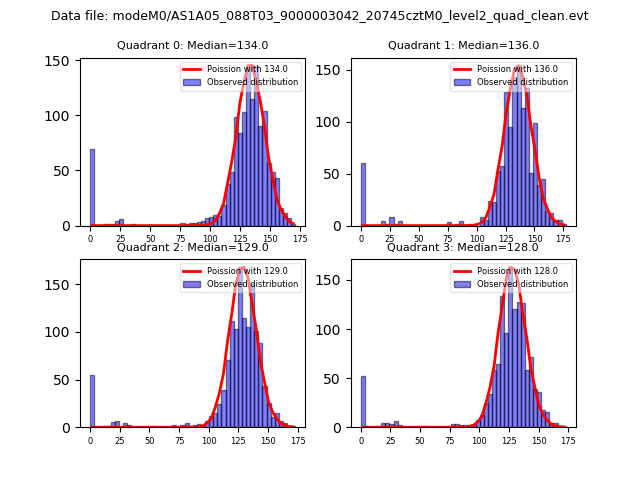
| Comparison with Poisson distribution Blue bars denote a histogram of data divided into 1 sec bins. Red curve is a Poisson curve with rate = median count rate of data. |
 |
 |
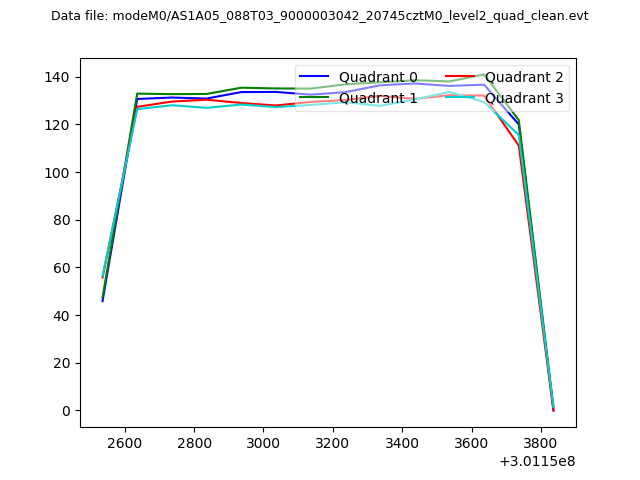
| Quadrant-wise count rates Data is divided into 100 sec bins |
 |
|
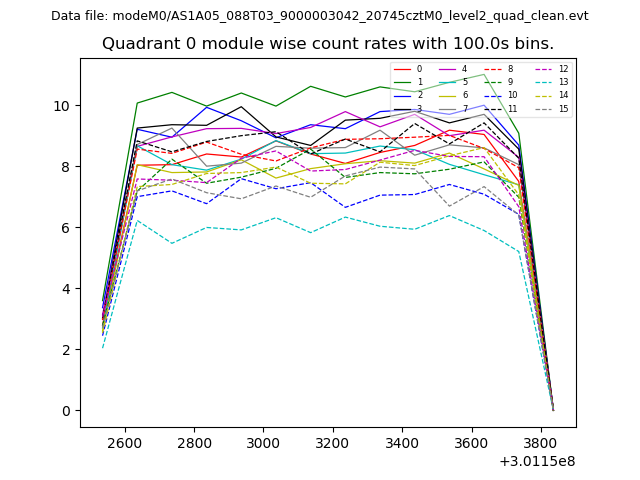
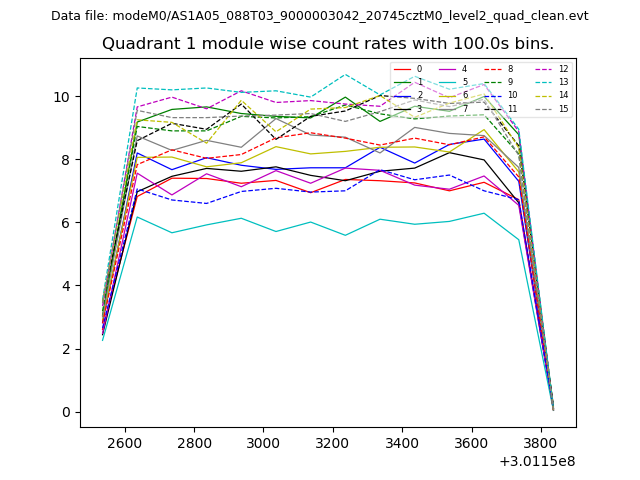
| Module-wise count rates for Quadrant A Data is divided into 100 sec bins |
 |
 |
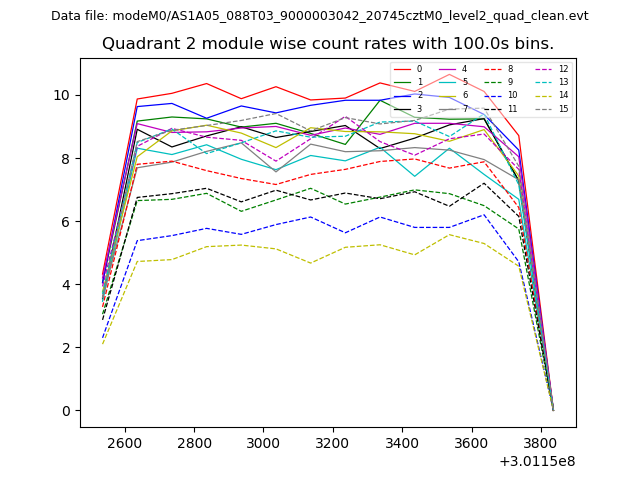
| Module-wise count rates for Quadrant B Data is divided into 100 sec bins |
 |
 |
| Module-wise count rates for Quadrant C Data is divided into 100 sec bins |
 |
 |
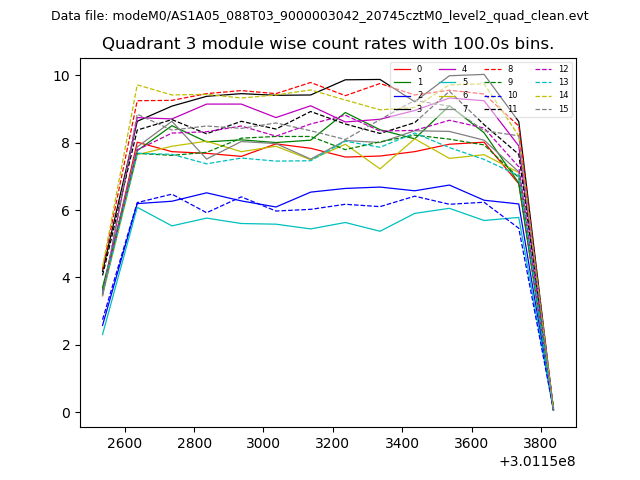
| Module-wise count rates for Quadrant D Data is divided into 100 sec bins |
 |
 |
| Parameter | Plot |
|---|---|
| CZT HV Monitor | 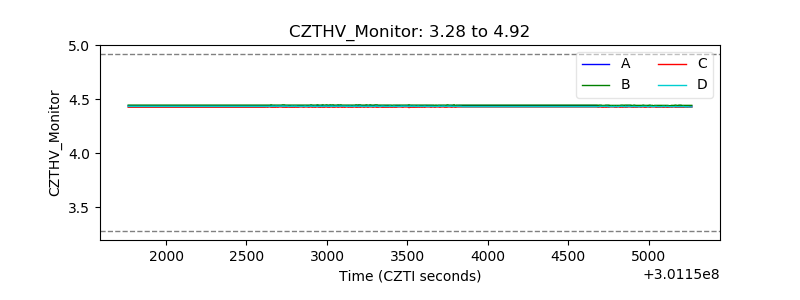 |
| D_VDD | 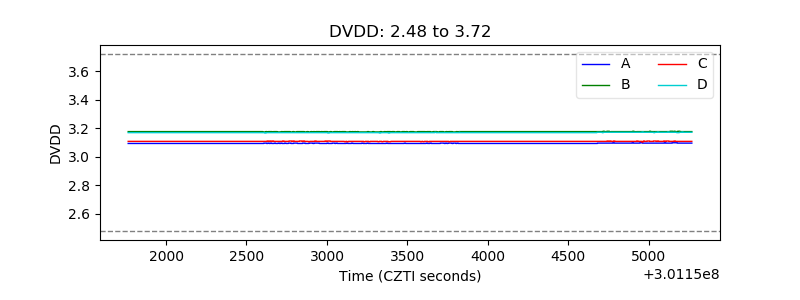 |
| Temperature 1 | 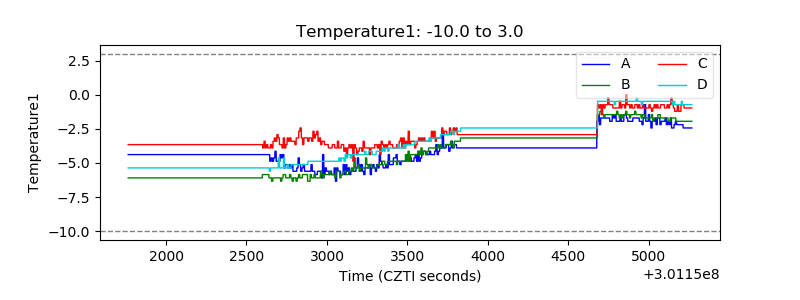 |
| Veto HV Monitor | 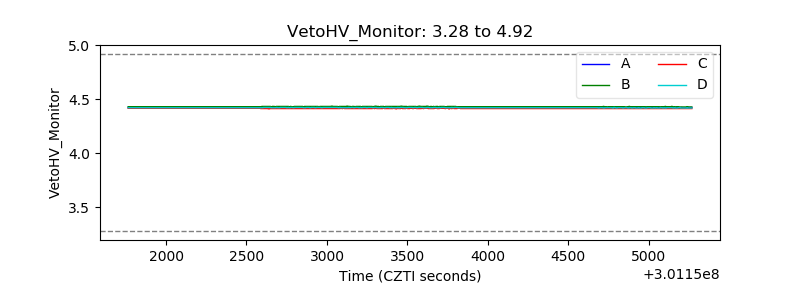 |
| Veto LLD | 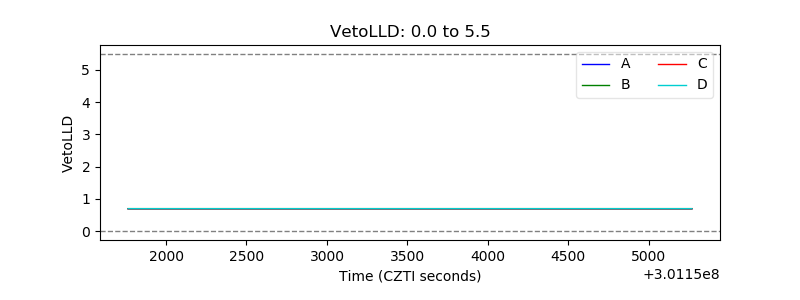 |
| Alpha Counter | 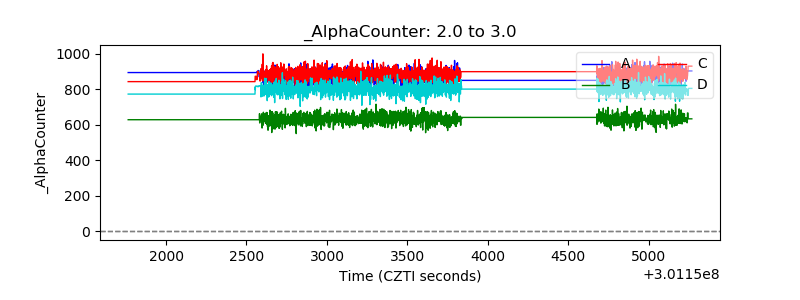 |
| _CPM_Rate |  |
| CZT Counter | 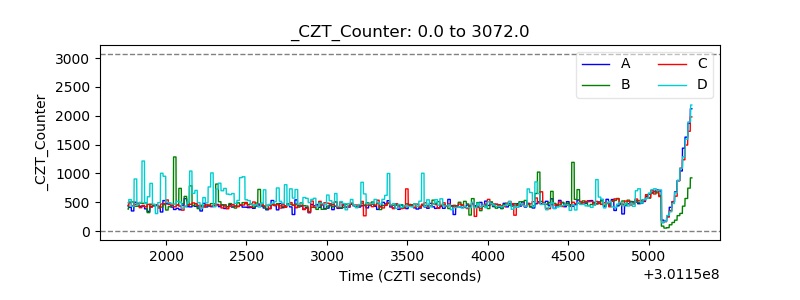 |
| +2.5 Volts monitor |  |
| +5 Volts monitor |  |
| _ROLL_ROT | 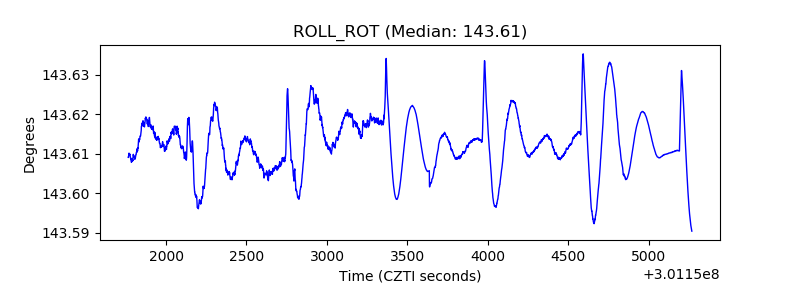 |
| _Roll_DEC |  |
| _Roll_RA | 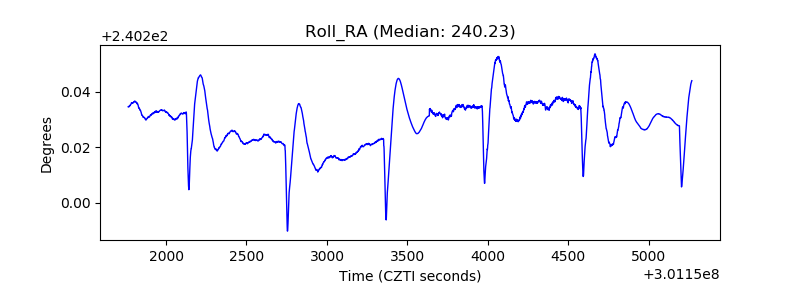 |
| Veto Counter | 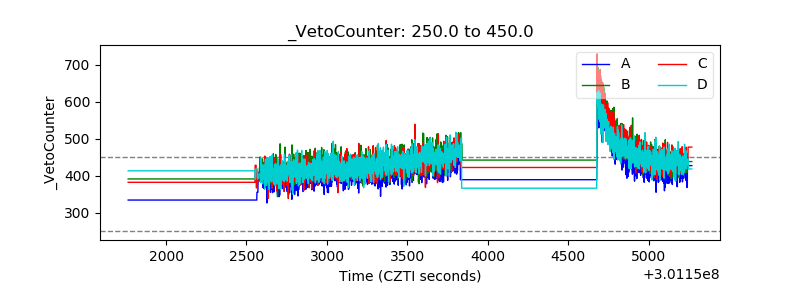 |