| Param | Original file | Final file |
|---|---|---|
| Filename | modeM0/AS1A06_003T04_9000003046cztM0_level2.fits | modeM0/AS1A06_003T04_9000003046cztM0_level2_quad_clean.evt |
| Size (bytes) | 1,887,494,400 | 1,639,025,280 |
| Size | 1.8 GB | 1.5 GB |
| Events in quadrant A | 11,751,964 | 9,620,461 |
| Events in quadrant B | 11,188,276 | 9,663,784 |
| Events in quadrant C | 11,500,944 | 9,240,928 |
| Events in quadrant D | 9,859,082 | 8,252,178 |
| Mode M0 | |||
|---|---|---|---|
| Quadrant | BADHDUFLAG | Total packets | Discarded packets |
| A | 0 | 398663 | 0 |
| B | 0 | 429017 | 0 |
| C | 0 | 413106 | 0 |
| D | 0 | 540004 | 0 |
| Mode SS | |||
|---|---|---|---|
| Quadrant | BADHDUFLAG | Total packets | Discarded packets |
| A | 0 | 3826 | 0 |
| B | 0 | 3826 | 0 |
| C | 0 | 3826 | 0 |
| D | 0 | 3826 | 0 |
| Mode M9 | |||
|---|---|---|---|
| Quadrant | BADHDUFLAG | Total packets | Discarded packets |
| A | 0 | 341 | 0 |
| B | 0 | 341 | 0 |
| C | 0 | 341 | 0 |
| D | 0 | 341 | 0 |
| Quadrant | Total seconds | Saturated seconds | Saturation percentage |
|---|---|---|---|
| A | 187737 | 2185 | 1.163862% |
| B | 187737 | 3732 | 1.987887% |
| C | 187737 | 3743 | 1.993747% |
| D | 187737 | 10350 | 5.513032% |
Noise dominated data is calculated using 1-second bins in cleaned event files. If a bin has >2000 counts, and if more than 50% of those come from <1% of pixels, then it is considered to be noise-dominated and hence unusable.
| Quadrant | # 1 sec bins | Bins with >0 counts | Bins with >2000 counts | High rate bins dominated by noise | Noise dominated (total time) | Noise dominated (detector-on time) | Marked lightcurve |
|---|---|---|---|---|---|---|---|
| A | 221047 | 187735 | 0 | 0 | 0.00% | 0.00% | 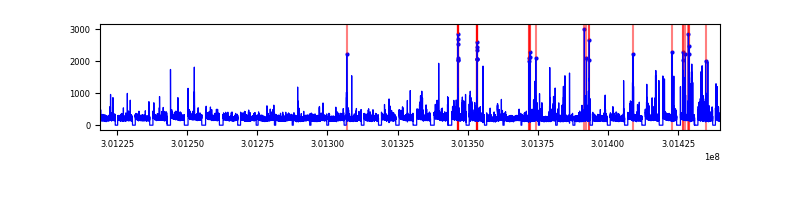 |
| B | 221047 | 187734 | 0 | 0 | 0.00% | 0.00% | 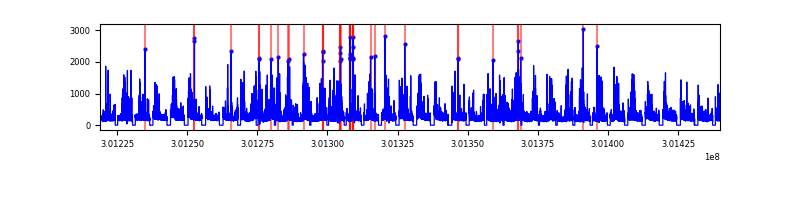 |
| C | 221047 | 187738 | 0 | 0 | 0.00% | 0.00% |  |
| D | 221047 | 187665 | 0 | 0 | 0.00% | 0.00% |  |
Top three noisy pixels from each quadrant. If the there are fewer than three noisy pixels in the level2.evt file, extra rows are filled as -1
| Pixel properties | Quadrant properties | ||||||
|---|---|---|---|---|---|---|---|
| Quadrant | DetID | PixID | Counts | Sigma | Mean | Median | Sigma |
| A | 0 | 29 | 11374 | 11.45 | 3063 | 2881 | 741.8 |
| A | 7 | 110 | 9459 | 8.87 | 3063 | 2881 | 741.8 |
| A | 9 | 19 | 8920 | 8.14 | 3063 | 2881 | 741.8 |
| B | 2 | 9 | 9115 | 11.03 | 2963 | 2833 | 569.6 |
| B | 2 | 8 | 7604 | 8.38 | 2963 | 2833 | 569.6 |
| B | 3 | 17 | 7357 | 7.94 | 2963 | 2833 | 569.6 |
| C | 12 | 241 | 7900 | 6.57 | 3039 | 2842 | 769.6 |
| C | 12 | 250 | 7832 | 6.48 | 3039 | 2842 | 769.6 |
| C | 3 | 126 | 7792 | 6.43 | 3039 | 2842 | 769.6 |
| D | 6 | 231 | 6986 | 5.95 | 2826 | 2583 | 739.4 |
| D | 3 | 14 | 6907 | 5.85 | 2826 | 2583 | 739.4 |
| D | 10 | 189 | 6891 | 5.83 | 2826 | 2583 | 739.4 |
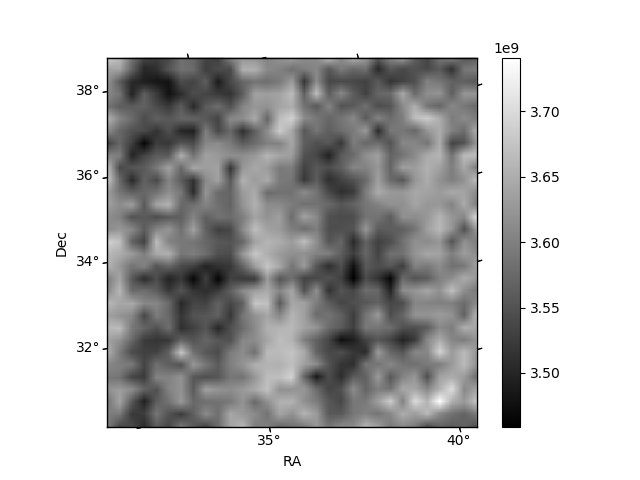
Histogram calculated using DETX and DETY for each event in the final _common_clean file
| Quadrant A |  |
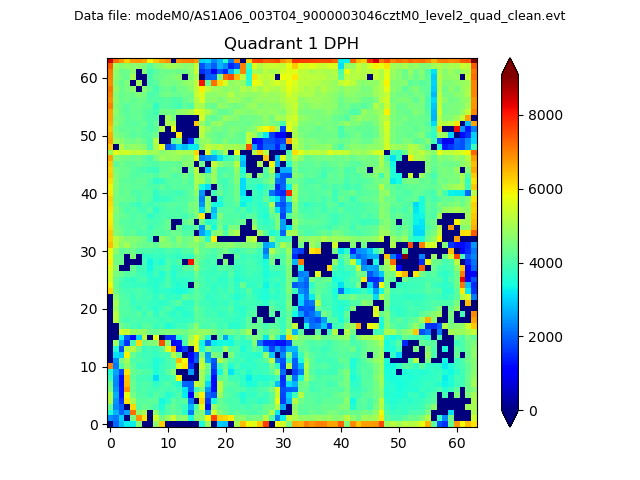 |
Quadrant B |
|---|---|---|---|
| Quadrant D |  |
 |
Quadrant C |
| Plot type | Count rate plots | Images |
|---|---|---|
| Comparison with Poisson distribution Blue bars denote a histogram of data divided into 1 sec bins. Red curve is a Poisson curve with rate = median count rate of data. |
 |
 |
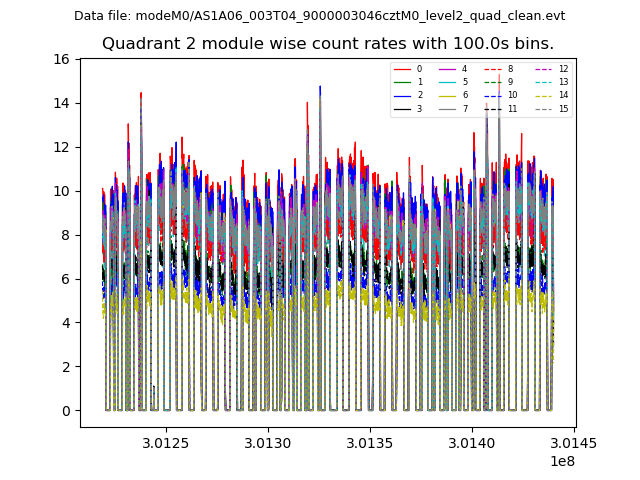
| Quadrant-wise count rates Data is divided into 100 sec bins |
 |
|
| Module-wise count rates for Quadrant A Data is divided into 100 sec bins |
 |
 |
| Module-wise count rates for Quadrant B Data is divided into 100 sec bins |
 |
 |
| Module-wise count rates for Quadrant C Data is divided into 100 sec bins |
 |
 |
| Module-wise count rates for Quadrant D Data is divided into 100 sec bins |
 |
 |
| Parameter | Plot |
|---|---|
| CZT HV Monitor |  |
| D_VDD | 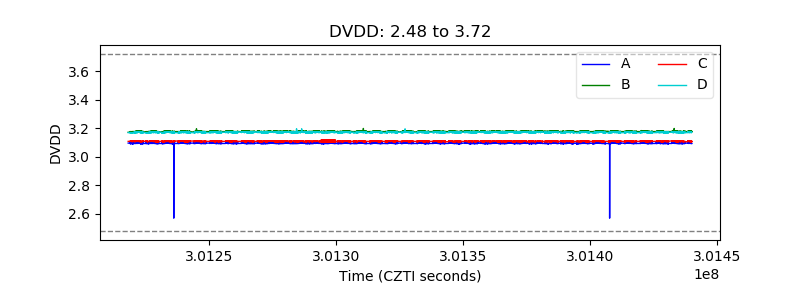 |
| Temperature 1 |  |
| Veto HV Monitor |  |
| Veto LLD |  |
| Alpha Counter |  |
| _CPM_Rate | 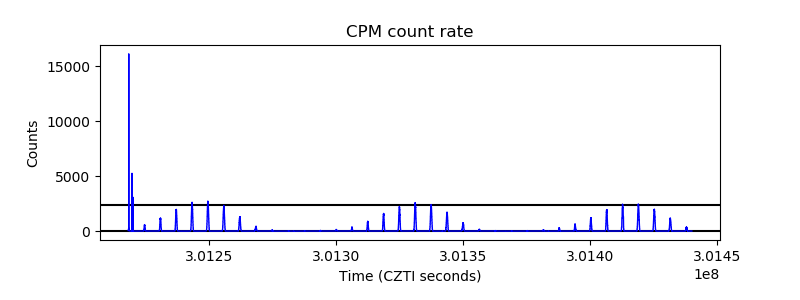 |
| CZT Counter |  |
| +2.5 Volts monitor | 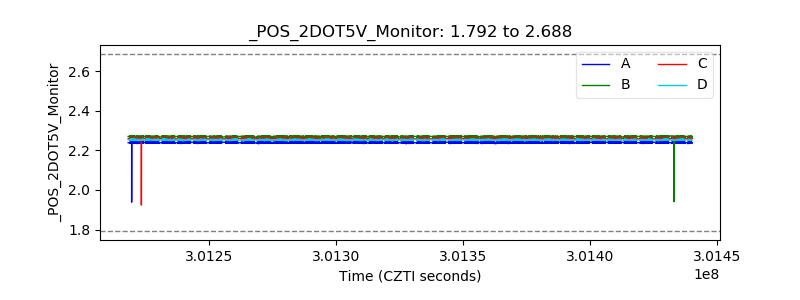 |
| +5 Volts monitor |  |
| _ROLL_ROT |  |
| _Roll_DEC | 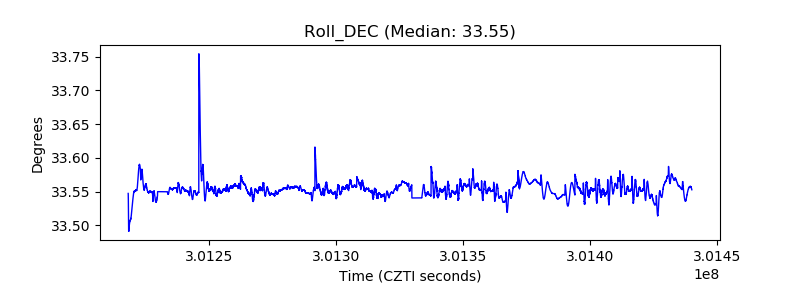 |
| _Roll_RA |  |
| Veto Counter |  |