| Param | Original file | Final file |
|---|---|---|
| Filename | modeM0/AS1A06_003T04_9000003046_20580cztM0_level2.evt | modeM0/AS1A06_003T04_9000003046_20580cztM0_level2_quad_clean.evt |
| Size (bytes) | 1,279,895,040 | 211,213,440 |
| Size | 1.2 GB | 201.4 MB |
| Events in quadrant A | 8,407,296 | 1,323,680 |
| Events in quadrant B | 9,408,698 | 1,343,183 |
| Events in quadrant C | 8,393,680 | 1,287,613 |
| Events in quadrant D | 11,368,377 | 1,234,542 |
| Mode M0 | |||
|---|---|---|---|
| Quadrant | BADHDUFLAG | Total packets | Discarded packets |
| A | 0 | 36109 | 4 |
| B | 0 | 38967 | 4 |
| C | 0 | 35936 | 4 |
| D | 0 | 45394 | 4 |
| Mode SS | |||
|---|---|---|---|
| Quadrant | BADHDUFLAG | Total packets | Discarded packets |
| A | 0 | 358 | 0 |
| B | 0 | 358 | 0 |
| C | 0 | 358 | 0 |
| D | 0 | 358 | 0 |
| Mode M9 | |||
|---|---|---|---|
| Quadrant | BADHDUFLAG | Total packets | Discarded packets |
| A | 0 | 37 | 0 |
| B | 0 | 37 | 0 |
| C | 0 | 37 | 0 |
| D | 0 | 37 | 0 |
| Quadrant | Total seconds | Saturated seconds | Saturation percentage |
|---|---|---|---|
| A | 17520 | 138 | 0.787671% |
| B | 17520 | 265 | 1.512557% |
| C | 17520 | 166 | 0.947489% |
| D | 17520 | 779 | 4.446347% |
Noise dominated data is calculated using 1-second bins in cleaned event files. If a bin has >2000 counts, and if more than 50% of those come from <1% of pixels, then it is considered to be noise-dominated and hence unusable.
| Quadrant | # 1 sec bins | Bins with >0 counts | Bins with >2000 counts | High rate bins dominated by noise | Noise dominated (total time) | Noise dominated (detector-on time) | Marked lightcurve |
|---|---|---|---|---|---|---|---|
| A | 20525 | 17523 | 0 | 0 | 0.00% | 0.00% | 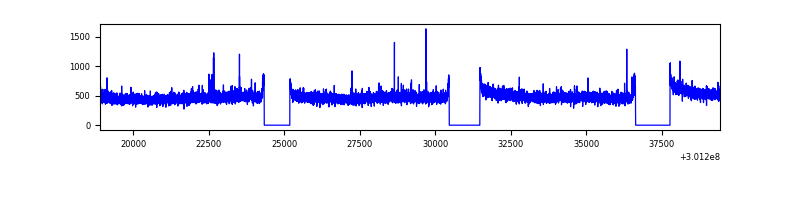 |
| B | 20525 | 17523 | 63 | 63 | 0.31% | 0.36% | 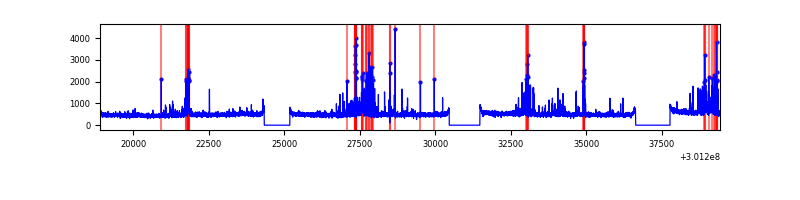 |
| C | 20525 | 17523 | 0 | 0 | 0.00% | 0.00% | 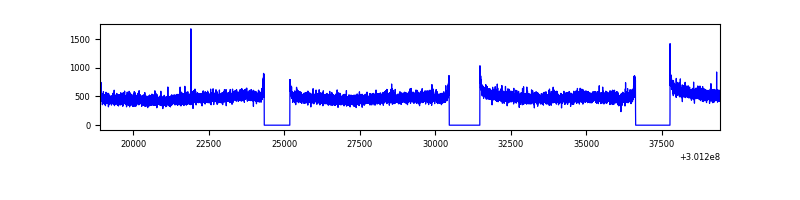 |
| D | 20525 | 17523 | 562 | 562 | 2.74% | 3.21% | 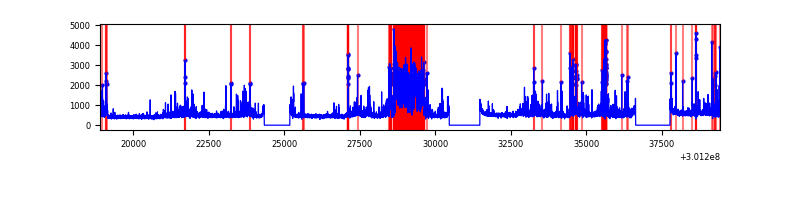 |
Top three noisy pixels from each quadrant. If the there are fewer than three noisy pixels in the level2.evt file, extra rows are filled as -1
| Pixel properties | Quadrant properties | ||||||
|---|---|---|---|---|---|---|---|
| Quadrant | DetID | PixID | Counts | Sigma | Mean | Median | Sigma |
| A | 6 | 240 | 22225 | 46.34 | 2173 | 2128 | 433.7 |
| A | 12 | 96 | 21012 | 43.55 | 2173 | 2128 | 433.7 |
| A | 0 | 226 | 18957 | 38.81 | 2173 | 2128 | 433.7 |
| B | 7 | 220 | 536952 | 1321.53 | 2152 | 2096 | 404.7 |
| B | 0 | 197 | 188421 | 460.37 | 2152 | 2096 | 404.7 |
| B | 0 | 190 | 80005 | 192.5 | 2152 | 2096 | 404.7 |
| C | 14 | 238 | 323910 | 666.31 | 2066 | 2073 | 483.0 |
| C | 13 | 61 | 14404 | 25.53 | 2066 | 2073 | 483.0 |
| C | 8 | 208 | 12468 | 21.52 | 2066 | 2073 | 483.0 |
| D | 5 | 222 | 2295049 | 4541.23 | 2081 | 2021 | 504.9 |
| D | 1 | 52 | 517775 | 1021.42 | 2081 | 2021 | 504.9 |
| D | 7 | 238 | 266345 | 523.48 | 2081 | 2021 | 504.9 |
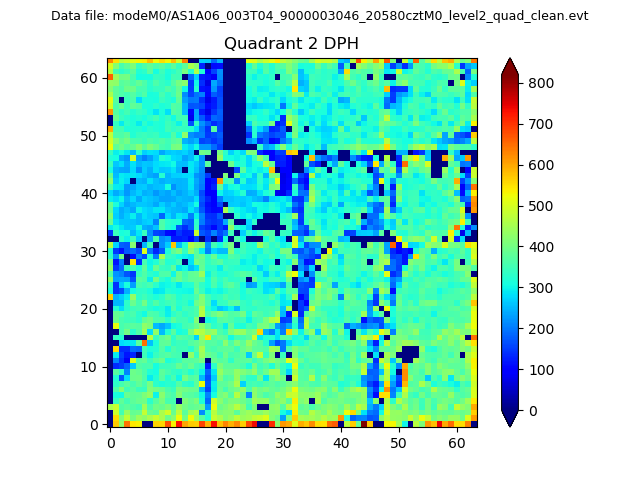
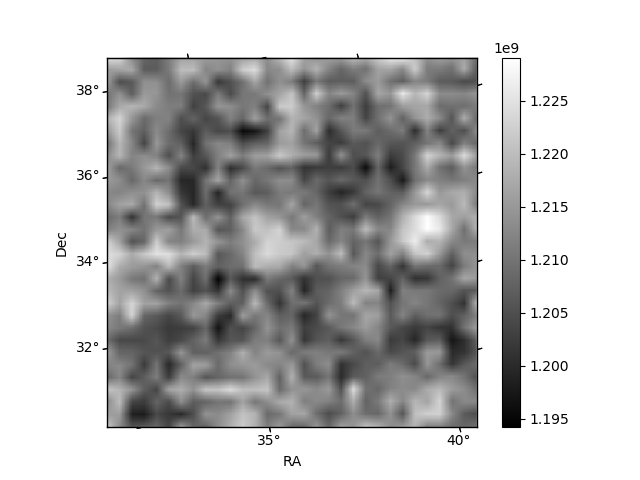
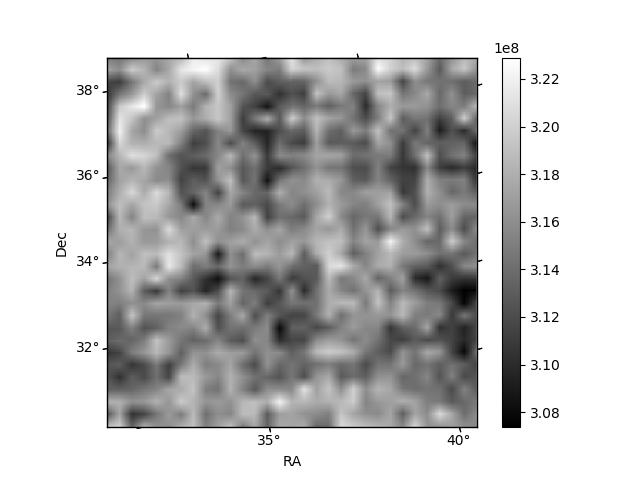
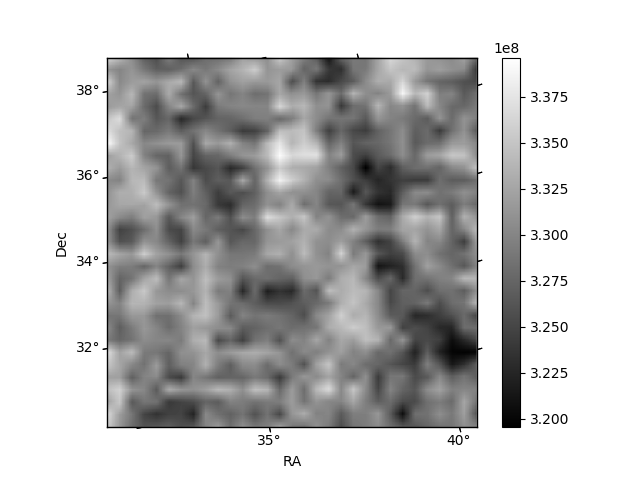
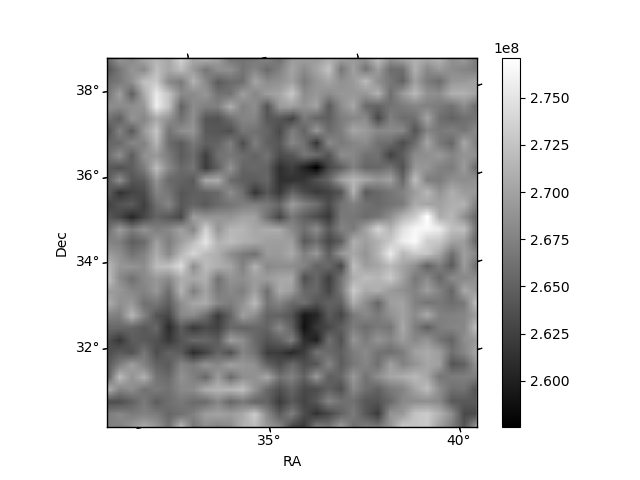
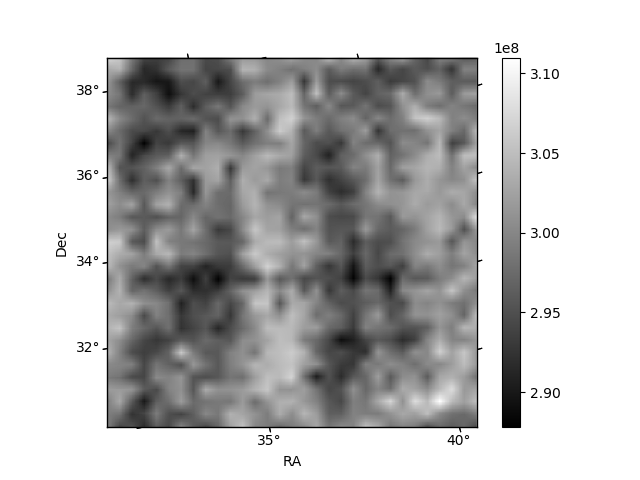
Histogram calculated using DETX and DETY for each event in the final _common_clean file
| Quadrant A | 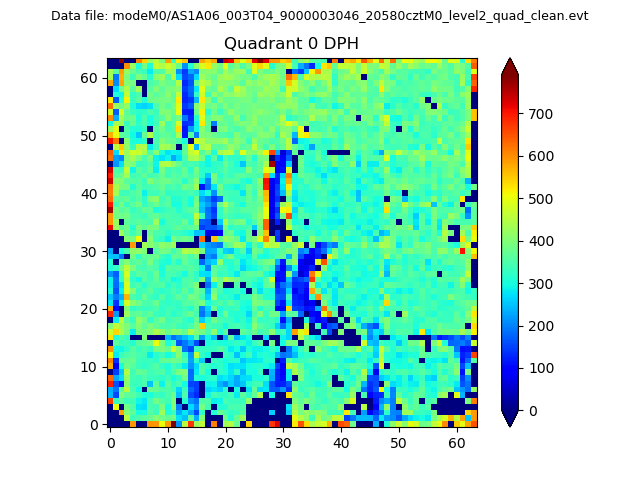 |
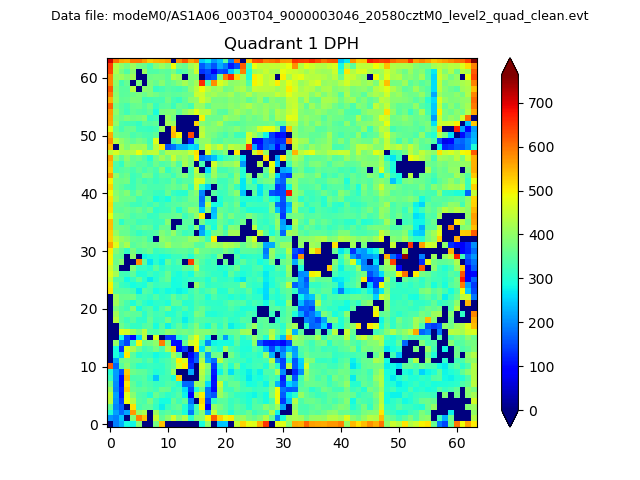 |
Quadrant B |
|---|---|---|---|
| Quadrant D | 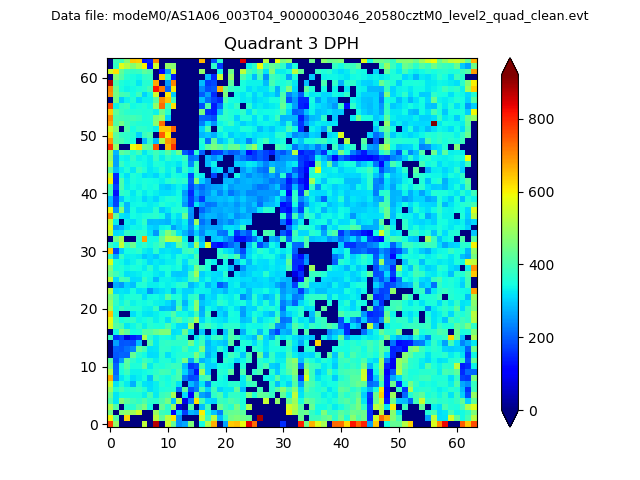 |
 |
Quadrant C |
| Plot type | Count rate plots | Images |
|---|---|---|
| Comparison with Poisson distribution Blue bars denote a histogram of data divided into 1 sec bins. Red curve is a Poisson curve with rate = median count rate of data. |
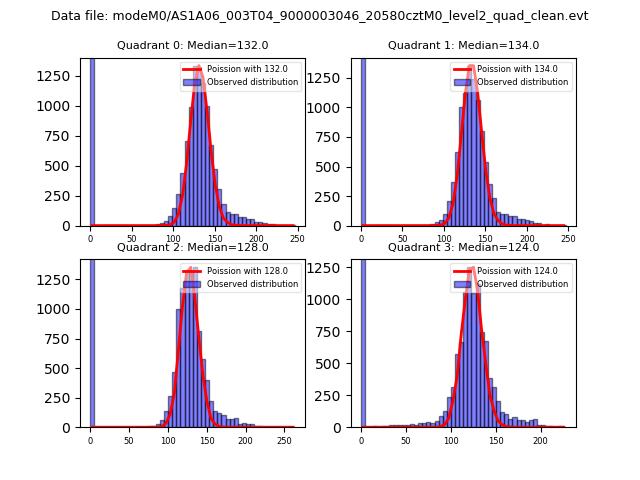 |
 |
| Quadrant-wise count rates Data is divided into 100 sec bins |
 |
|
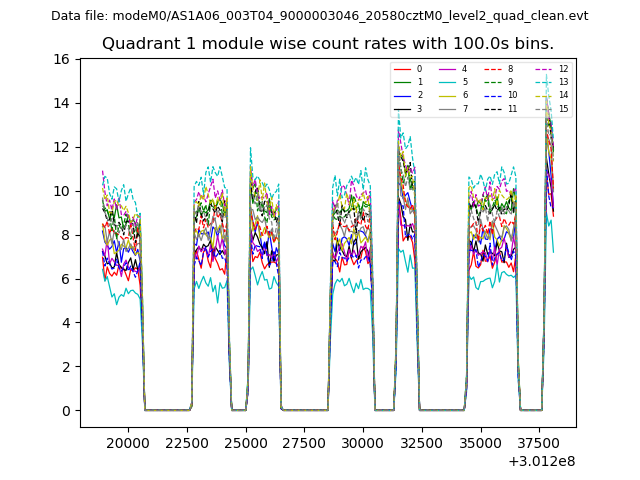
| Module-wise count rates for Quadrant A Data is divided into 100 sec bins |
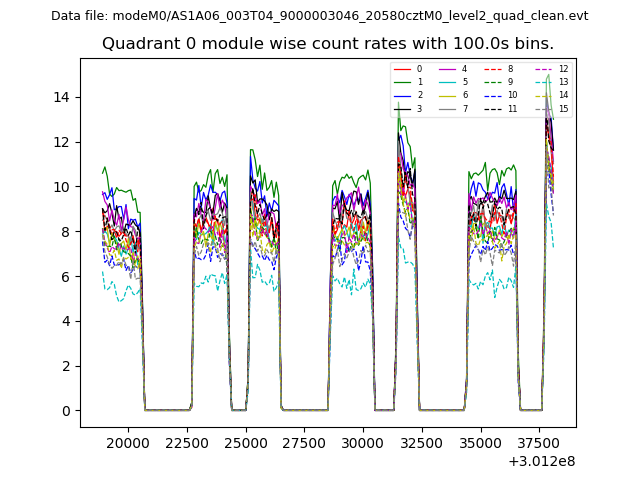 |
 |
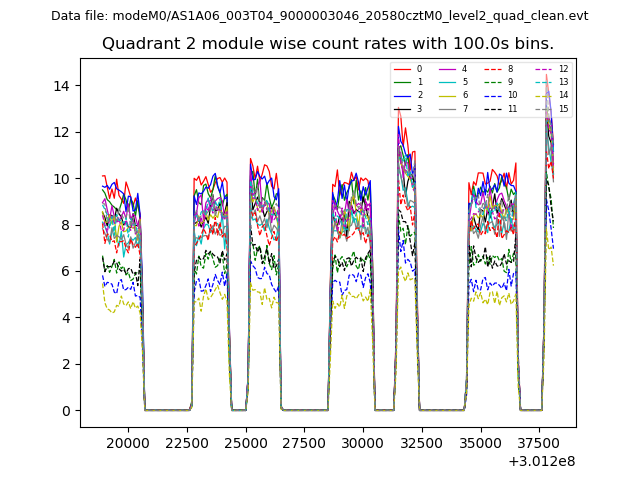
| Module-wise count rates for Quadrant B Data is divided into 100 sec bins |
 |
 |
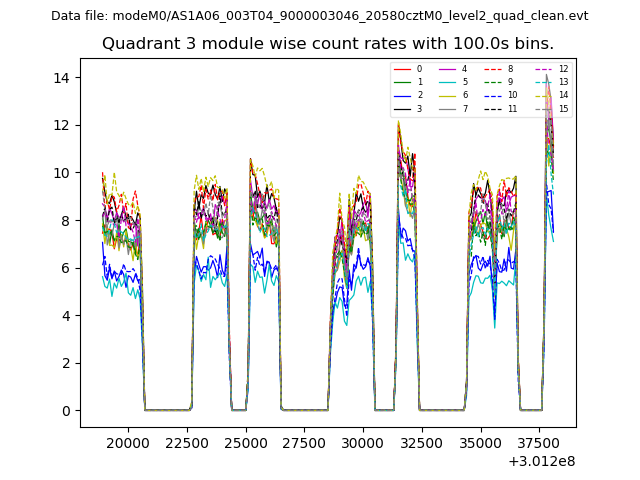
| Module-wise count rates for Quadrant C Data is divided into 100 sec bins |
 |
 |
| Module-wise count rates for Quadrant D Data is divided into 100 sec bins |
 |
 |
| Parameter | Plot |
|---|---|
| CZT HV Monitor | 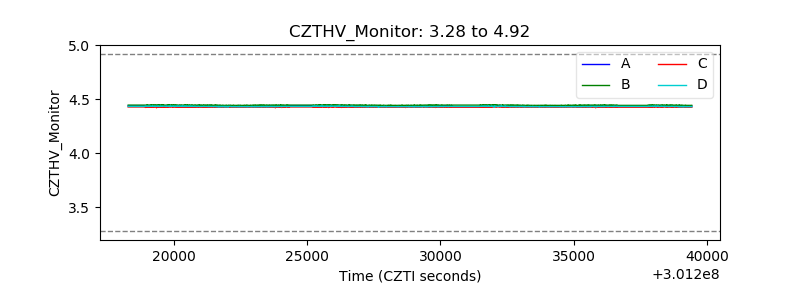 |
| D_VDD | 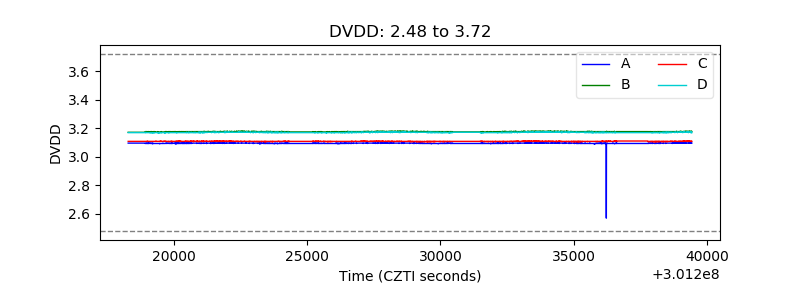 |
| Temperature 1 |  |
| Veto HV Monitor | 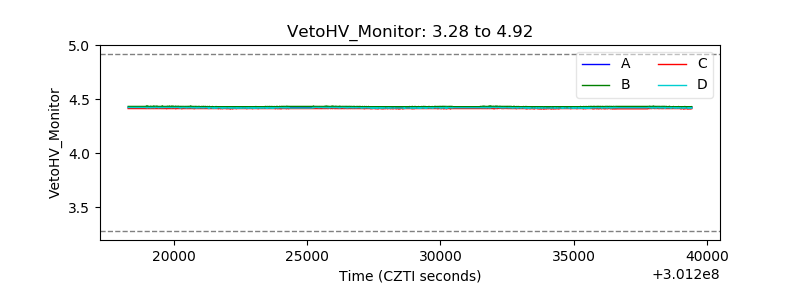 |
| Veto LLD | 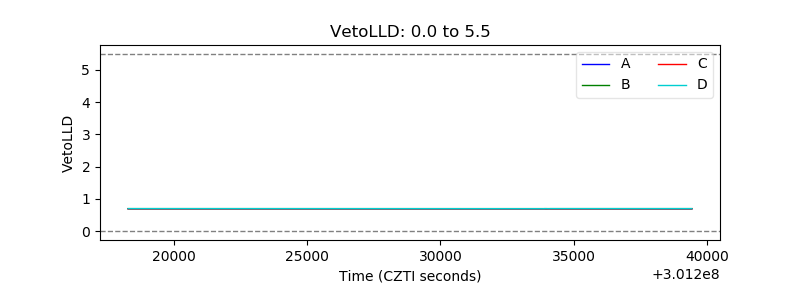 |
| Alpha Counter | 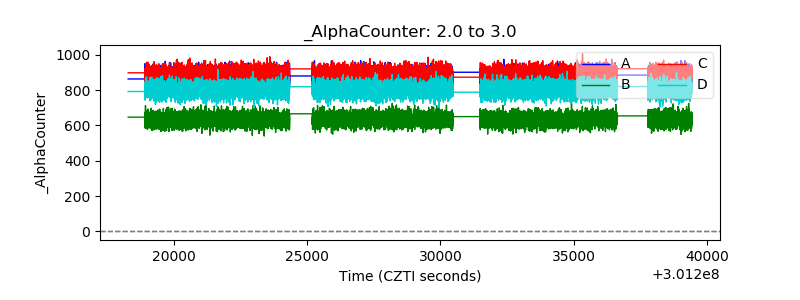 |
| _CPM_Rate | 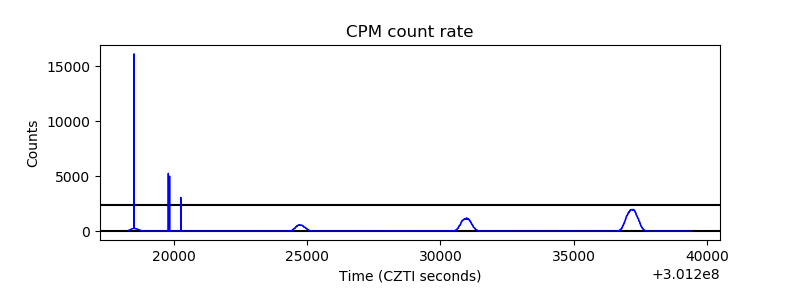 |
| CZT Counter | 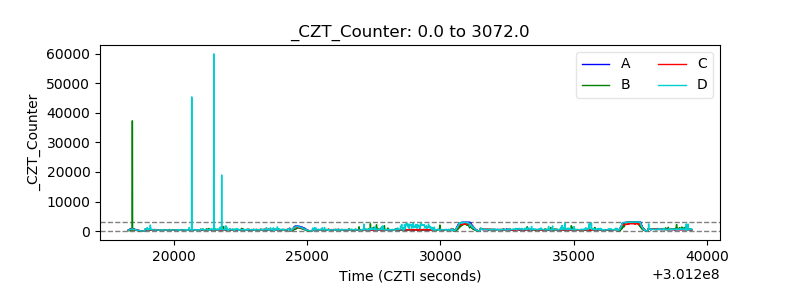 |
| +2.5 Volts monitor |  |
| +5 Volts monitor | 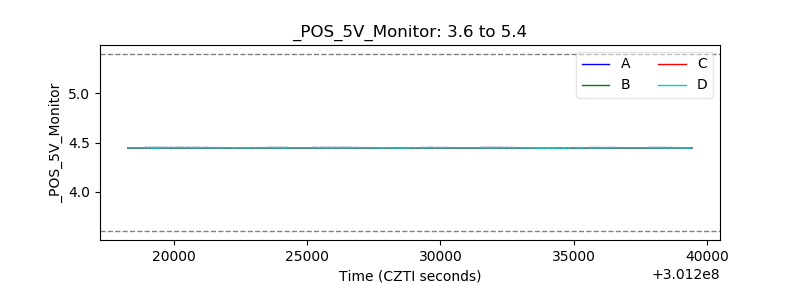 |
| _ROLL_ROT |  |
| _Roll_DEC |  |
| _Roll_RA | 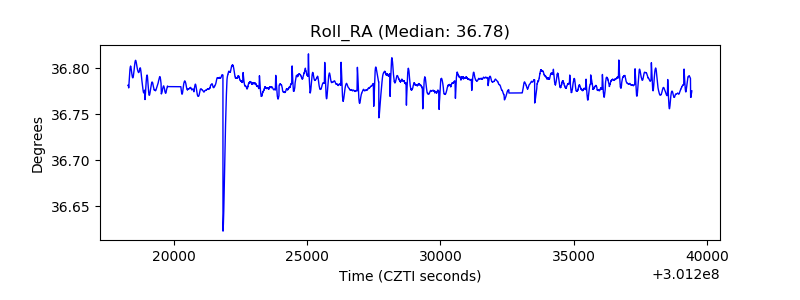 |
| Veto Counter | 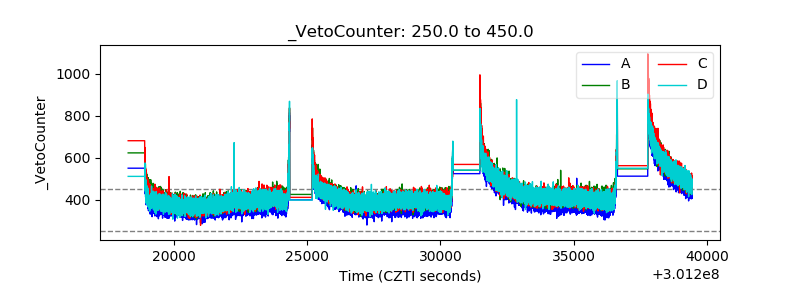 |