| Param | Original file | Final file |
|---|---|---|
| Filename | modeM0/AS1A06_003T04_9000003046_20581cztM0_level2.evt | modeM0/AS1A06_003T04_9000003046_20581cztM0_level2_quad_clean.evt |
| Size (bytes) | 526,383,360 | 63,544,320 |
| Size | 502.0 MB | 60.6 MB |
| Events in quadrant A | 3,345,050 | 379,564 |
| Events in quadrant B | 3,866,885 | 384,127 |
| Events in quadrant C | 3,371,955 | 366,651 |
| Events in quadrant D | 4,930,313 | 353,274 |
| Mode M0 | |||
|---|---|---|---|
| Quadrant | BADHDUFLAG | Total packets | Discarded packets |
| A | 0 | 13855 | 1 |
| B | 0 | 15659 | 1 |
| C | 0 | 13883 | 1 |
| D | 0 | 19110 | 3 |
| Mode SS | |||
|---|---|---|---|
| Quadrant | BADHDUFLAG | Total packets | Discarded packets |
| A | 0 | 130 | 0 |
| B | 0 | 130 | 0 |
| C | 0 | 130 | 0 |
| D | 0 | 130 | 0 |
| Mode M9 | |||
|---|---|---|---|
| Quadrant | BADHDUFLAG | Total packets | Discarded packets |
| A | 0 | 12 | 0 |
| B | 0 | 12 | 0 |
| C | 0 | 12 | 0 |
| D | 0 | 12 | 0 |
| Quadrant | Total seconds | Saturated seconds | Saturation percentage |
|---|---|---|---|
| A | 6299 | 73 | 1.158914% |
| B | 6300 | 128 | 2.031746% |
| C | 6300 | 98 | 1.555556% |
| D | 6299 | 260 | 4.127639% |
Noise dominated data is calculated using 1-second bins in cleaned event files. If a bin has >2000 counts, and if more than 50% of those come from <1% of pixels, then it is considered to be noise-dominated and hence unusable.
| Quadrant | # 1 sec bins | Bins with >0 counts | Bins with >2000 counts | High rate bins dominated by noise | Noise dominated (total time) | Noise dominated (detector-on time) | Marked lightcurve |
|---|---|---|---|---|---|---|---|
| A | 7539 | 6300 | 1 | 1 | 0.01% | 0.02% | 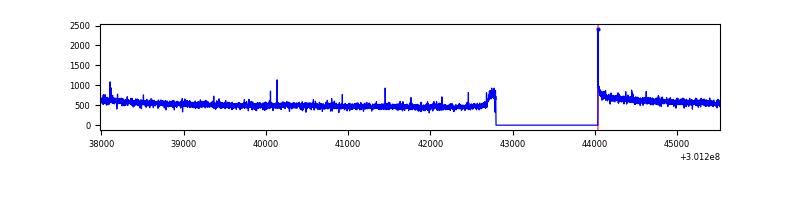 |
| B | 7540 | 6301 | 28 | 28 | 0.37% | 0.44% | 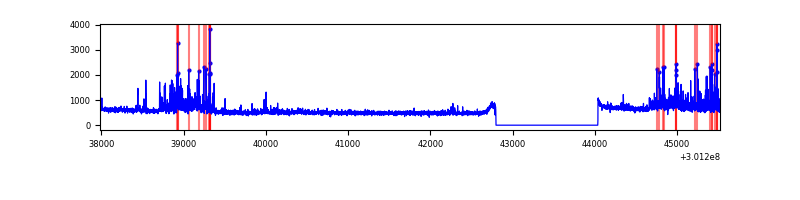 |
| C | 7540 | 6301 | 0 | 0 | 0.00% | 0.00% | 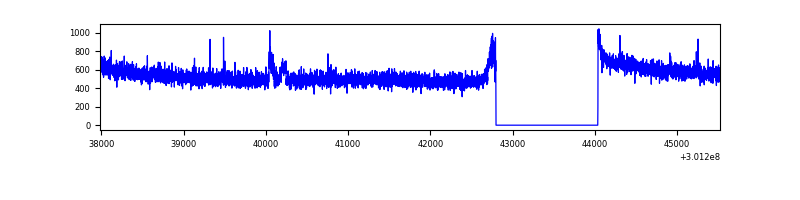 |
| D | 7539 | 6300 | 165 | 165 | 2.19% | 2.62% | 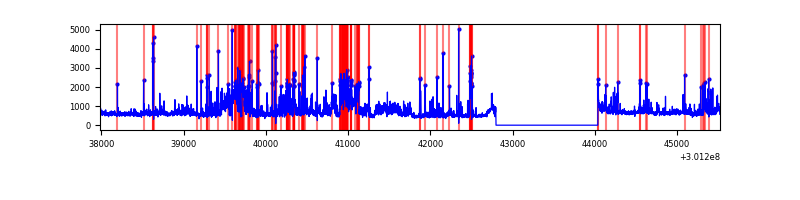 |
Top three noisy pixels from each quadrant. If the there are fewer than three noisy pixels in the level2.evt file, extra rows are filled as -1
| Pixel properties | Quadrant properties | ||||||
|---|---|---|---|---|---|---|---|
| Quadrant | DetID | PixID | Counts | Sigma | Mean | Median | Sigma |
| A | 0 | 226 | 7695 | 39.63 | 865 | 848 | 172.8 |
| A | 12 | 194 | 6347 | 31.83 | 865 | 848 | 172.8 |
| A | 3 | 137 | 6273 | 31.4 | 865 | 848 | 172.8 |
| B | 7 | 220 | 348969 | 2192.48 | 853 | 835 | 158.8 |
| B | 0 | 189 | 53510 | 331.74 | 853 | 835 | 158.8 |
| B | 4 | 171 | 32242 | 197.8 | 853 | 835 | 158.8 |
| C | 14 | 238 | 131314 | 688.46 | 822 | 829 | 189.5 |
| C | 8 | 208 | 31657 | 162.65 | 822 | 829 | 189.5 |
| C | 13 | 61 | 5865 | 26.57 | 822 | 829 | 189.5 |
| D | 1 | 52 | 540625 | 2717.78 | 832 | 809 | 198.6 |
| D | 5 | 222 | 400525 | 2012.43 | 832 | 809 | 198.6 |
| D | 1 | 20 | 220880 | 1107.98 | 832 | 809 | 198.6 |
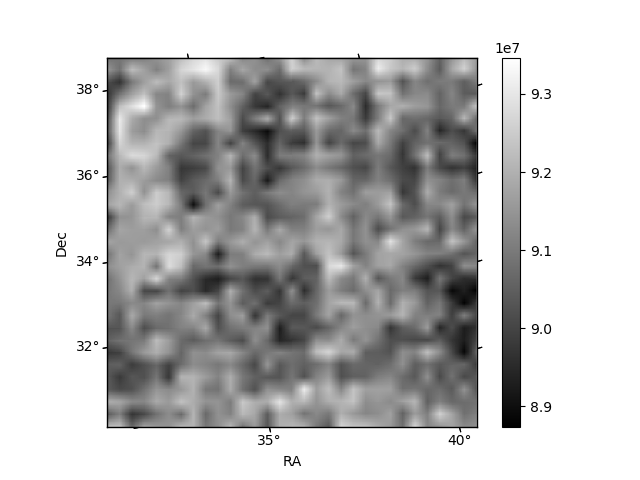
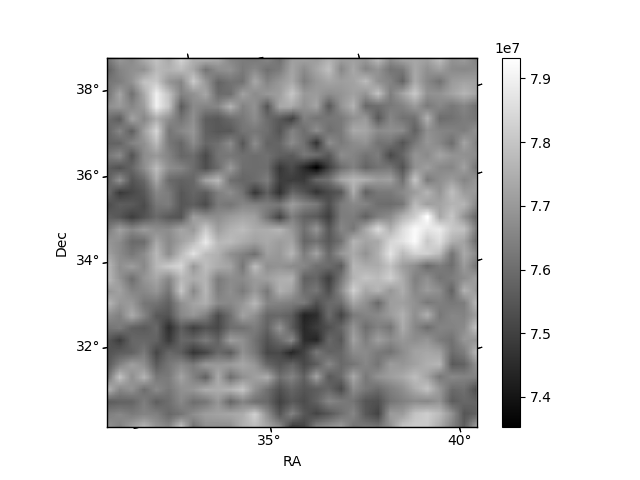
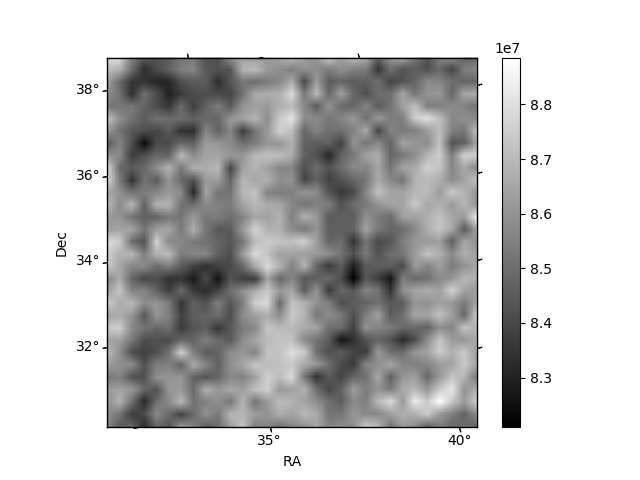
Histogram calculated using DETX and DETY for each event in the final _common_clean file
| Quadrant A | 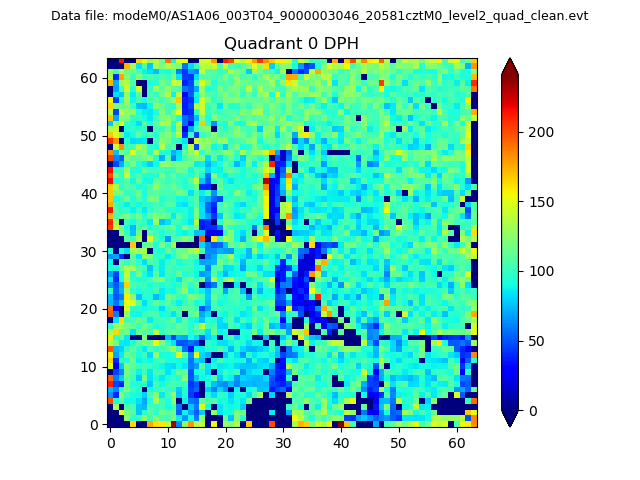 |
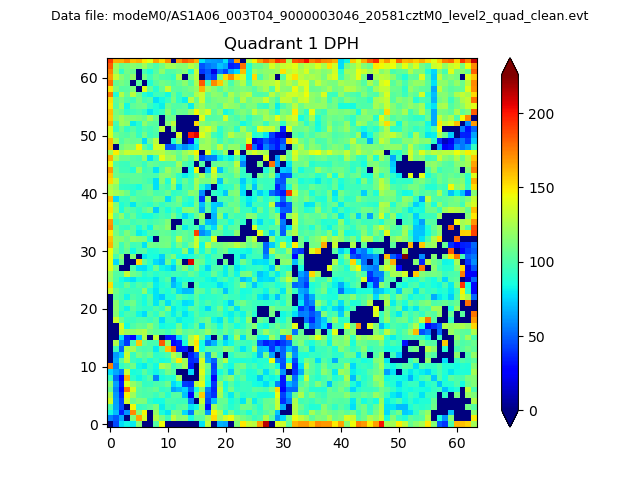 |
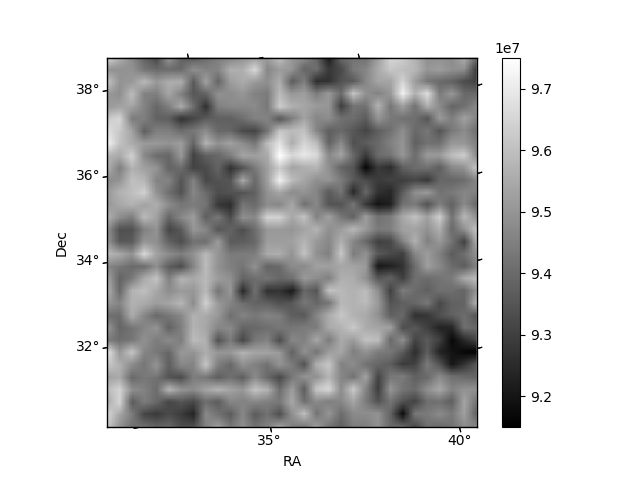
Quadrant B |
|---|---|---|---|
| Quadrant D | 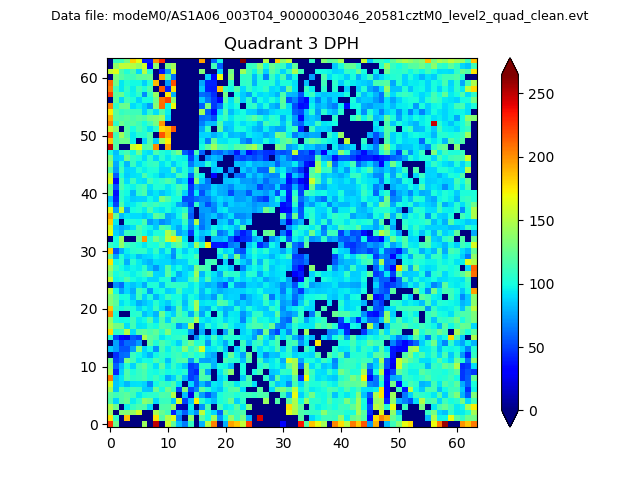 |
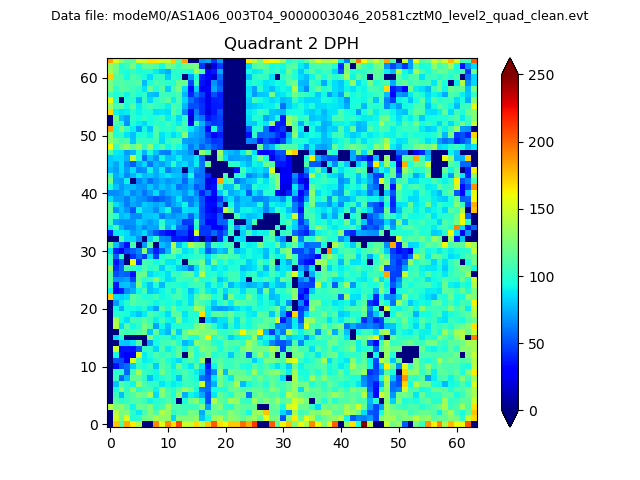 |
Quadrant C |
| Plot type | Count rate plots | Images |
|---|---|---|
| Comparison with Poisson distribution Blue bars denote a histogram of data divided into 1 sec bins. Red curve is a Poisson curve with rate = median count rate of data. |
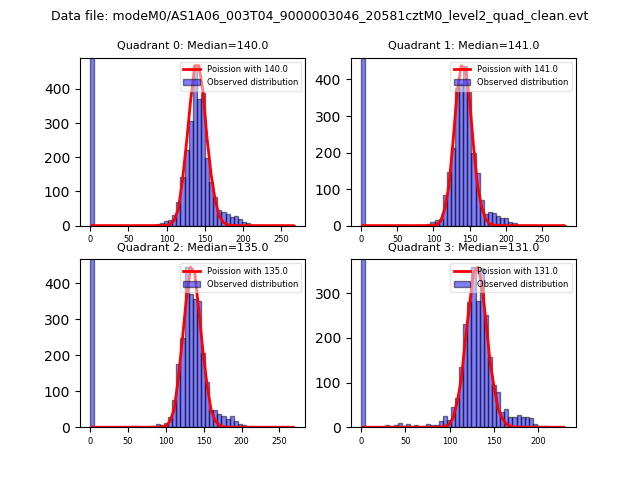 |
 |
| Quadrant-wise count rates Data is divided into 100 sec bins |
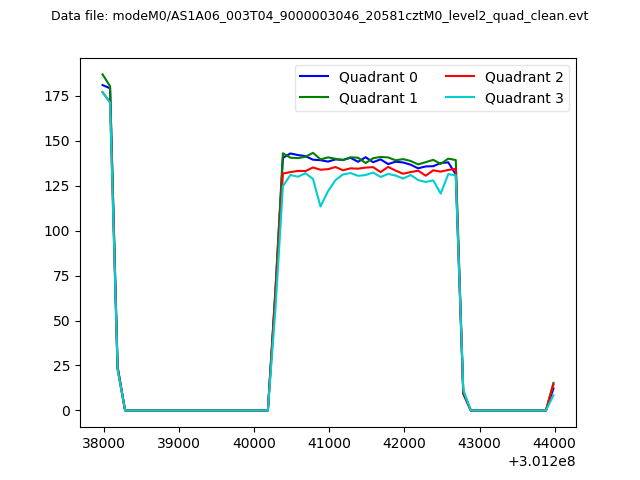 |
|
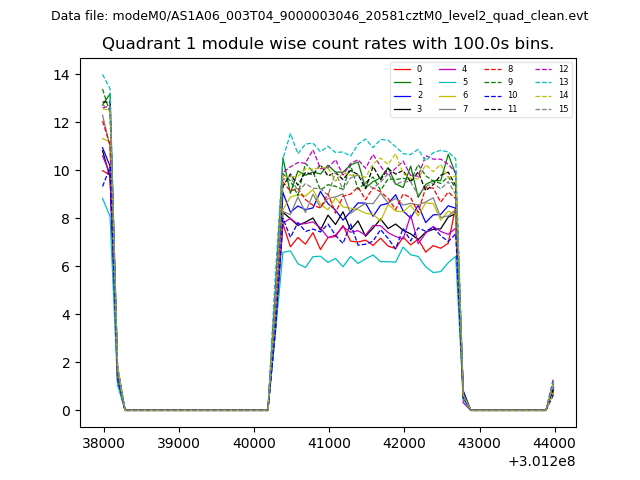
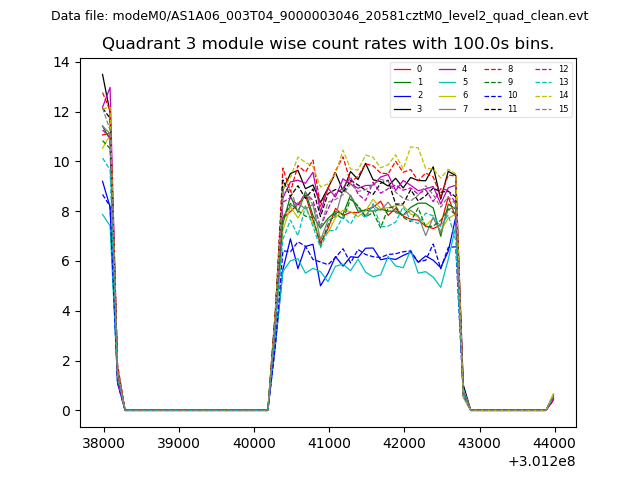
| Module-wise count rates for Quadrant A Data is divided into 100 sec bins |
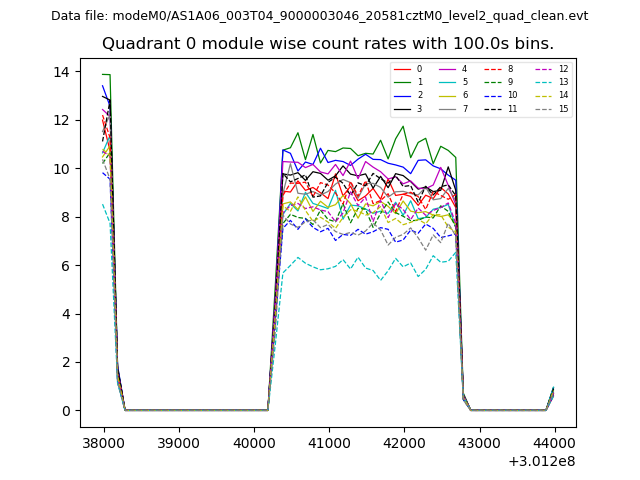 |
 |
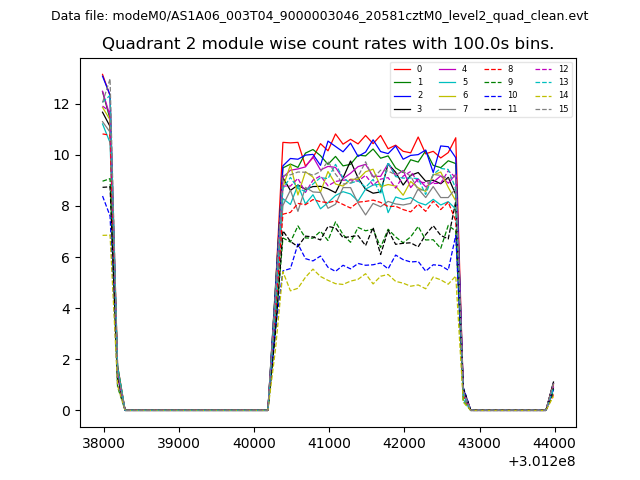
| Module-wise count rates for Quadrant B Data is divided into 100 sec bins |
 |
 |
| Module-wise count rates for Quadrant C Data is divided into 100 sec bins |
 |
 |
| Module-wise count rates for Quadrant D Data is divided into 100 sec bins |
 |
 |
| Parameter | Plot |
|---|---|
| CZT HV Monitor | 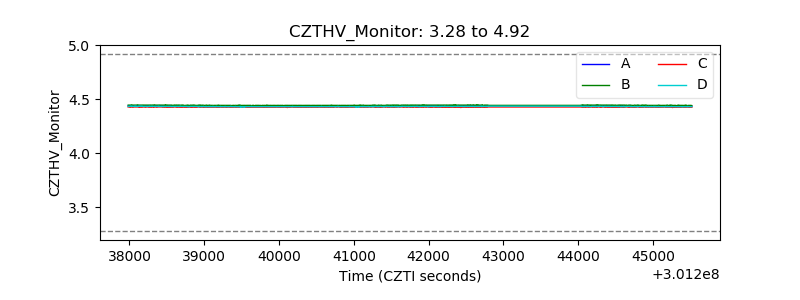 |
| D_VDD | 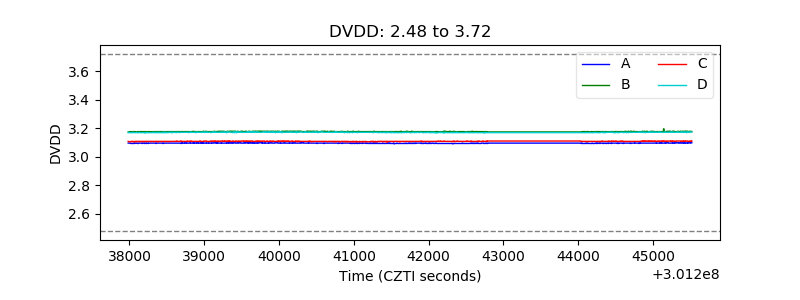 |
| Temperature 1 | 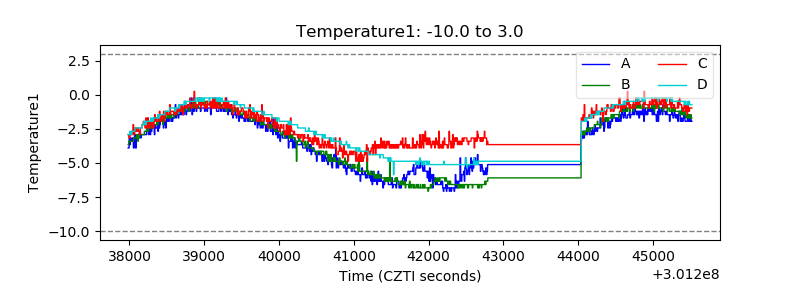 |
| Veto HV Monitor | 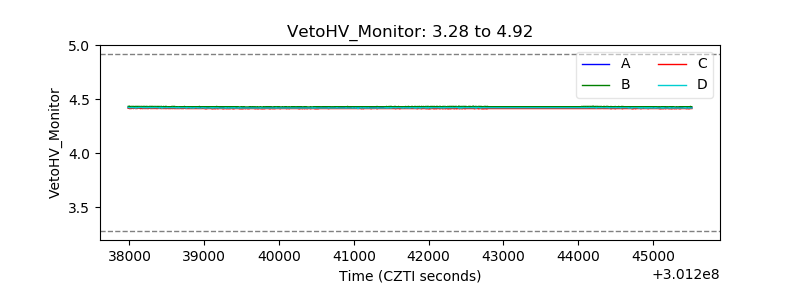 |
| Veto LLD | 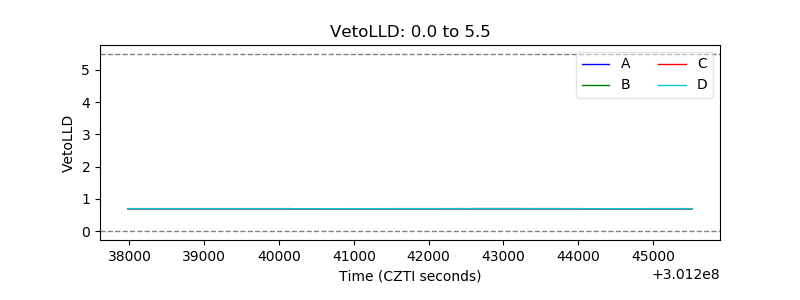 |
| Alpha Counter | 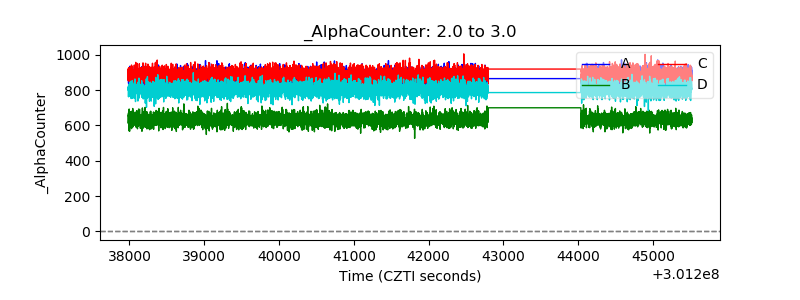 |
| _CPM_Rate | 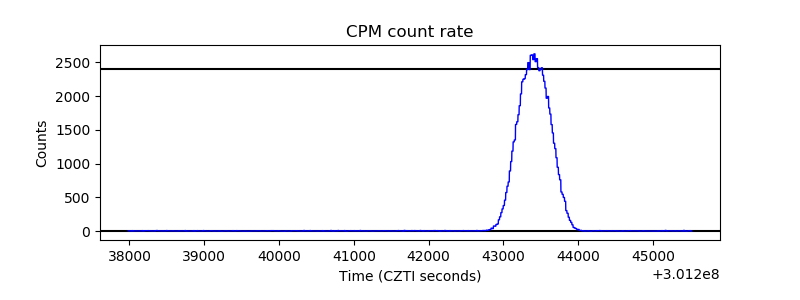 |
| CZT Counter | 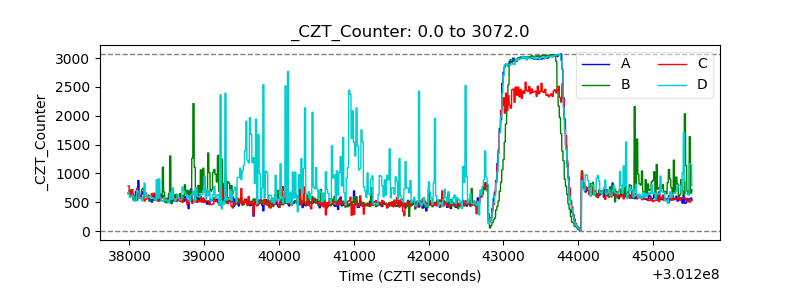 |
| +2.5 Volts monitor | 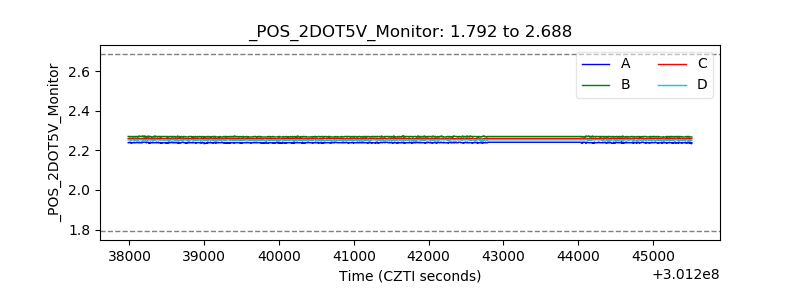 |
| +5 Volts monitor |  |
| _ROLL_ROT | 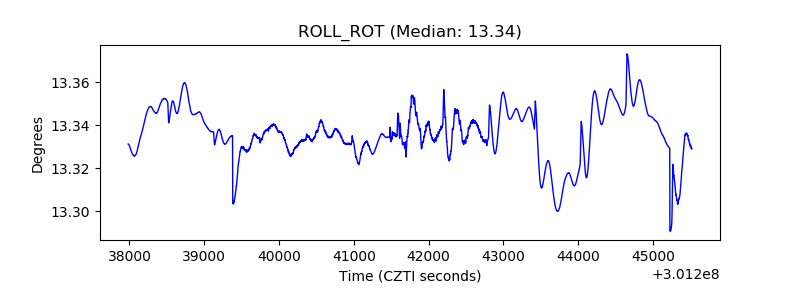 |
| _Roll_DEC |  |
| _Roll_RA | 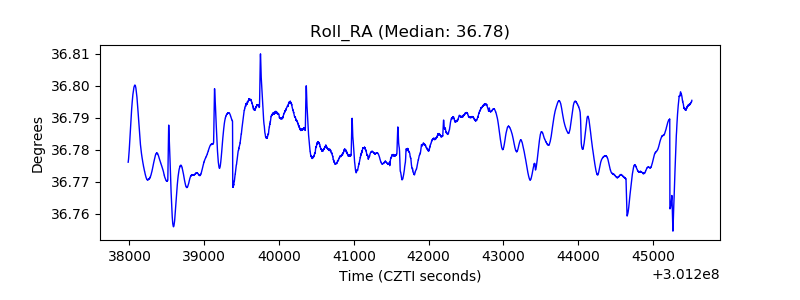 |
| Veto Counter | 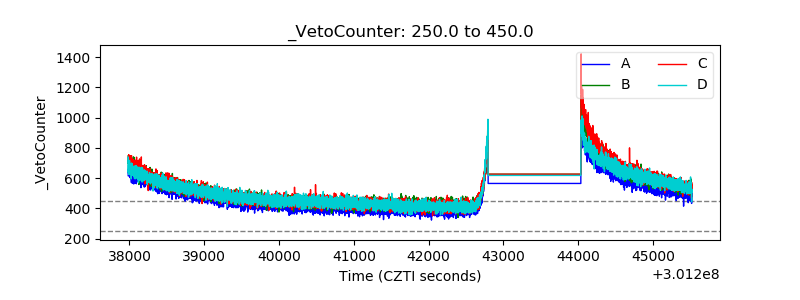 |