| Param | Original file | Final file |
|---|---|---|
| Filename | modeM0/AS1A06_003T04_9000003046_20583cztM0_level2.evt | modeM0/AS1A06_003T04_9000003046_20583cztM0_level2_quad_clean.evt |
| Size (bytes) | 528,874,560 | 74,905,920 |
| Size | 504.4 MB | 71.4 MB |
| Events in quadrant A | 3,415,475 | 465,960 |
| Events in quadrant B | 3,711,690 | 470,802 |
| Events in quadrant C | 3,482,763 | 454,646 |
| Events in quadrant D | 4,985,159 | 442,052 |
| Mode M0 | |||
|---|---|---|---|
| Quadrant | BADHDUFLAG | Total packets | Discarded packets |
| A | 0 | 14264 | 2 |
| B | 0 | 15142 | 2 |
| C | 0 | 14427 | 2 |
| D | 0 | 19242 | 3 |
| Mode SS | |||
|---|---|---|---|
| Quadrant | BADHDUFLAG | Total packets | Discarded packets |
| A | 0 | 126 | 0 |
| B | 0 | 126 | 0 |
| C | 0 | 126 | 0 |
| D | 0 | 126 | 0 |
| Mode M9 | |||
|---|---|---|---|
| Quadrant | BADHDUFLAG | Total packets | Discarded packets |
| A | 0 | 19 | 0 |
| B | 0 | 20 | 0 |
| C | 0 | 20 | 0 |
| D | 0 | 20 | 0 |
| Quadrant | Total seconds | Saturated seconds | Saturation percentage |
|---|---|---|---|
| A | 6229 | 62 | 0.995344% |
| B | 6229 | 129 | 2.070958% |
| C | 6229 | 113 | 1.814095% |
| D | 6228 | 469 | 7.530507% |
Noise dominated data is calculated using 1-second bins in cleaned event files. If a bin has >2000 counts, and if more than 50% of those come from <1% of pixels, then it is considered to be noise-dominated and hence unusable.
| Quadrant | # 1 sec bins | Bins with >0 counts | Bins with >2000 counts | High rate bins dominated by noise | Noise dominated (total time) | Noise dominated (detector-on time) | Marked lightcurve |
|---|---|---|---|---|---|---|---|
| A | 7609 | 6230 | 1 | 1 | 0.01% | 0.02% | 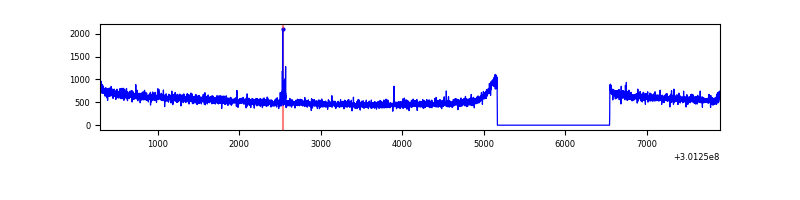 |
| B | 7609 | 6230 | 25 | 25 | 0.33% | 0.40% | 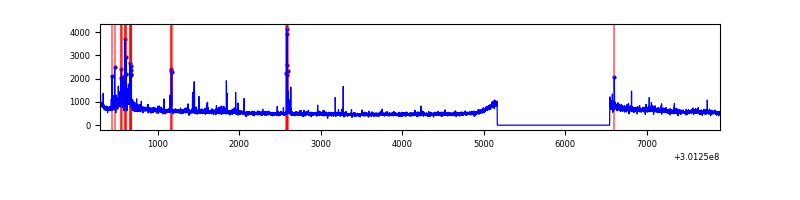 |
| C | 7609 | 6230 | 0 | 0 | 0.00% | 0.00% | 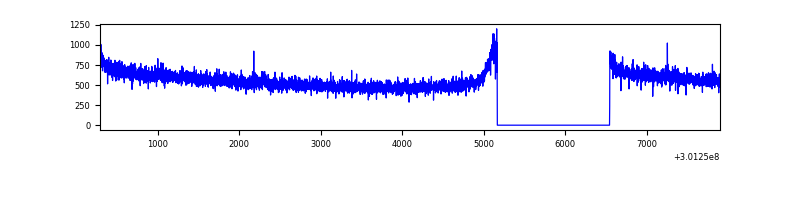 |
| D | 7608 | 6229 | 298 | 298 | 3.92% | 4.78% | 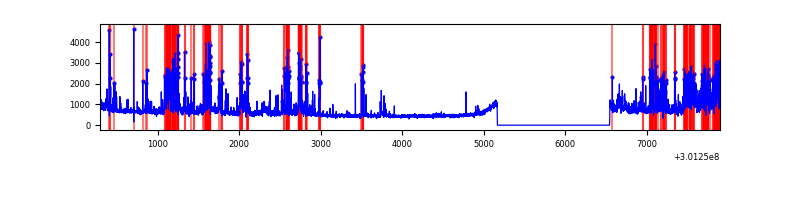 |
Top three noisy pixels from each quadrant. If the there are fewer than three noisy pixels in the level2.evt file, extra rows are filled as -1
| Pixel properties | Quadrant properties | ||||||
|---|---|---|---|---|---|---|---|
| Quadrant | DetID | PixID | Counts | Sigma | Mean | Median | Sigma |
| A | 12 | 96 | 15442 | 83.5 | 881 | 867 | 174.5 |
| A | 0 | 226 | 7828 | 39.88 | 881 | 867 | 174.5 |
| A | 12 | 194 | 6518 | 32.38 | 881 | 867 | 174.5 |
| B | 7 | 220 | 113112 | 695.93 | 875 | 857 | 161.3 |
| B | 0 | 197 | 52224 | 318.45 | 875 | 857 | 161.3 |
| B | 0 | 189 | 42951 | 260.96 | 875 | 857 | 161.3 |
| C | 14 | 238 | 135577 | 688.97 | 853 | 864 | 195.5 |
| C | 8 | 208 | 14362 | 69.03 | 853 | 864 | 195.5 |
| C | 3 | 233 | 6669 | 29.69 | 853 | 864 | 195.5 |
| D | 5 | 222 | 865983 | 4242.45 | 847 | 826 | 203.9 |
| D | 13 | 104 | 414274 | 2027.42 | 847 | 826 | 203.9 |
| D | 13 | 153 | 160650 | 783.73 | 847 | 826 | 203.9 |
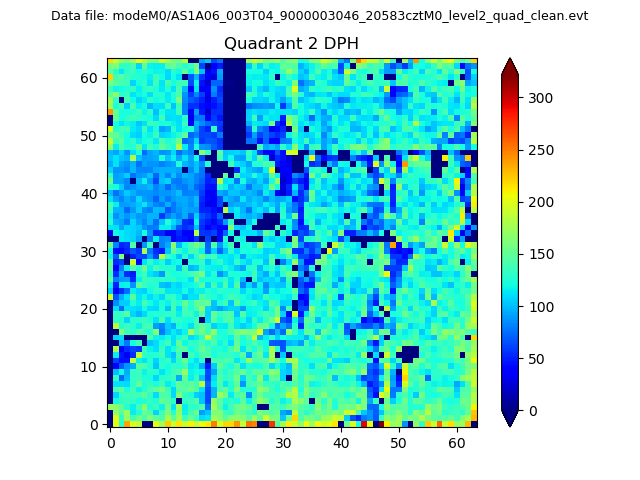
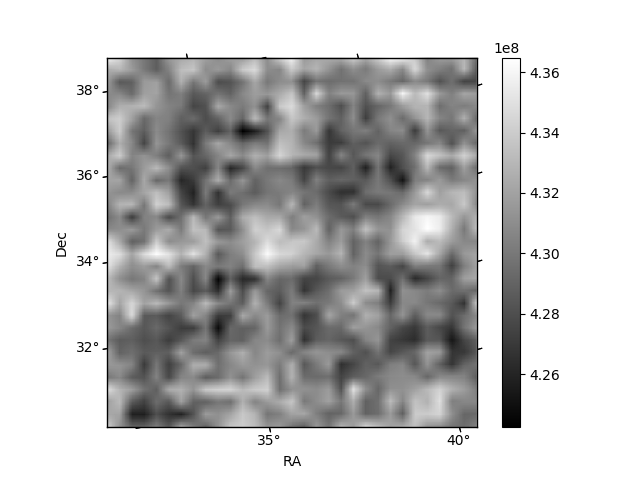
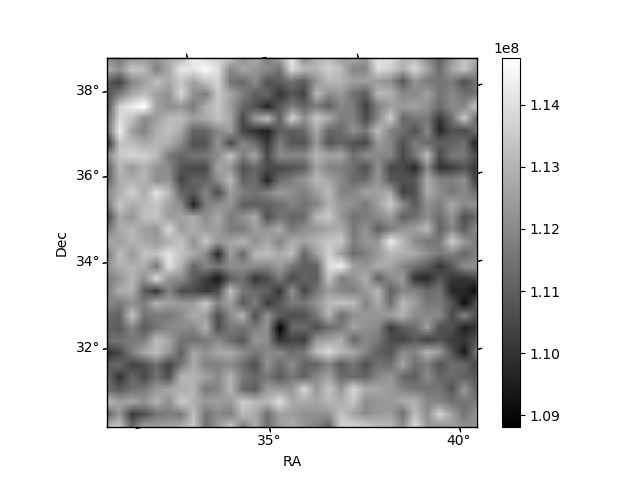
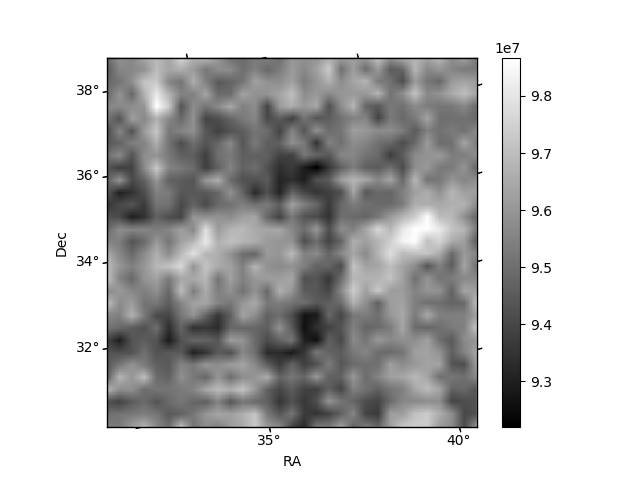
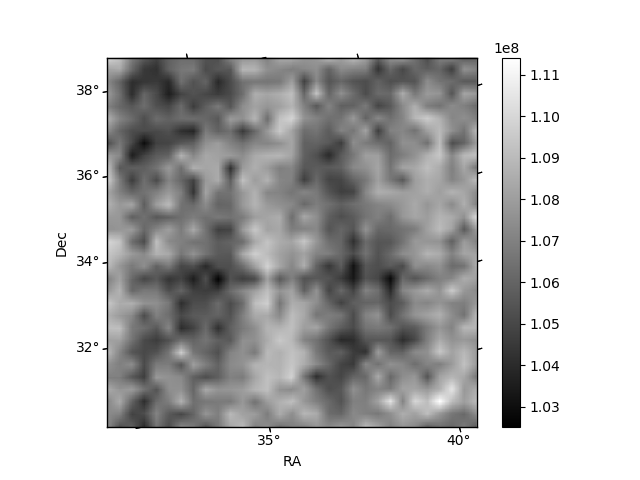
Histogram calculated using DETX and DETY for each event in the final _common_clean file
| Quadrant A | 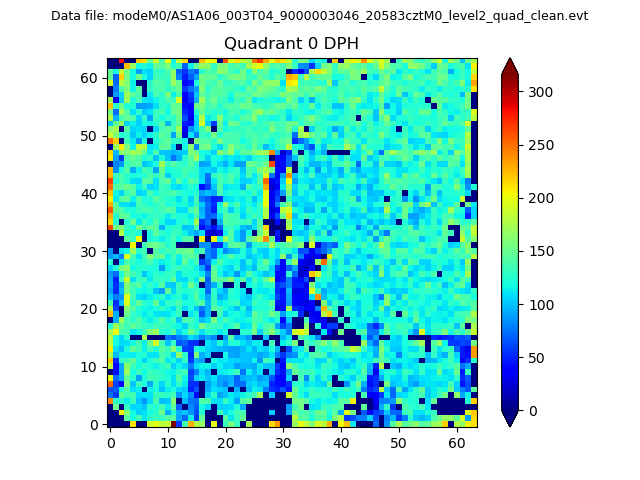 |
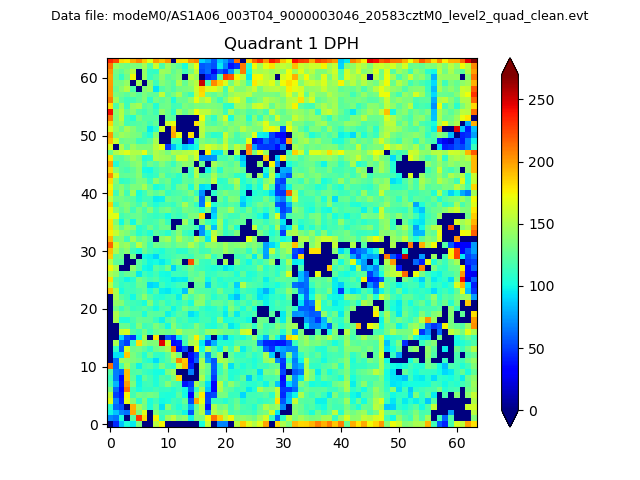 |
Quadrant B |
|---|---|---|---|
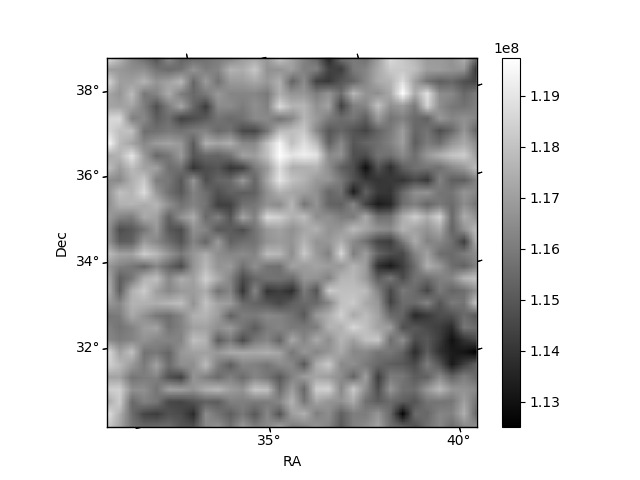
| Quadrant D | 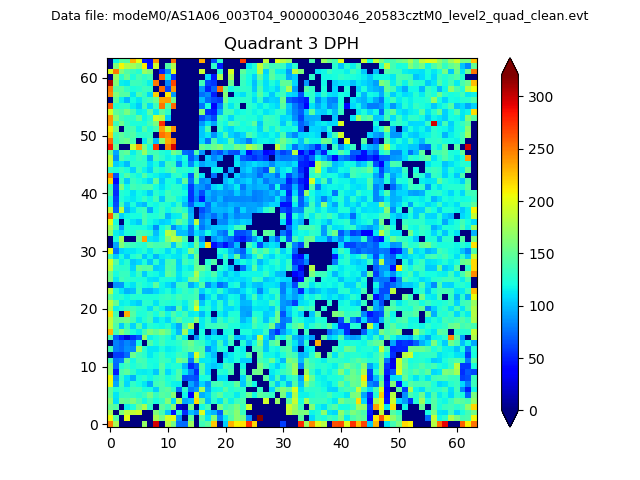 |
 |
Quadrant C |
| Plot type | Count rate plots | Images |
|---|---|---|
| Comparison with Poisson distribution Blue bars denote a histogram of data divided into 1 sec bins. Red curve is a Poisson curve with rate = median count rate of data. |
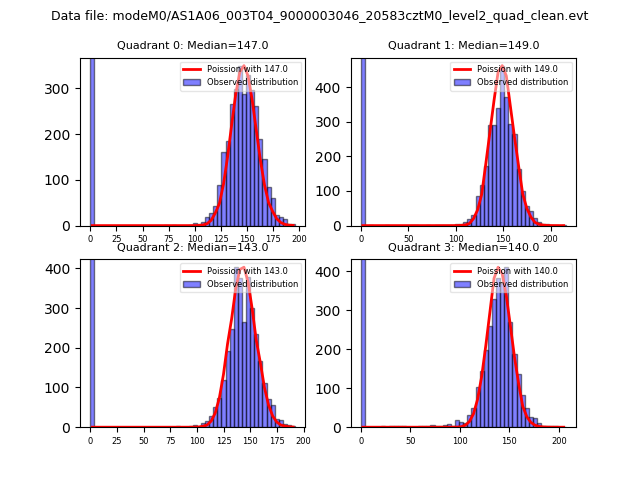 |
 |
| Quadrant-wise count rates Data is divided into 100 sec bins |
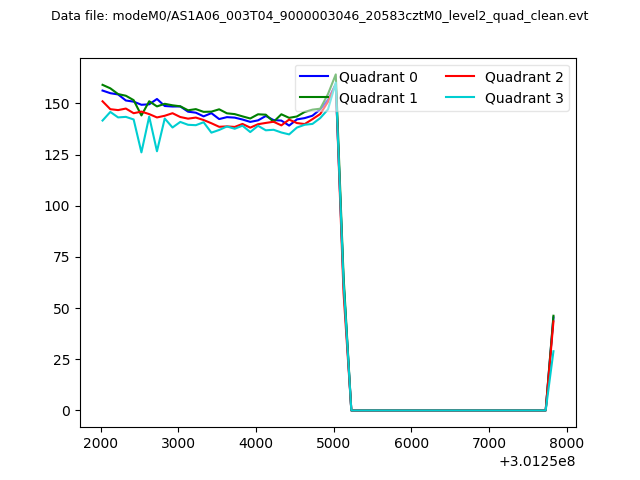 |
|
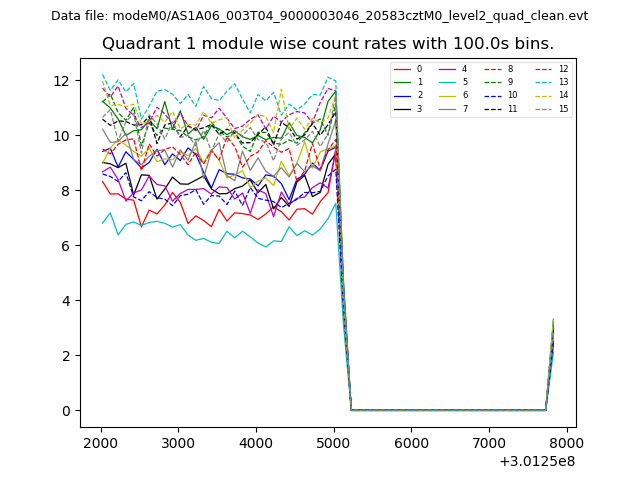
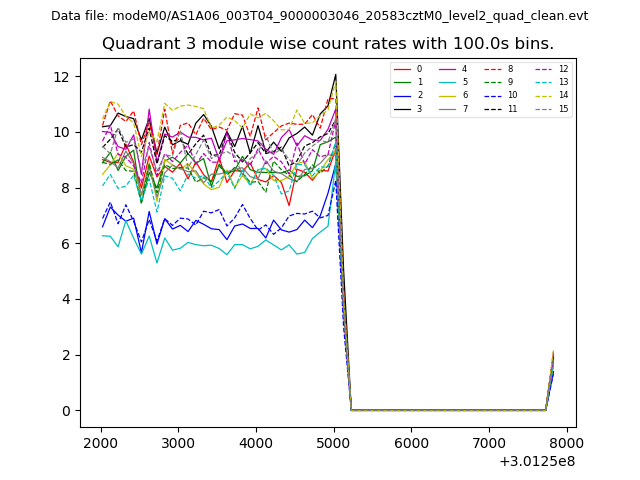
| Module-wise count rates for Quadrant A Data is divided into 100 sec bins |
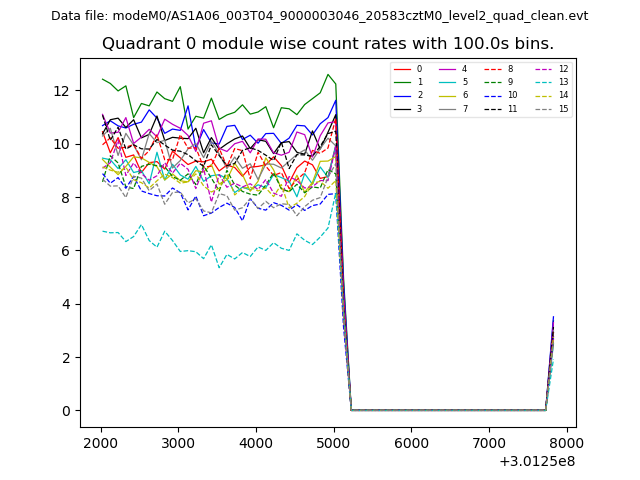 |
 |
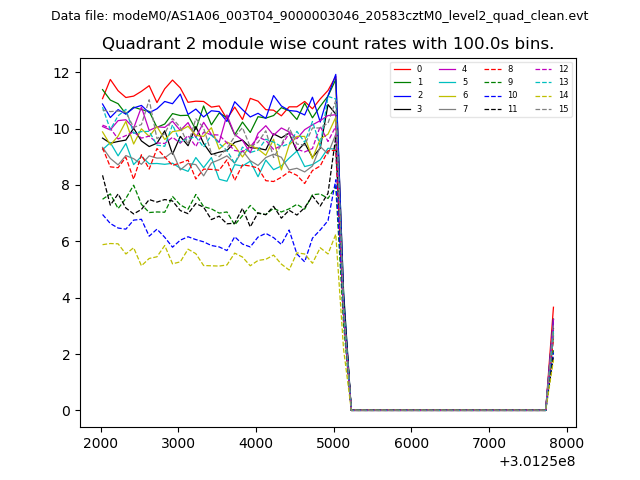
| Module-wise count rates for Quadrant B Data is divided into 100 sec bins |
 |
 |
| Module-wise count rates for Quadrant C Data is divided into 100 sec bins |
 |
 |
| Module-wise count rates for Quadrant D Data is divided into 100 sec bins |
 |
 |
| Parameter | Plot |
|---|---|
| CZT HV Monitor | 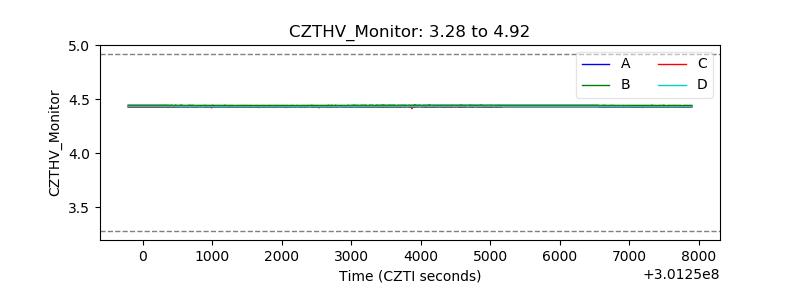 |
| D_VDD | 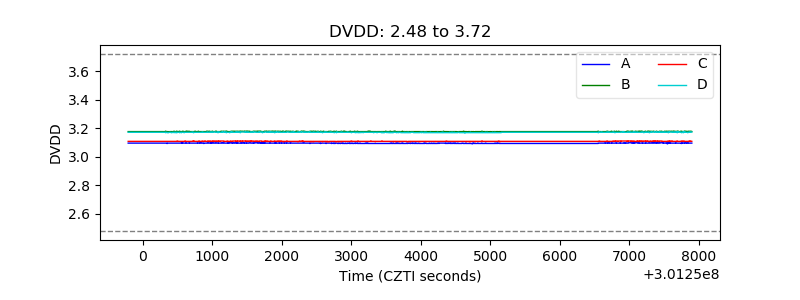 |
| Temperature 1 | 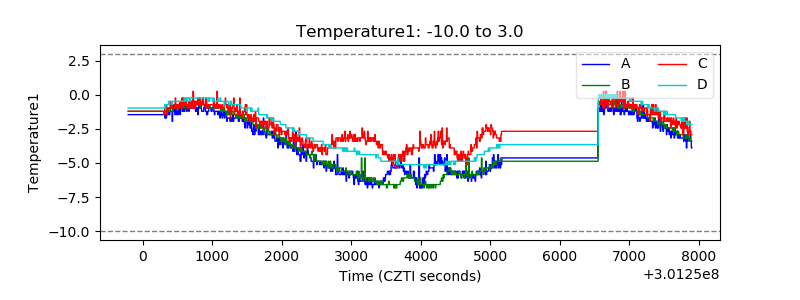 |
| Veto HV Monitor | 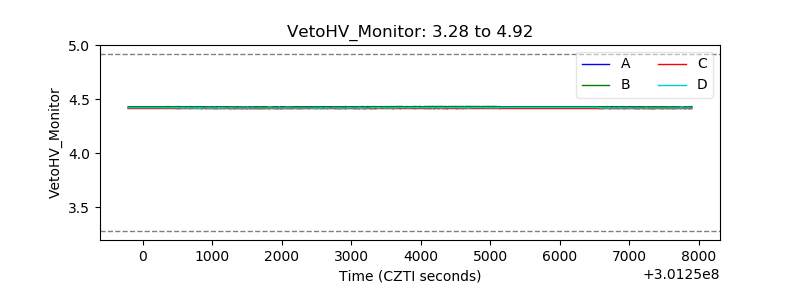 |
| Veto LLD | 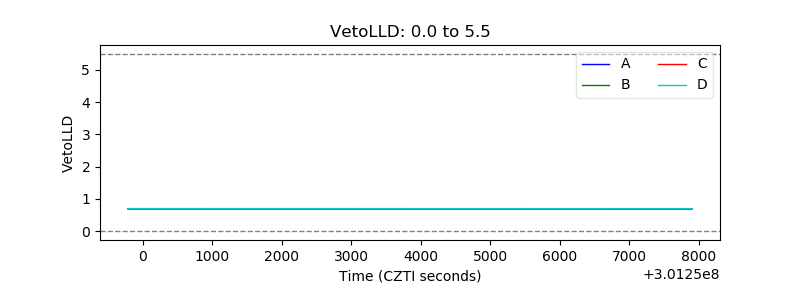 |
| Alpha Counter | 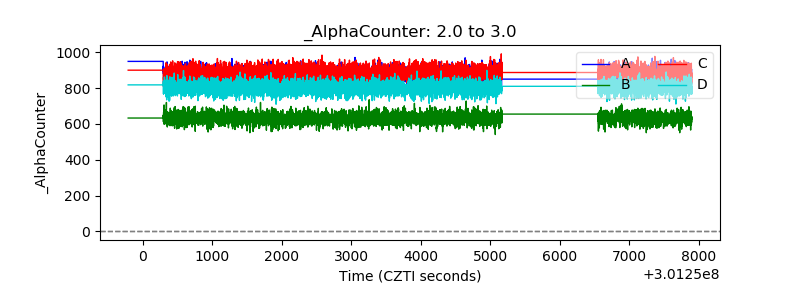 |
| _CPM_Rate | 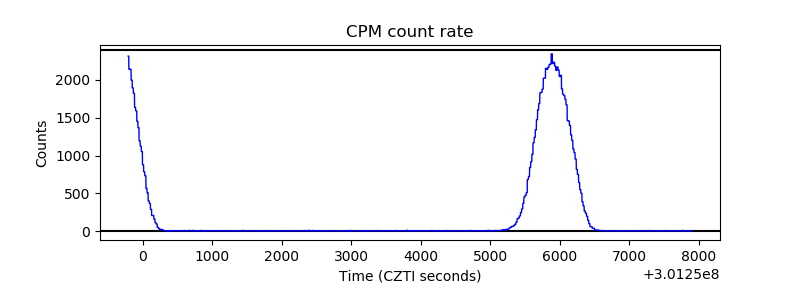 |
| CZT Counter | 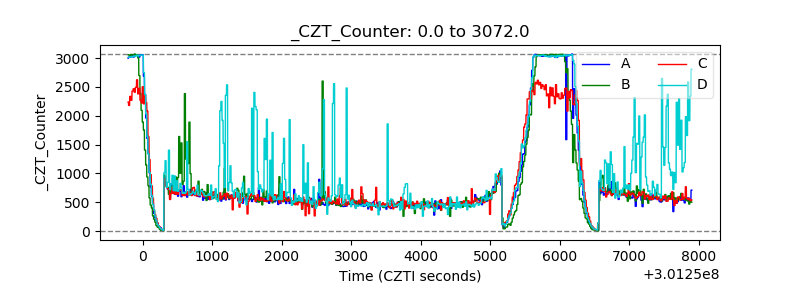 |
| +2.5 Volts monitor |  |
| +5 Volts monitor |  |
| _ROLL_ROT | 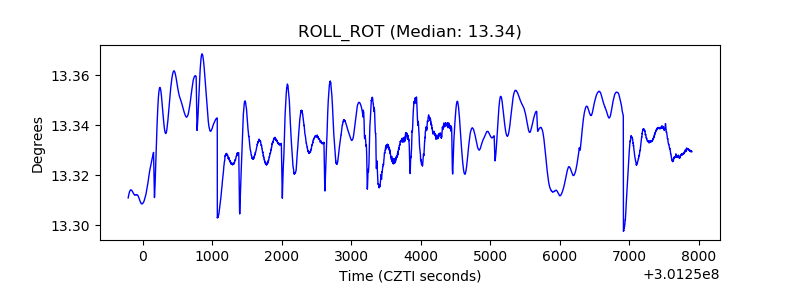 |
| _Roll_DEC | 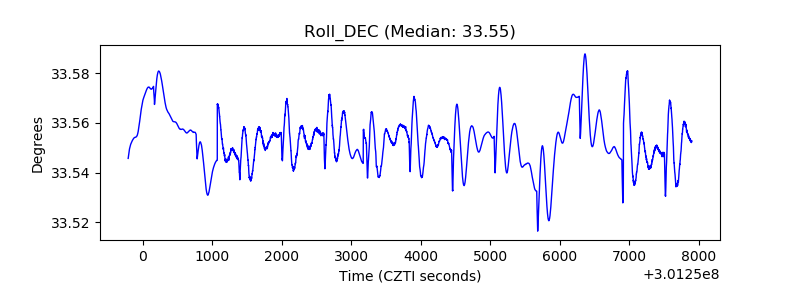 |
| _Roll_RA | 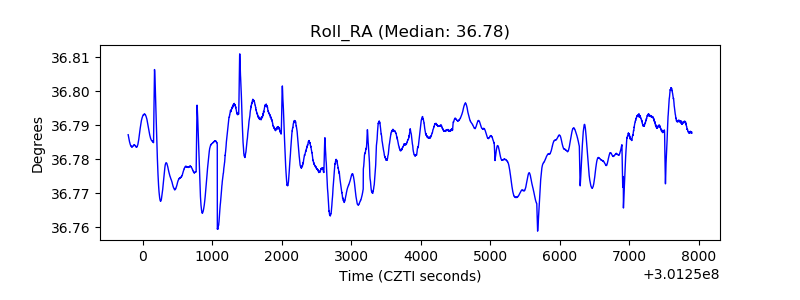 |
| Veto Counter | 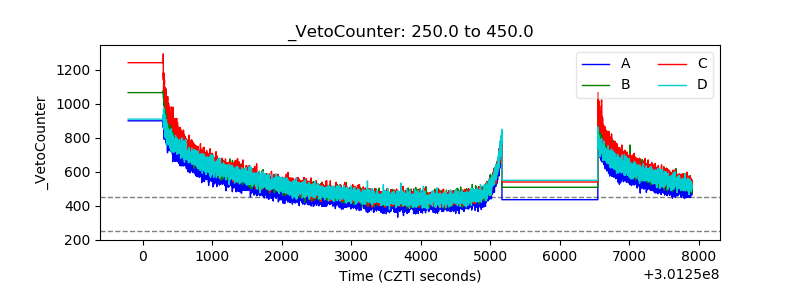 |