| Param | Original file | Final file |
|---|---|---|
| Filename | modeM0/AS1A06_003T04_9000003046_20584cztM0_level2.evt | modeM0/AS1A06_003T04_9000003046_20584cztM0_level2_quad_clean.evt |
| Size (bytes) | 504,469,440 | 87,503,040 |
| Size | 481.1 MB | 83.4 MB |
| Events in quadrant A | 3,098,463 | 567,877 |
| Events in quadrant B | 3,201,692 | 577,467 |
| Events in quadrant C | 3,182,398 | 557,798 |
| Events in quadrant D | 5,389,586 | 528,764 |
| Mode M0 | |||
|---|---|---|---|
| Quadrant | BADHDUFLAG | Total packets | Discarded packets |
| A | 0 | 12984 | 1 |
| B | 0 | 13352 | 2 |
| C | 0 | 13111 | 1 |
| D | 0 | 20131 | 1 |
| Mode SS | |||
|---|---|---|---|
| Quadrant | BADHDUFLAG | Total packets | Discarded packets |
| A | 0 | 122 | 0 |
| B | 0 | 122 | 0 |
| C | 0 | 122 | 0 |
| D | 0 | 122 | 0 |
| Mode M9 | |||
|---|---|---|---|
| Quadrant | BADHDUFLAG | Total packets | Discarded packets |
| A | 0 | 13 | 0 |
| B | 0 | 13 | 0 |
| C | 0 | 13 | 0 |
| D | 0 | 13 | 0 |
| Quadrant | Total seconds | Saturated seconds | Saturation percentage |
|---|---|---|---|
| A | 5983 | 35 | 0.584991% |
| B | 5983 | 49 | 0.818987% |
| C | 5983 | 101 | 1.688116% |
| D | 5983 | 503 | 8.407154% |
Noise dominated data is calculated using 1-second bins in cleaned event files. If a bin has >2000 counts, and if more than 50% of those come from <1% of pixels, then it is considered to be noise-dominated and hence unusable.
| Quadrant | # 1 sec bins | Bins with >0 counts | Bins with >2000 counts | High rate bins dominated by noise | Noise dominated (total time) | Noise dominated (detector-on time) | Marked lightcurve |
|---|---|---|---|---|---|---|---|
| A | 7303 | 5984 | 0 | 0 | 0.00% | 0.00% | 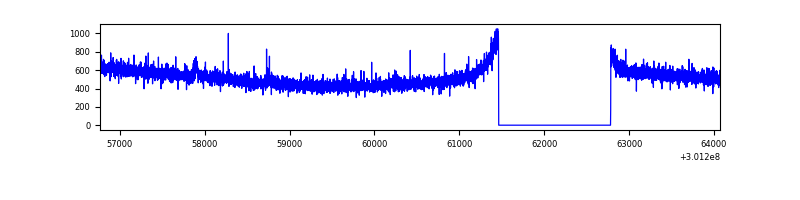 |
| B | 7303 | 5984 | 0 | 0 | 0.00% | 0.00% | 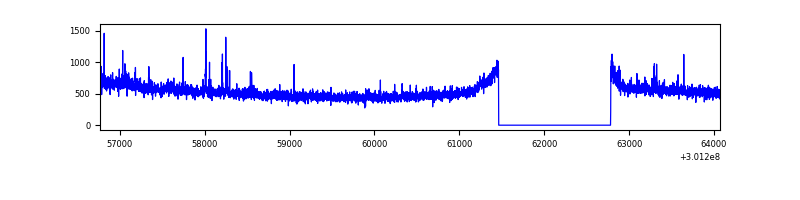 |
| C | 7303 | 5984 | 0 | 0 | 0.00% | 0.00% | 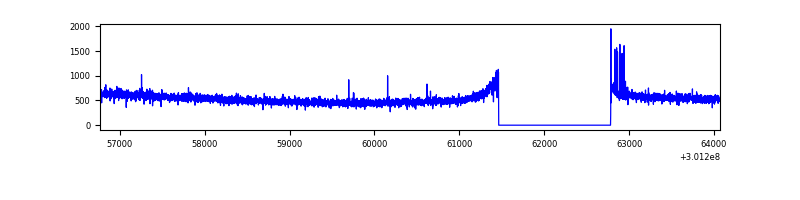 |
| D | 7303 | 5984 | 380 | 380 | 5.20% | 6.35% | 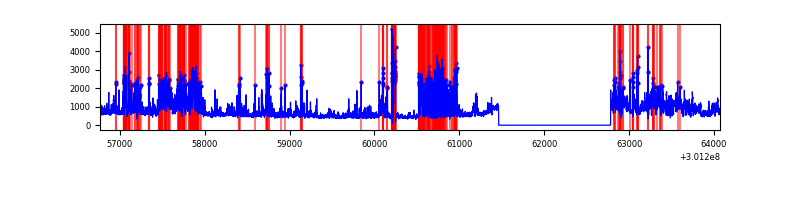 |
Top three noisy pixels from each quadrant. If the there are fewer than three noisy pixels in the level2.evt file, extra rows are filled as -1
| Pixel properties | Quadrant properties | ||||||
|---|---|---|---|---|---|---|---|
| Quadrant | DetID | PixID | Counts | Sigma | Mean | Median | Sigma |
| A | 14 | 239 | 11110 | 64.4 | 801 | 786 | 160.3 |
| A | 0 | 226 | 7008 | 38.81 | 801 | 786 | 160.3 |
| A | 8 | 205 | 6119 | 33.27 | 801 | 786 | 160.3 |
| B | 0 | 189 | 33139 | 212.59 | 800 | 781 | 152.2 |
| B | 12 | 111 | 16494 | 103.23 | 800 | 781 | 152.2 |
| B | 0 | 228 | 15781 | 98.55 | 800 | 781 | 152.2 |
| C | 14 | 238 | 122149 | 675.0 | 778 | 787 | 179.8 |
| C | 8 | 208 | 18120 | 96.4 | 778 | 787 | 179.8 |
| C | 13 | 61 | 5474 | 26.07 | 778 | 787 | 179.8 |
| D | 1 | 20 | 825024 | 4449.66 | 766 | 747 | 185.2 |
| D | 5 | 222 | 736874 | 3973.8 | 766 | 747 | 185.2 |
| D | 1 | 52 | 495675 | 2671.75 | 766 | 747 | 185.2 |
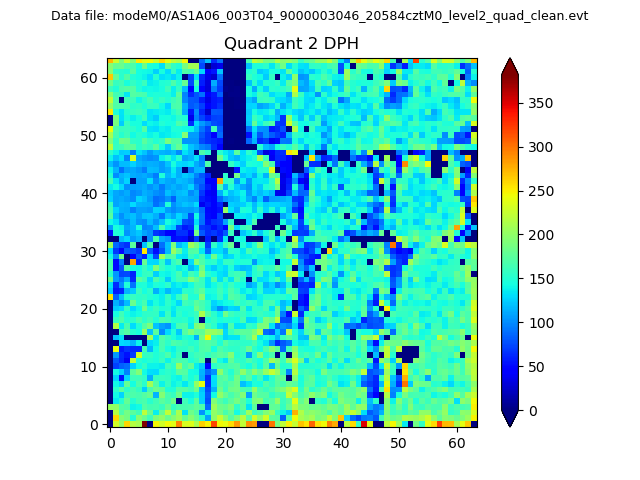
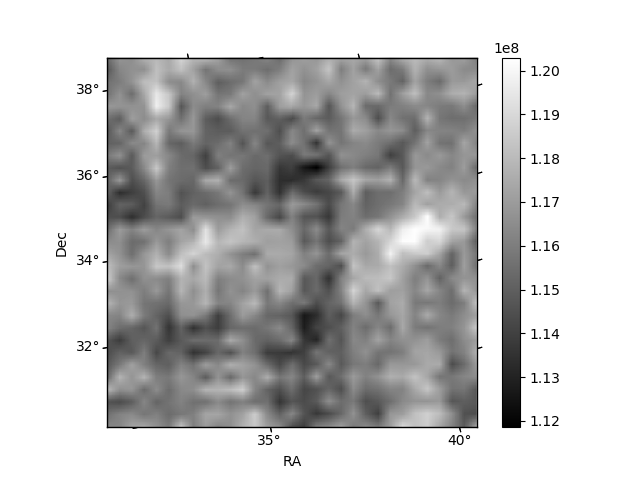
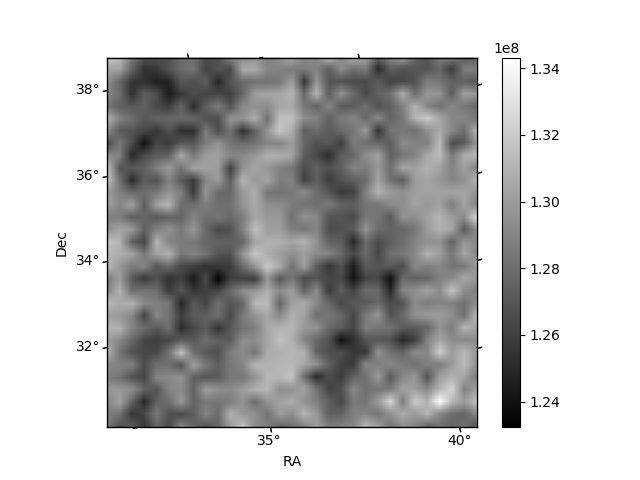
Histogram calculated using DETX and DETY for each event in the final _common_clean file
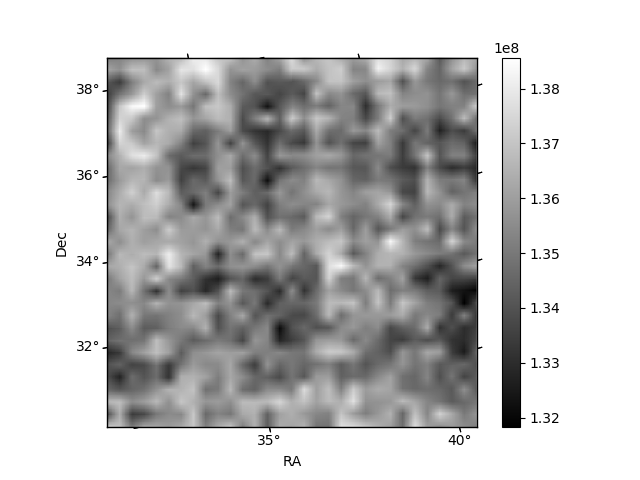
| Quadrant A |  |
 |
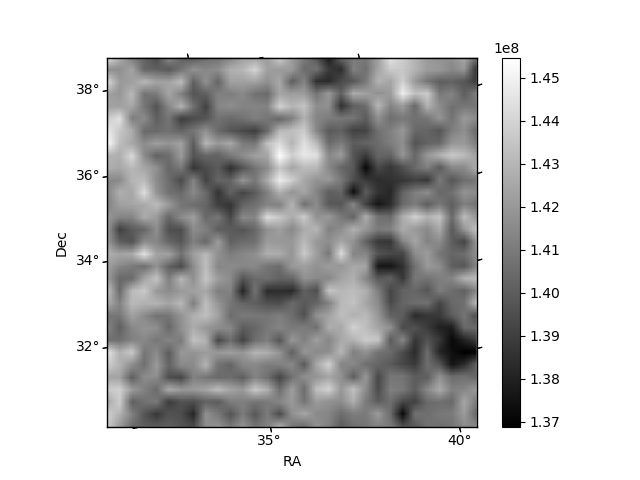
Quadrant B |
|---|---|---|---|
| Quadrant D | 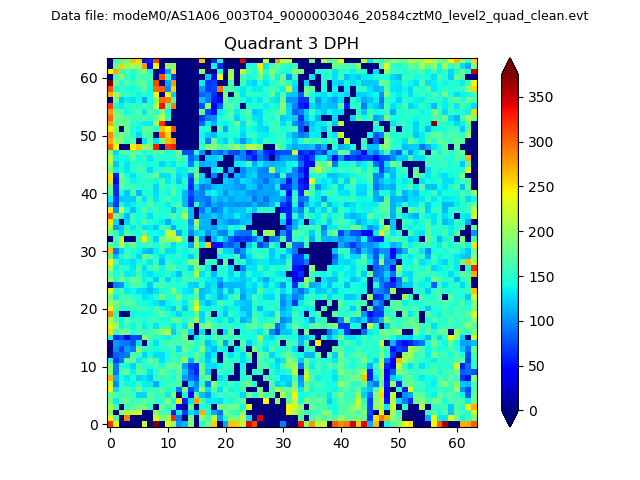 |
 |
Quadrant C |
| Plot type | Count rate plots | Images |
|---|---|---|
| Comparison with Poisson distribution Blue bars denote a histogram of data divided into 1 sec bins. Red curve is a Poisson curve with rate = median count rate of data. |
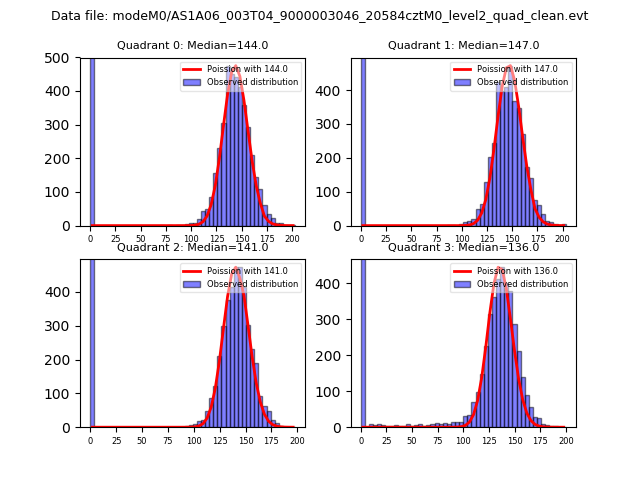 |
 |
| Quadrant-wise count rates Data is divided into 100 sec bins |
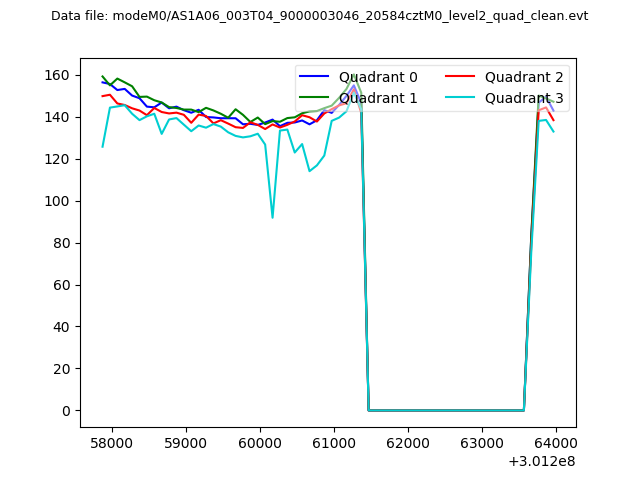 |
|
| Module-wise count rates for Quadrant A Data is divided into 100 sec bins |
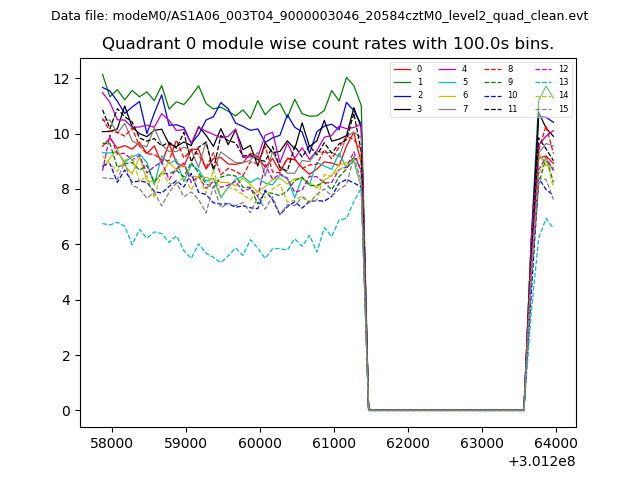 |
 |
| Module-wise count rates for Quadrant B Data is divided into 100 sec bins |
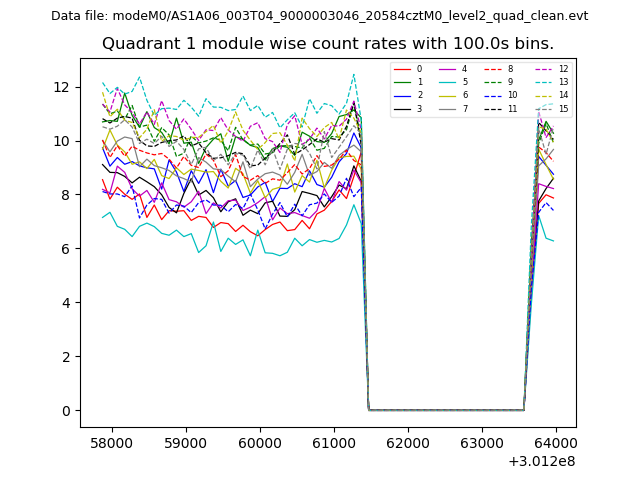 |
 |
| Module-wise count rates for Quadrant C Data is divided into 100 sec bins |
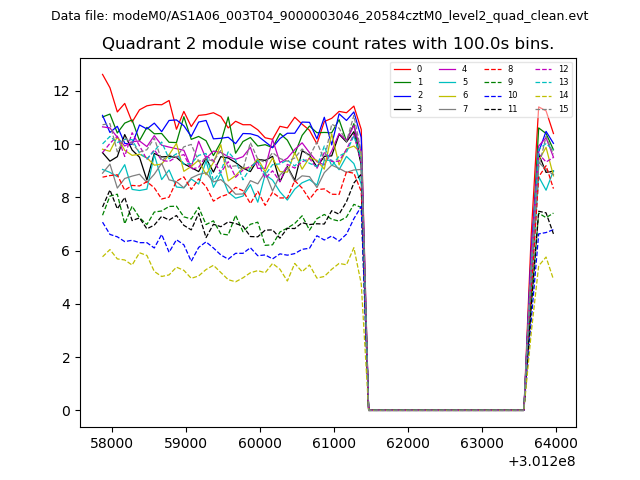 |
 |
| Module-wise count rates for Quadrant D Data is divided into 100 sec bins |
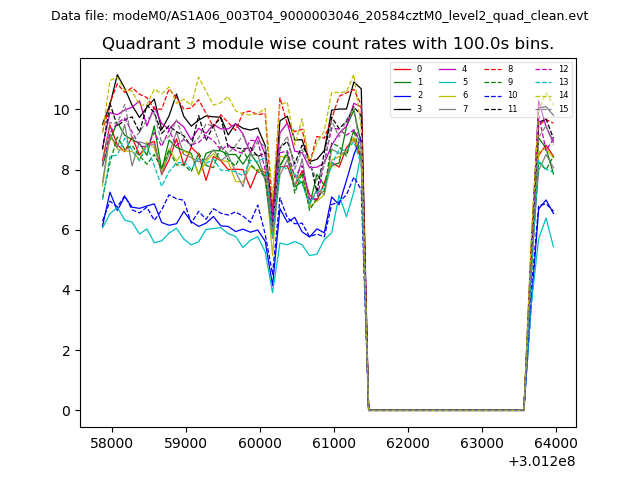 |
 |
| Parameter | Plot |
|---|---|
| CZT HV Monitor | 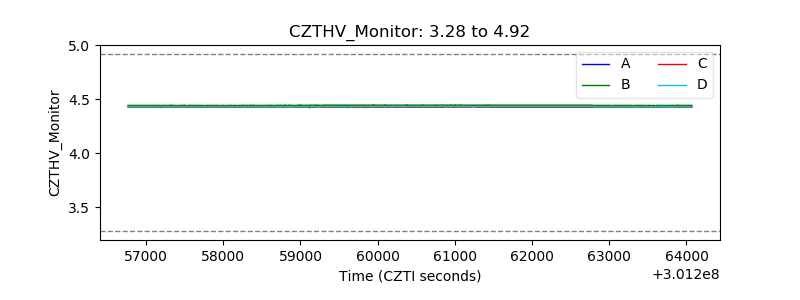 |
| D_VDD | 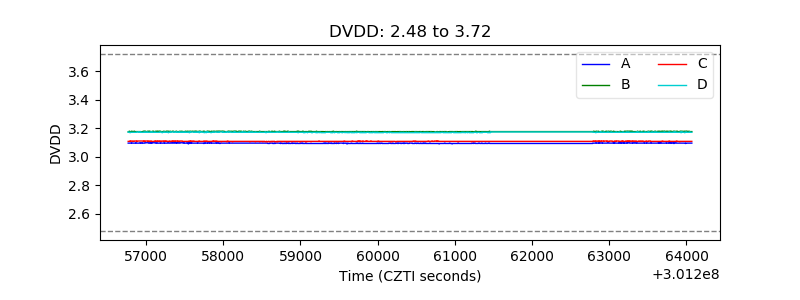 |
| Temperature 1 | 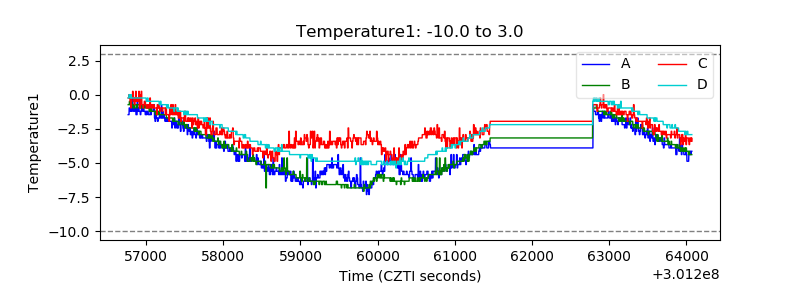 |
| Veto HV Monitor |  |
| Veto LLD | 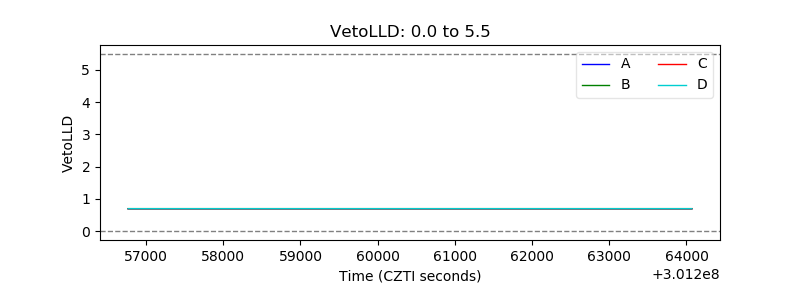 |
| Alpha Counter | 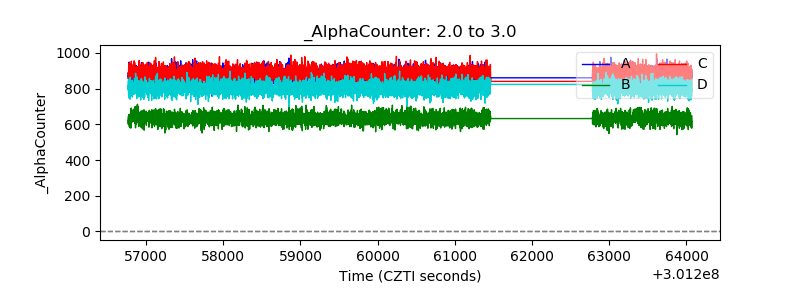 |
| _CPM_Rate | 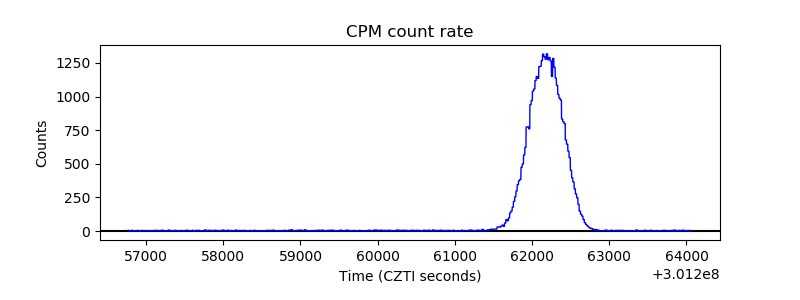 |
| CZT Counter | 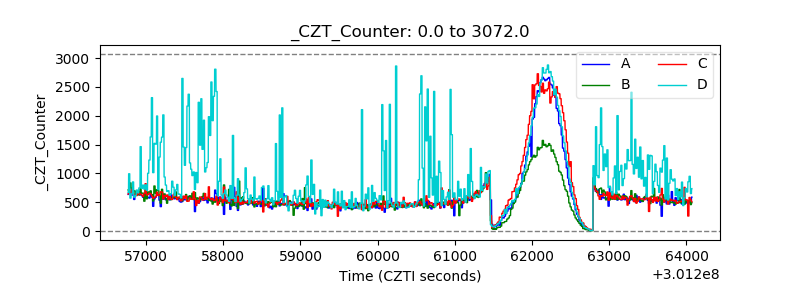 |
| +2.5 Volts monitor |  |
| +5 Volts monitor |  |
| _ROLL_ROT | 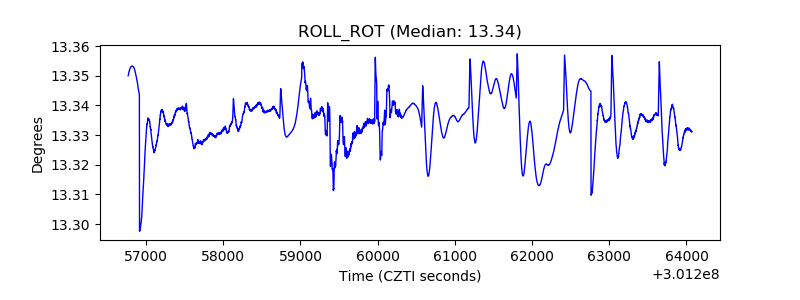 |
| _Roll_DEC | 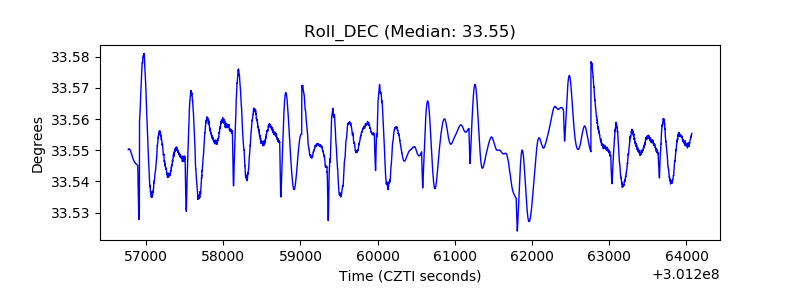 |
| _Roll_RA | 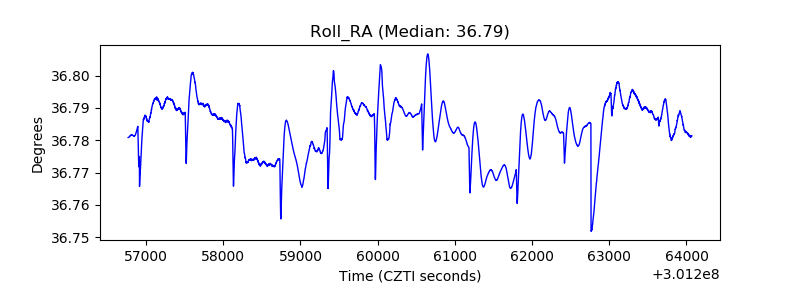 |
| Veto Counter | 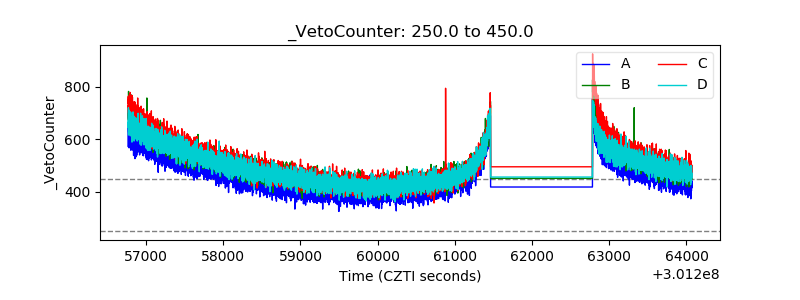 |