| Param | Original file | Final file |
|---|---|---|
| Filename | modeM0/AS1A06_003T04_9000003046_20585cztM0_level2.evt | modeM0/AS1A06_003T04_9000003046_20585cztM0_level2_quad_clean.evt |
| Size (bytes) | 505,497,600 | 94,639,680 |
| Size | 482.1 MB | 90.3 MB |
| Events in quadrant A | 3,251,443 | 609,953 |
| Events in quadrant B | 3,484,982 | 616,998 |
| Events in quadrant C | 3,348,804 | 599,223 |
| Events in quadrant D | 4,778,113 | 582,037 |
| Mode M0 | |||
|---|---|---|---|
| Quadrant | BADHDUFLAG | Total packets | Discarded packets |
| A | 0 | 13817 | 2 |
| B | 0 | 14568 | 2 |
| C | 0 | 13985 | 2 |
| D | 0 | 18794 | 2 |
| Mode SS | |||
|---|---|---|---|
| Quadrant | BADHDUFLAG | Total packets | Discarded packets |
| A | 0 | 136 | 0 |
| B | 0 | 136 | 0 |
| C | 0 | 136 | 0 |
| D | 0 | 136 | 0 |
| Mode M9 | |||
|---|---|---|---|
| Quadrant | BADHDUFLAG | Total packets | Discarded packets |
| A | 0 | 23 | 0 |
| B | 0 | 23 | 0 |
| C | 0 | 23 | 0 |
| D | 0 | 23 | 0 |
| Quadrant | Total seconds | Saturated seconds | Saturation percentage |
|---|---|---|---|
| A | 6561 | 86 | 1.310776% |
| B | 6562 | 128 | 1.950625% |
| C | 6562 | 138 | 2.103017% |
| D | 6562 | 339 | 5.166108% |
Noise dominated data is calculated using 1-second bins in cleaned event files. If a bin has >2000 counts, and if more than 50% of those come from <1% of pixels, then it is considered to be noise-dominated and hence unusable.
| Quadrant | # 1 sec bins | Bins with >0 counts | Bins with >2000 counts | High rate bins dominated by noise | Noise dominated (total time) | Noise dominated (detector-on time) | Marked lightcurve |
|---|---|---|---|---|---|---|---|
| A | 8886 | 6563 | 0 | 0 | 0.00% | 0.00% | 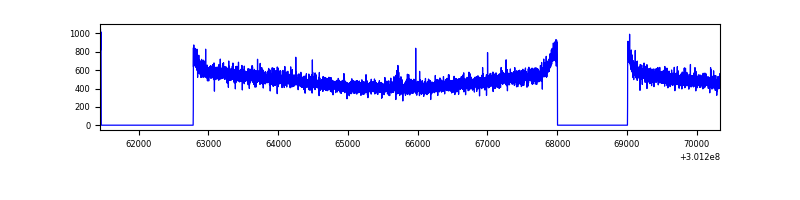 |
| B | 8887 | 6564 | 9 | 9 | 0.10% | 0.14% | 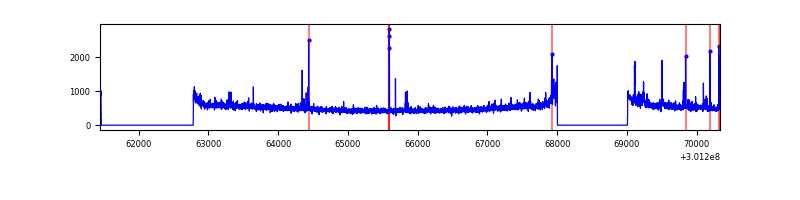 |
| C | 8887 | 6564 | 0 | 0 | 0.00% | 0.00% | 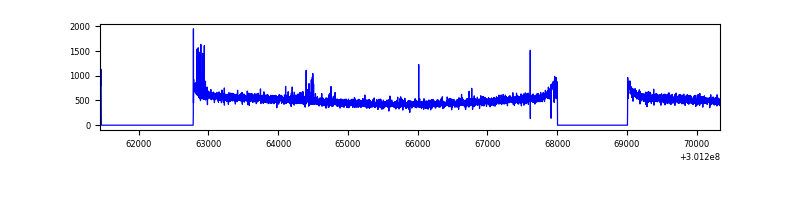 |
| D | 8887 | 6564 | 162 | 162 | 1.82% | 2.47% | 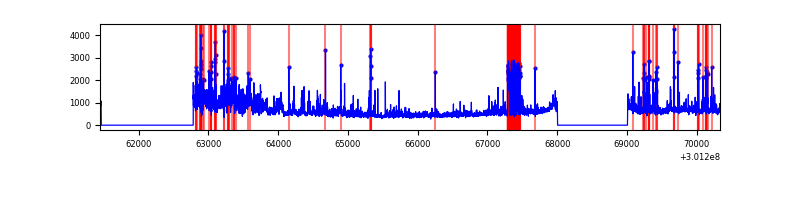 |
Top three noisy pixels from each quadrant. If the there are fewer than three noisy pixels in the level2.evt file, extra rows are filled as -1
| Pixel properties | Quadrant properties | ||||||
|---|---|---|---|---|---|---|---|
| Quadrant | DetID | PixID | Counts | Sigma | Mean | Median | Sigma |
| A | 0 | 226 | 7427 | 39.06 | 844 | 824 | 169.1 |
| A | 3 | 137 | 6606 | 34.2 | 844 | 824 | 169.1 |
| A | 12 | 194 | 6155 | 31.53 | 844 | 824 | 169.1 |
| B | 7 | 220 | 40264 | 246.96 | 842 | 823 | 159.7 |
| B | 0 | 219 | 34938 | 213.61 | 842 | 823 | 159.7 |
| B | 4 | 216 | 34133 | 208.57 | 842 | 823 | 159.7 |
| C | 14 | 238 | 127175 | 664.2 | 817 | 824 | 190.2 |
| C | 8 | 208 | 33128 | 169.82 | 817 | 824 | 190.2 |
| C | 13 | 61 | 5846 | 26.4 | 817 | 824 | 190.2 |
| D | 1 | 20 | 1006104 | 5050.73 | 819 | 796 | 199.0 |
| D | 5 | 222 | 301492 | 1510.71 | 819 | 796 | 199.0 |
| D | 1 | 52 | 85024 | 423.17 | 819 | 796 | 199.0 |
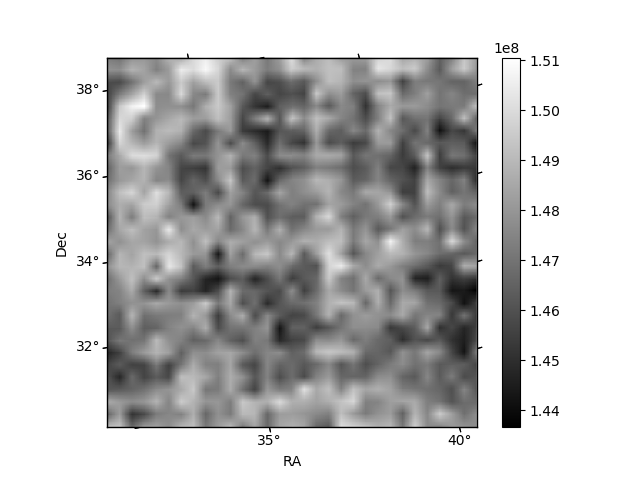
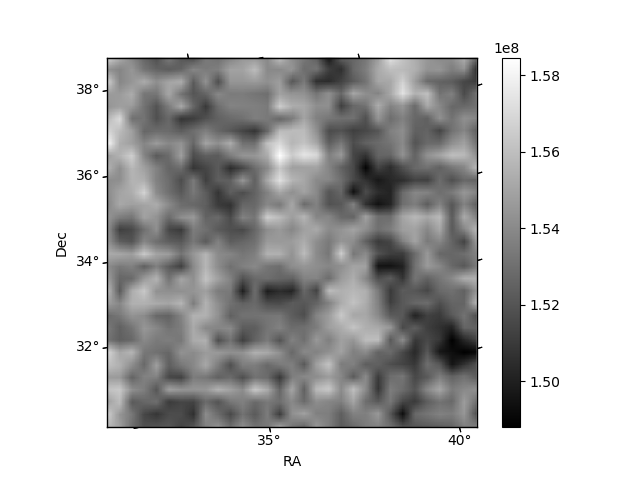
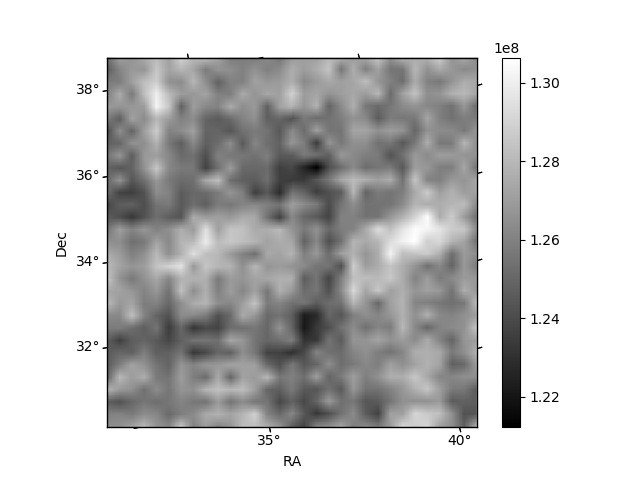
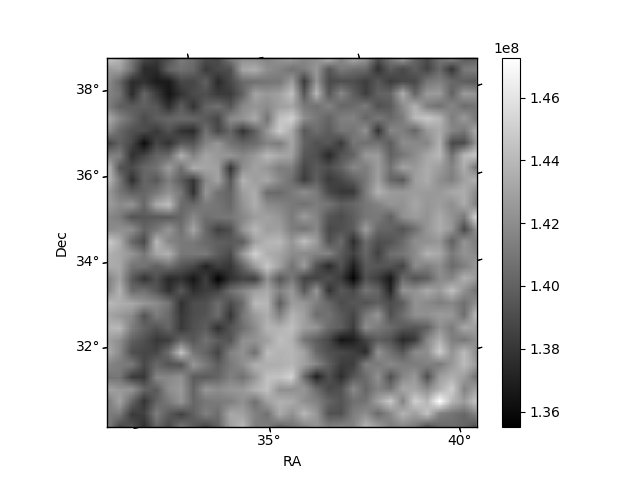
Histogram calculated using DETX and DETY for each event in the final _common_clean file
| Quadrant A | 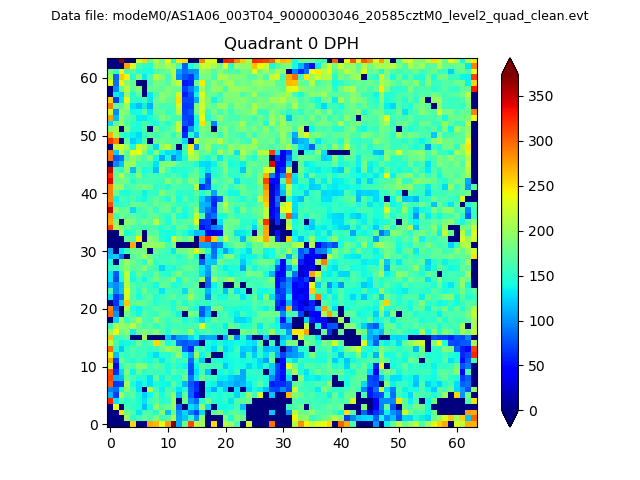 |
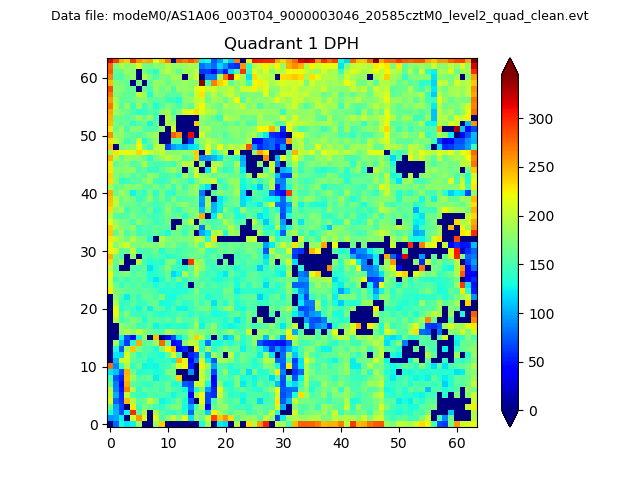 |
Quadrant B |
|---|---|---|---|
| Quadrant D | 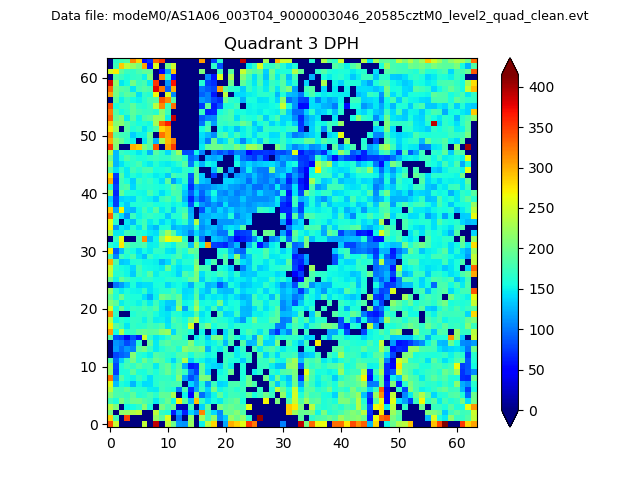 |
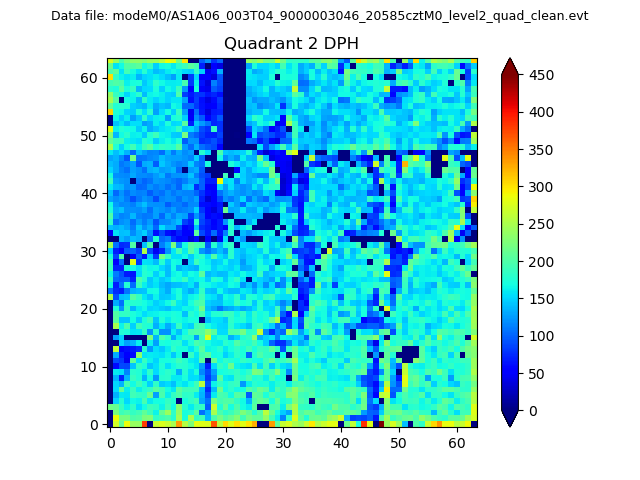 |
Quadrant C |
| Plot type | Count rate plots | Images |
|---|---|---|
| Comparison with Poisson distribution Blue bars denote a histogram of data divided into 1 sec bins. Red curve is a Poisson curve with rate = median count rate of data. |
 |
 |
| Quadrant-wise count rates Data is divided into 100 sec bins |
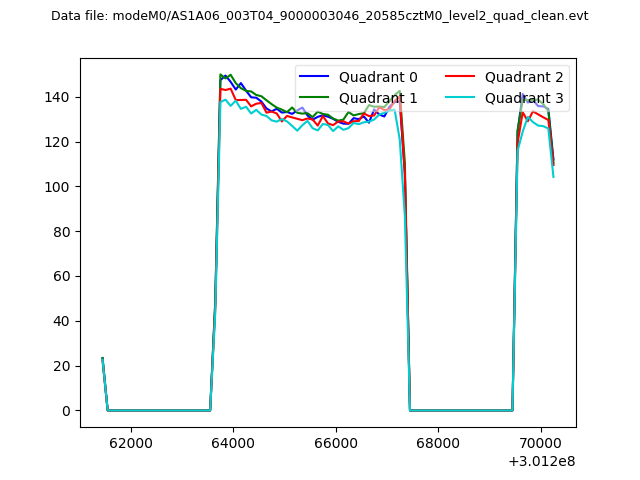 |
|
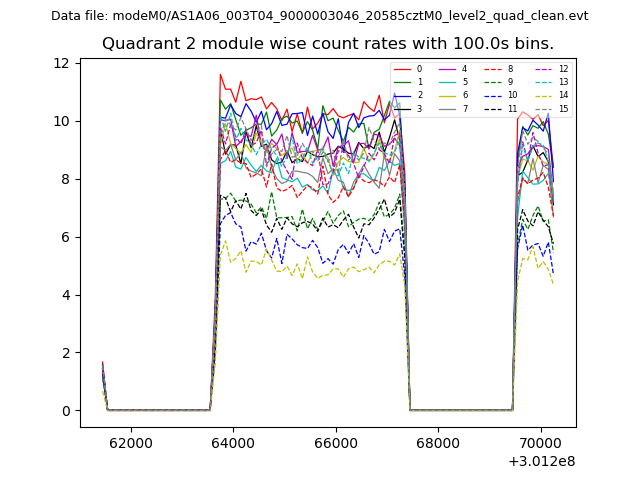
| Module-wise count rates for Quadrant A Data is divided into 100 sec bins |
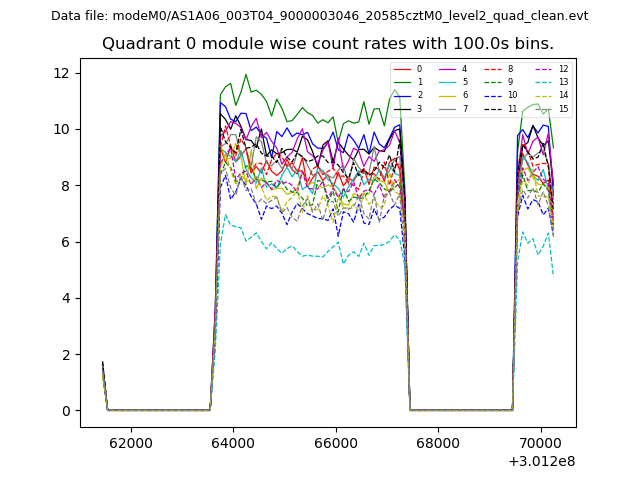 |
 |
| Module-wise count rates for Quadrant B Data is divided into 100 sec bins |
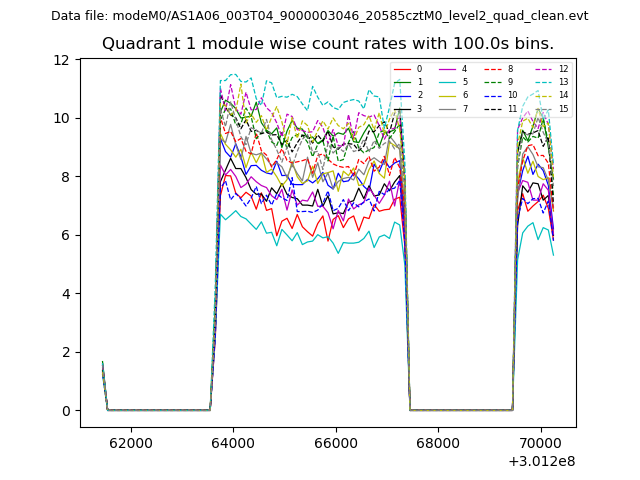 |
 |
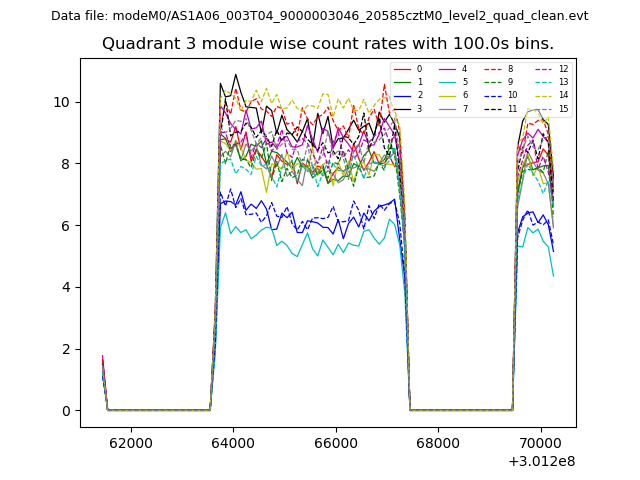
| Module-wise count rates for Quadrant C Data is divided into 100 sec bins |
 |
 |
| Module-wise count rates for Quadrant D Data is divided into 100 sec bins |
 |
 |
| Parameter | Plot |
|---|---|
| CZT HV Monitor | 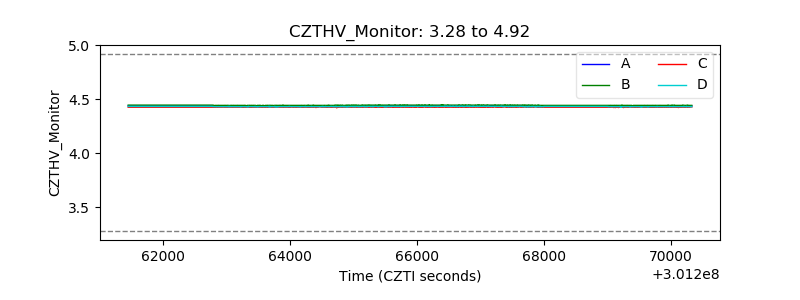 |
| D_VDD | 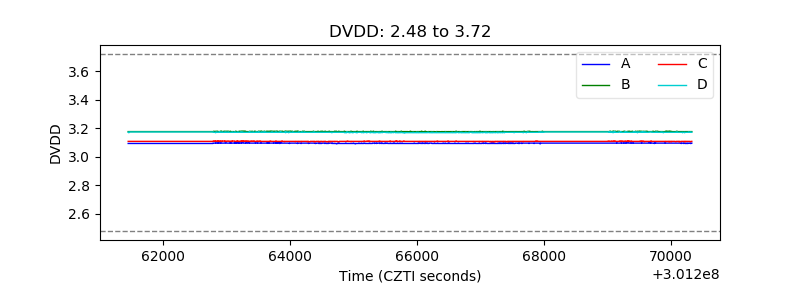 |
| Temperature 1 | 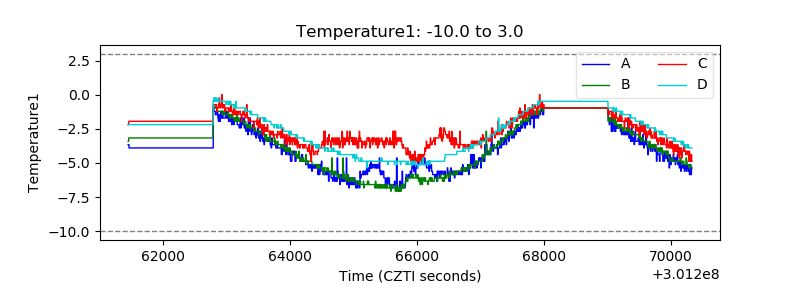 |
| Veto HV Monitor |  |
| Veto LLD | 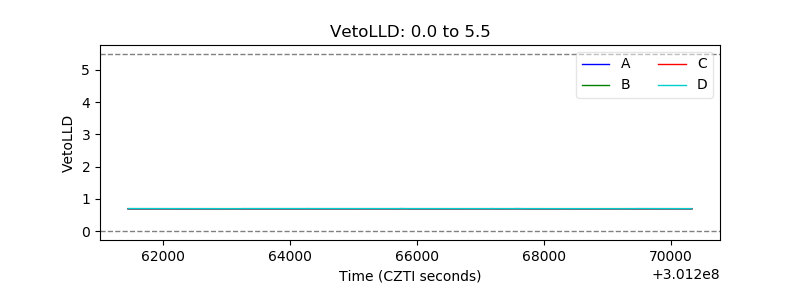 |
| Alpha Counter | 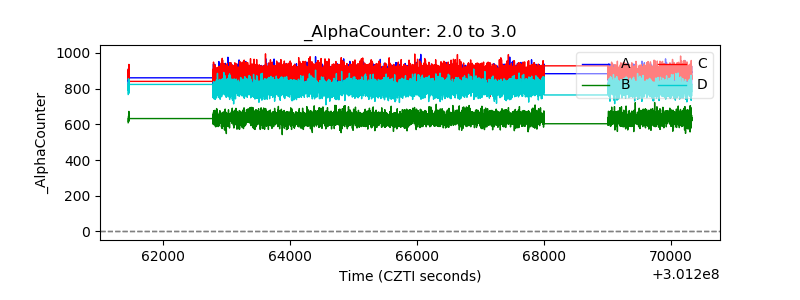 |
| _CPM_Rate | 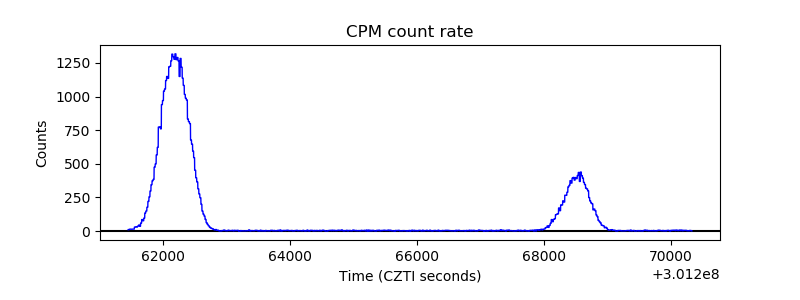 |
| CZT Counter | 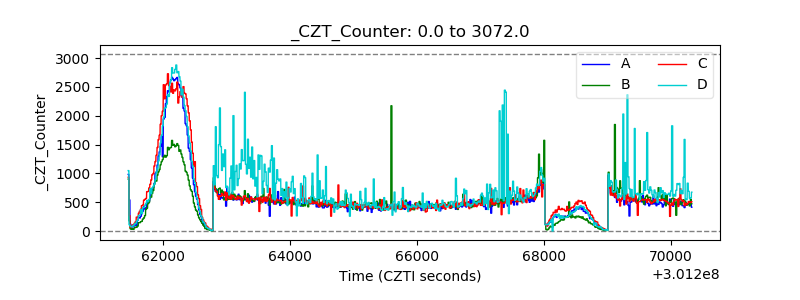 |
| +2.5 Volts monitor | 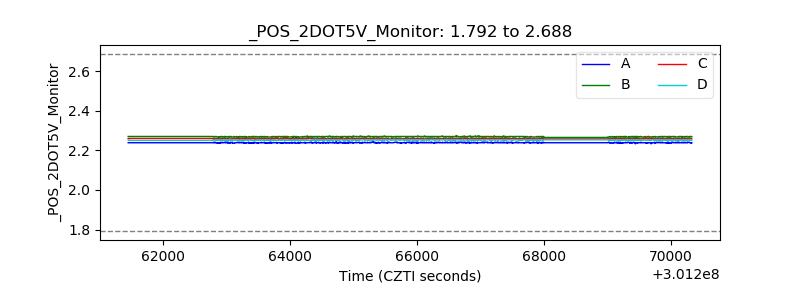 |
| +5 Volts monitor |  |
| _ROLL_ROT | 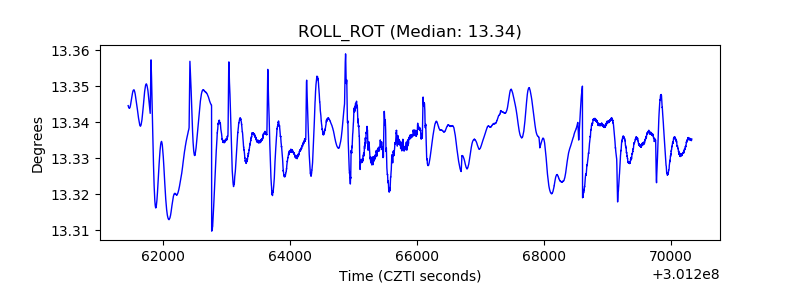 |
| _Roll_DEC | 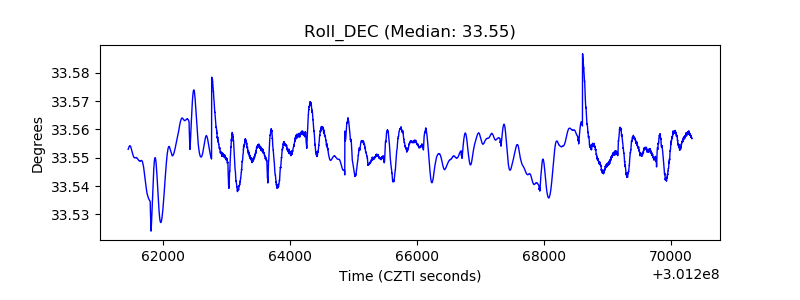 |
| _Roll_RA | 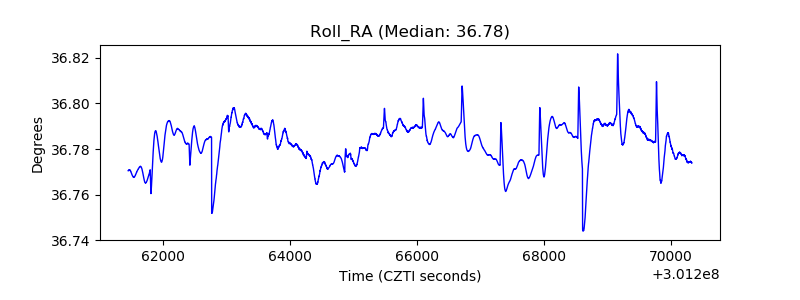 |
| Veto Counter | 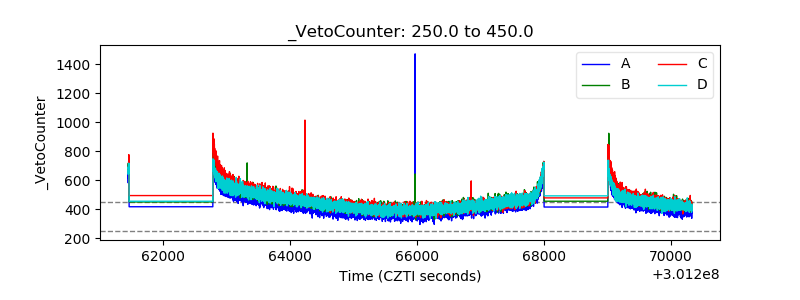 |