| Param | Original file | Final file |
|---|---|---|
| Filename | modeM0/AS1A06_003T04_9000003046_20586cztM0_level2.evt | modeM0/AS1A06_003T04_9000003046_20586cztM0_level2_quad_clean.evt |
| Size (bytes) | 533,001,600 | 100,385,280 |
| Size | 508.3 MB | 95.7 MB |
| Events in quadrant A | 3,337,706 | 648,112 |
| Events in quadrant B | 4,063,465 | 650,533 |
| Events in quadrant C | 3,398,886 | 634,510 |
| Events in quadrant D | 4,865,773 | 618,107 |
| Mode M0 | |||
|---|---|---|---|
| Quadrant | BADHDUFLAG | Total packets | Discarded packets |
| A | 0 | 14526 | 2 |
| B | 0 | 16836 | 2 |
| C | 0 | 14570 | 2 |
| D | 0 | 19385 | 2 |
| Mode SS | |||
|---|---|---|---|
| Quadrant | BADHDUFLAG | Total packets | Discarded packets |
| A | 0 | 142 | 0 |
| B | 0 | 142 | 0 |
| C | 0 | 142 | 0 |
| D | 0 | 142 | 0 |
| Mode M9 | |||
|---|---|---|---|
| Quadrant | BADHDUFLAG | Total packets | Discarded packets |
| A | 0 | 12 | 0 |
| B | 0 | 13 | 0 |
| C | 0 | 13 | 0 |
| D | 0 | 13 | 0 |
| Quadrant | Total seconds | Saturated seconds | Saturation percentage |
|---|---|---|---|
| A | 7019 | 38 | 0.541388% |
| B | 7019 | 203 | 2.892150% |
| C | 7019 | 81 | 1.154011% |
| D | 7019 | 348 | 4.957971% |
Noise dominated data is calculated using 1-second bins in cleaned event files. If a bin has >2000 counts, and if more than 50% of those come from <1% of pixels, then it is considered to be noise-dominated and hence unusable.
| Quadrant | # 1 sec bins | Bins with >0 counts | Bins with >2000 counts | High rate bins dominated by noise | Noise dominated (total time) | Noise dominated (detector-on time) | Marked lightcurve |
|---|---|---|---|---|---|---|---|
| A | 7704 | 7020 | 0 | 0 | 0.00% | 0.00% | 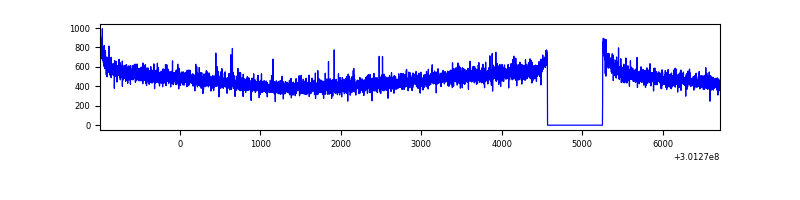 |
| B | 7704 | 7020 | 68 | 68 | 0.88% | 0.97% | 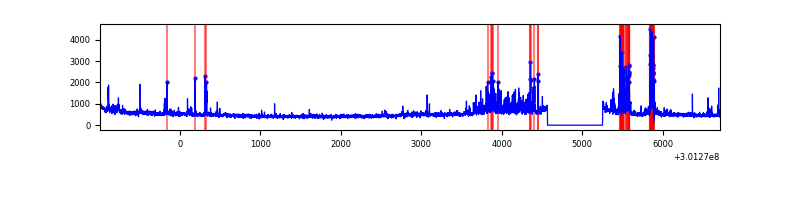 |
| C | 7704 | 7020 | 0 | 0 | 0.00% | 0.00% | 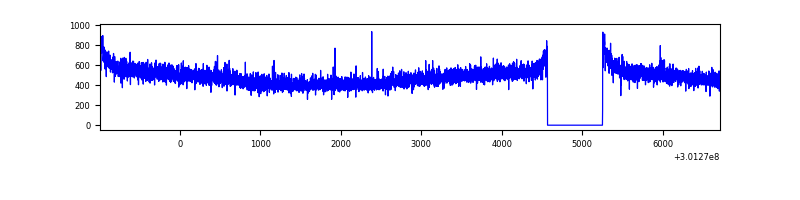 |
| D | 7704 | 7020 | 203 | 203 | 2.63% | 2.89% | 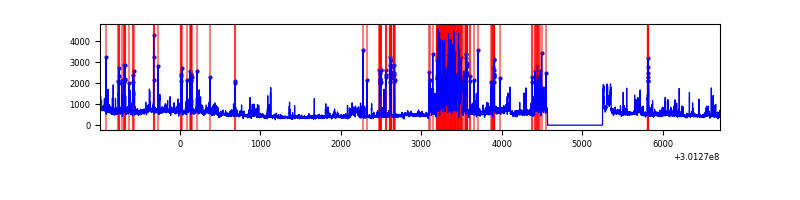 |
Top three noisy pixels from each quadrant. If the there are fewer than three noisy pixels in the level2.evt file, extra rows are filled as -1
| Pixel properties | Quadrant properties | ||||||
|---|---|---|---|---|---|---|---|
| Quadrant | DetID | PixID | Counts | Sigma | Mean | Median | Sigma |
| A | 0 | 226 | 7557 | 38.4 | 865 | 846 | 174.8 |
| A | 12 | 194 | 7218 | 36.46 | 865 | 846 | 174.8 |
| A | 3 | 137 | 6782 | 33.96 | 865 | 846 | 174.8 |
| B | 7 | 220 | 373884 | 2283.06 | 859 | 837 | 163.4 |
| B | 5 | 172 | 65450 | 395.43 | 859 | 837 | 163.4 |
| B | 0 | 189 | 47538 | 285.81 | 859 | 837 | 163.4 |
| C | 14 | 238 | 129613 | 656.68 | 833 | 839 | 196.1 |
| C | 8 | 208 | 18925 | 92.23 | 833 | 839 | 196.1 |
| C | 13 | 61 | 5877 | 25.69 | 833 | 839 | 196.1 |
| D | 5 | 222 | 982485 | 4876.94 | 830 | 806 | 201.3 |
| D | 1 | 20 | 206040 | 1019.59 | 830 | 806 | 201.3 |
| D | 13 | 153 | 166226 | 821.8 | 830 | 806 | 201.3 |
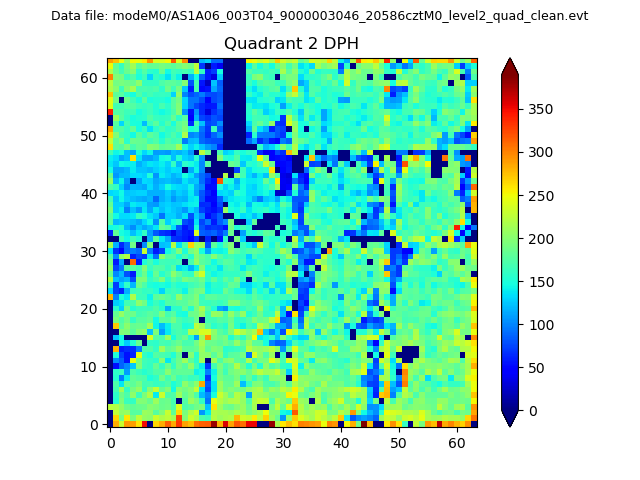
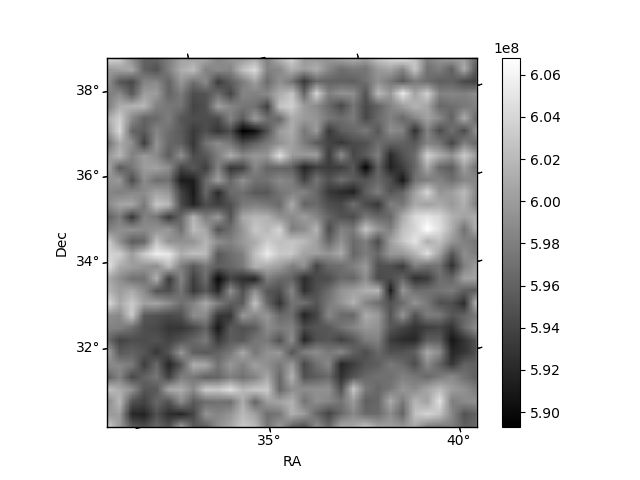
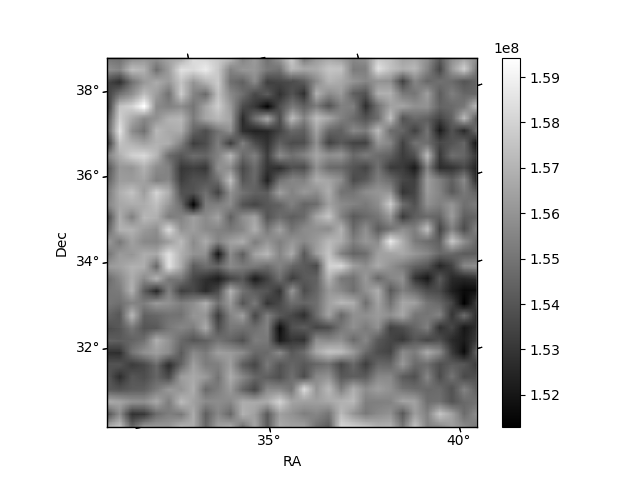
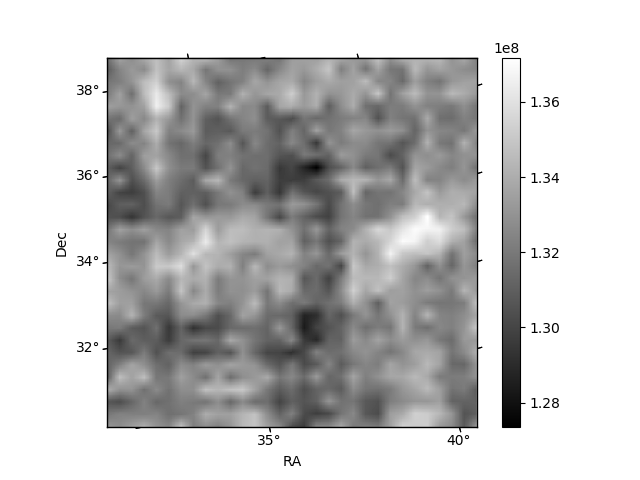
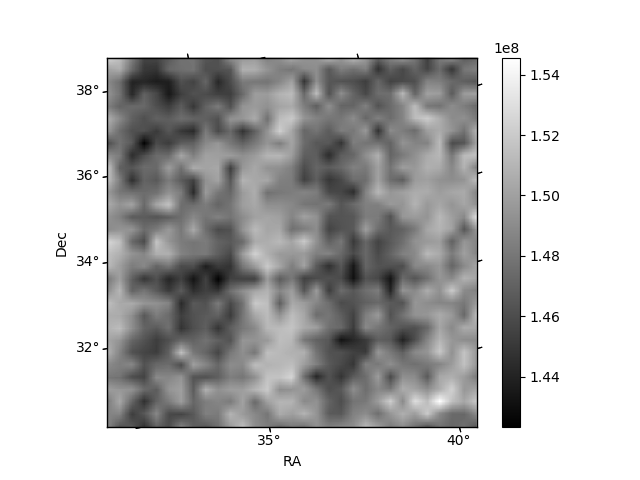
Histogram calculated using DETX and DETY for each event in the final _common_clean file
| Quadrant A | 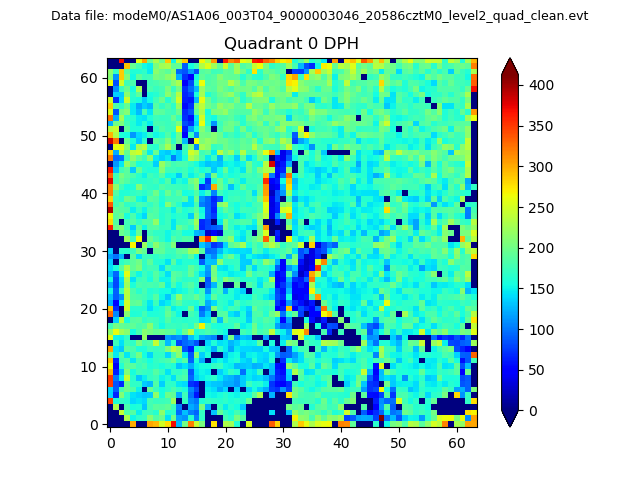 |
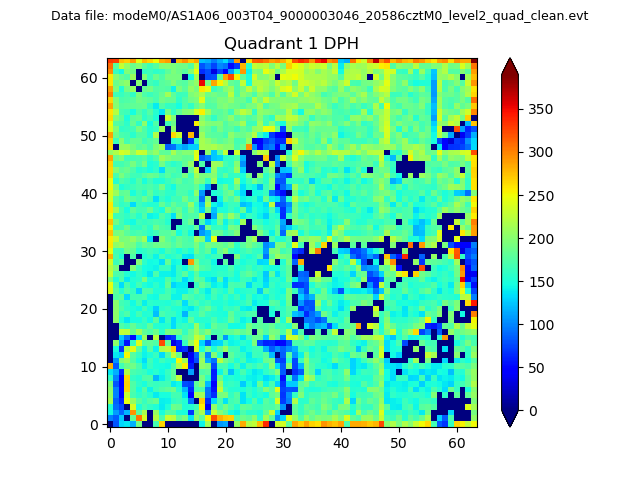 |
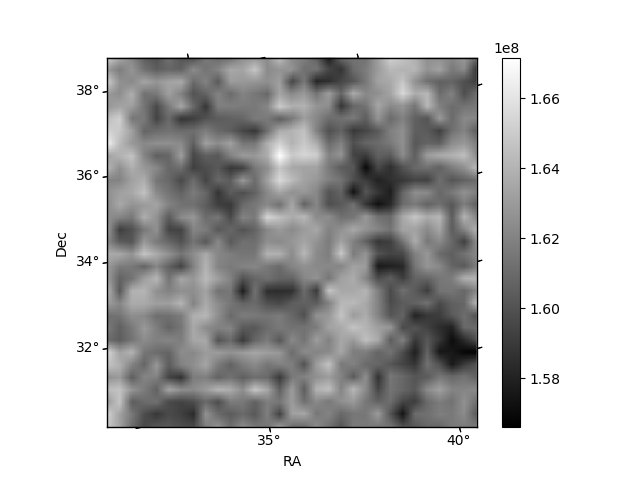
Quadrant B |
|---|---|---|---|
| Quadrant D | 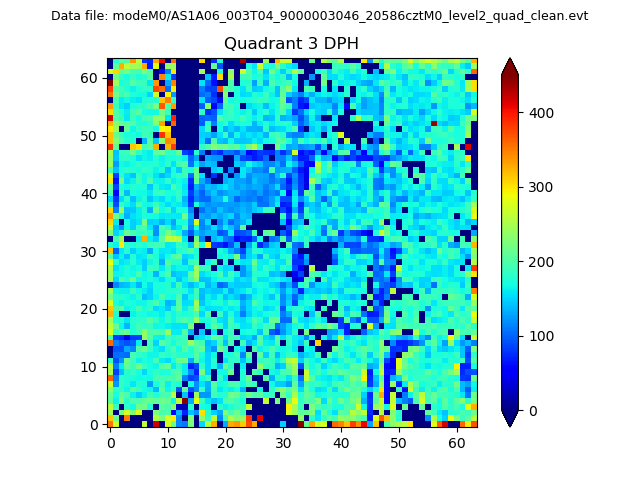 |
 |
Quadrant C |
| Plot type | Count rate plots | Images |
|---|---|---|
| Comparison with Poisson distribution Blue bars denote a histogram of data divided into 1 sec bins. Red curve is a Poisson curve with rate = median count rate of data. |
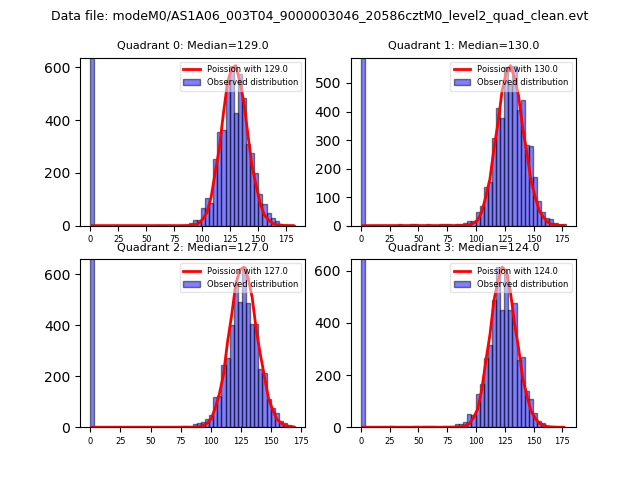 |
 |
| Quadrant-wise count rates Data is divided into 100 sec bins |
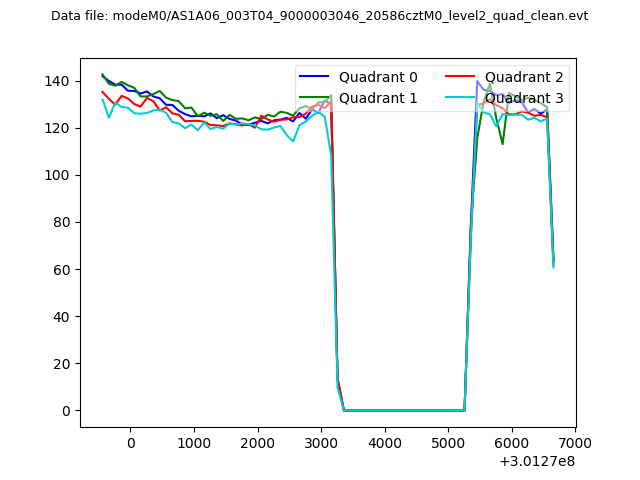 |
|
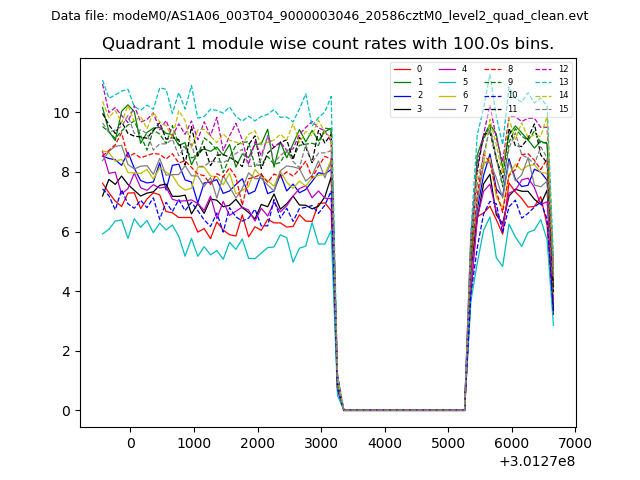
| Module-wise count rates for Quadrant A Data is divided into 100 sec bins |
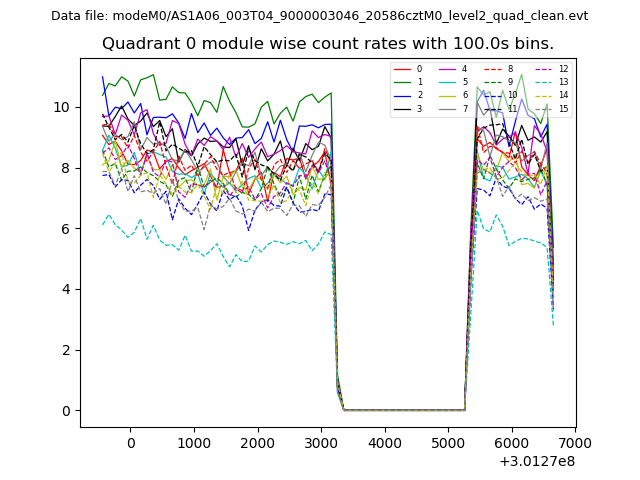 |
 |
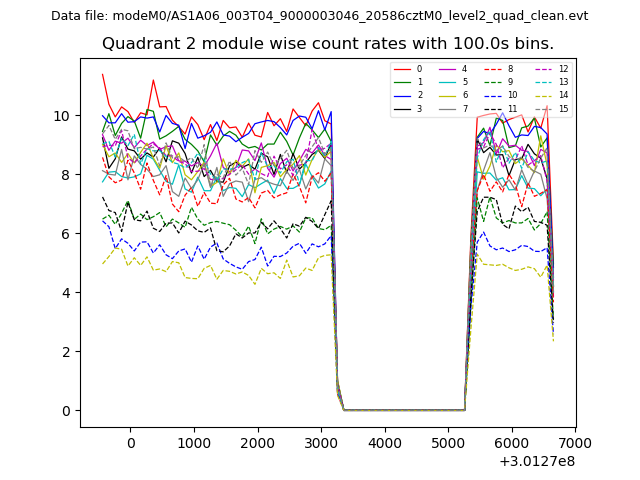
| Module-wise count rates for Quadrant B Data is divided into 100 sec bins |
 |
 |
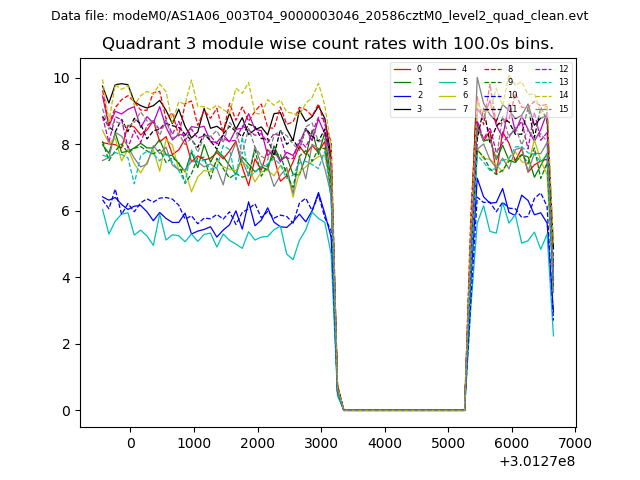
| Module-wise count rates for Quadrant C Data is divided into 100 sec bins |
 |
 |
| Module-wise count rates for Quadrant D Data is divided into 100 sec bins |
 |
 |
| Parameter | Plot |
|---|---|
| CZT HV Monitor | 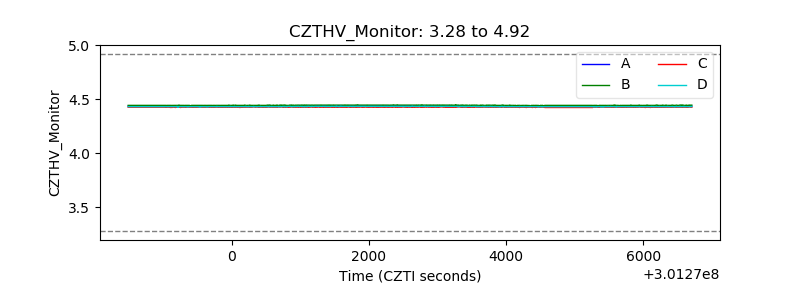 |
| D_VDD | 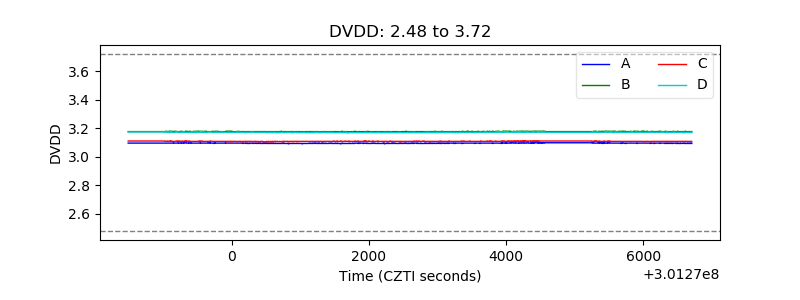 |
| Temperature 1 | 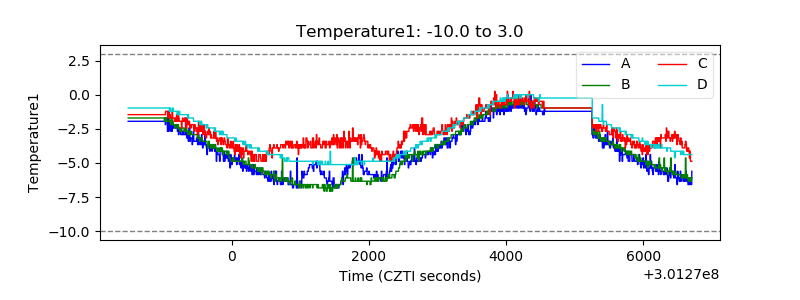 |
| Veto HV Monitor | 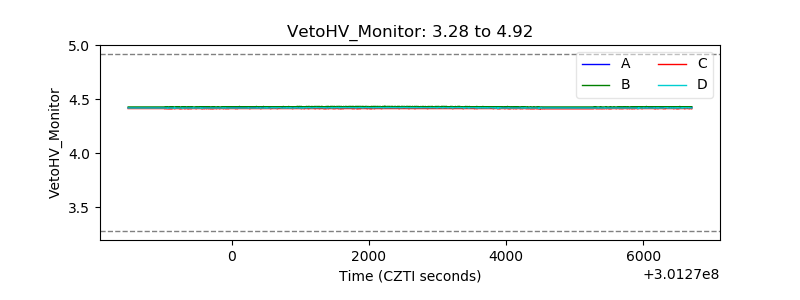 |
| Veto LLD | 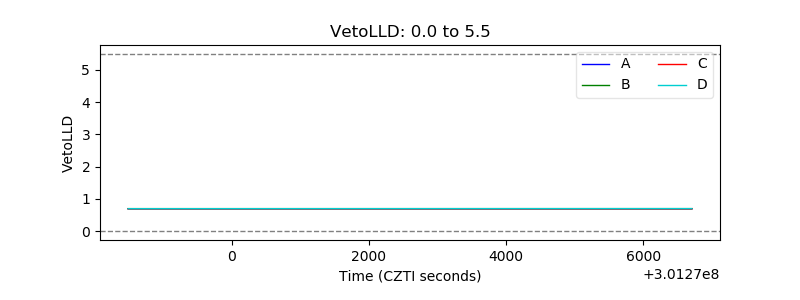 |
| Alpha Counter | 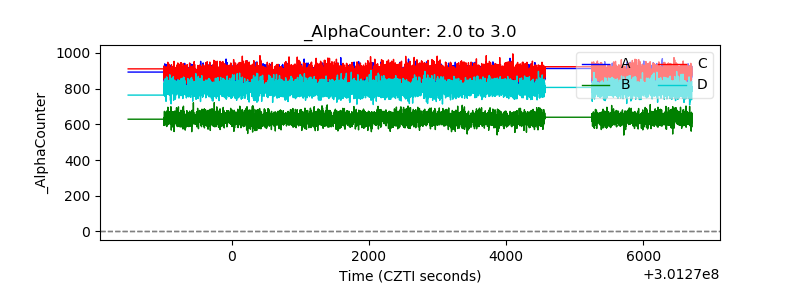 |
| _CPM_Rate | 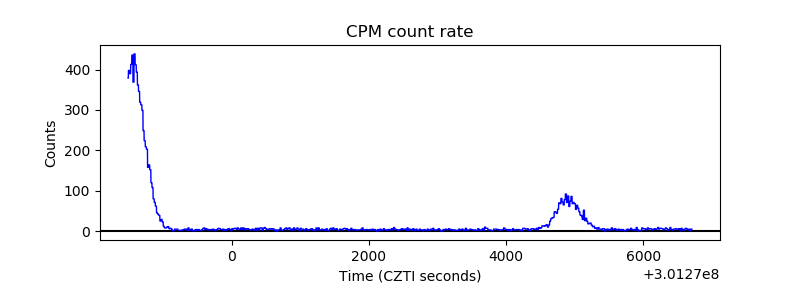 |
| CZT Counter | 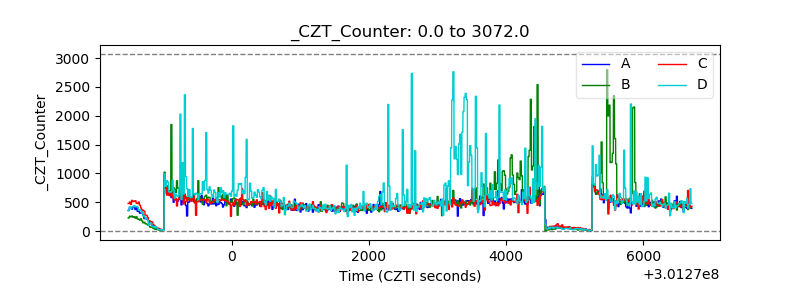 |
| +2.5 Volts monitor |  |
| +5 Volts monitor |  |
| _ROLL_ROT | 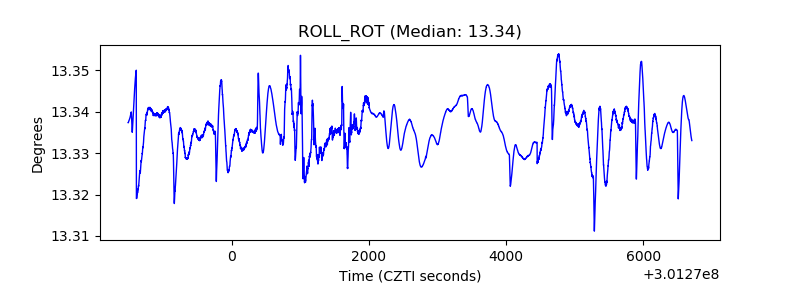 |
| _Roll_DEC | 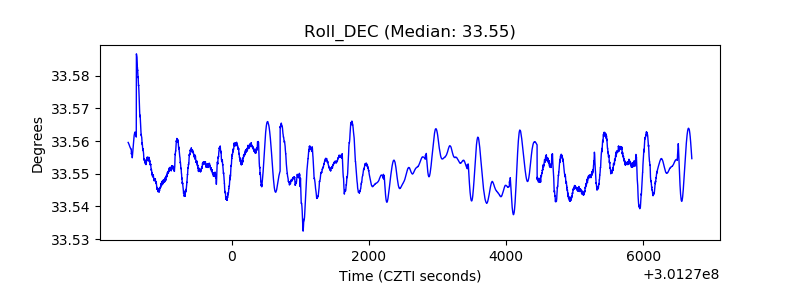 |
| _Roll_RA | 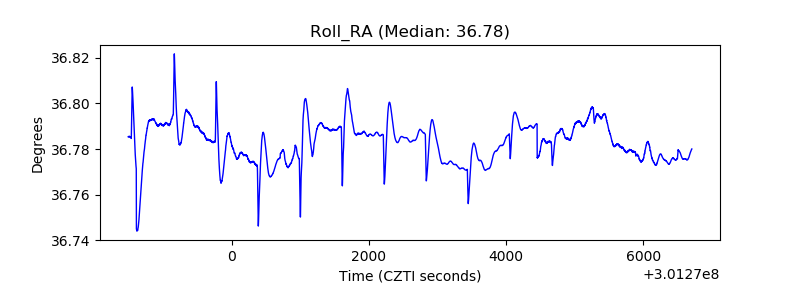 |
| Veto Counter | 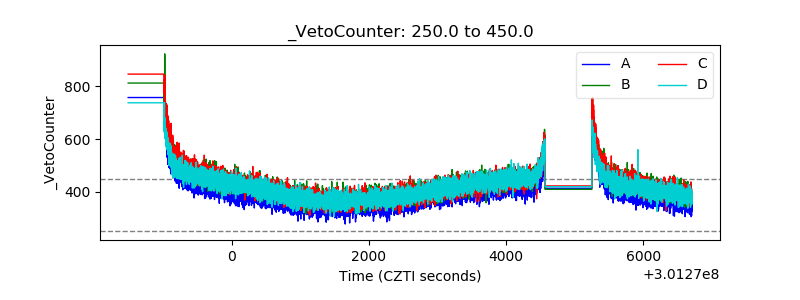 |