| Param | Original file | Final file |
|---|---|---|
| Filename | modeM0/AS1A06_003T04_9000003046_20588cztM0_level2.evt | modeM0/AS1A06_003T04_9000003046_20588cztM0_level2_quad_clean.evt |
| Size (bytes) | 582,929,280 | 102,804,480 |
| Size | 555.9 MB | 98.0 MB |
| Events in quadrant A | 3,424,181 | 656,560 |
| Events in quadrant B | 3,751,868 | 669,819 |
| Events in quadrant C | 4,387,011 | 643,841 |
| Events in quadrant D | 5,586,999 | 625,922 |
| Mode M0 | |||
|---|---|---|---|
| Quadrant | BADHDUFLAG | Total packets | Discarded packets |
| A | 0 | 15296 | 2 |
| B | 0 | 16297 | 2 |
| C | 0 | 18173 | 2 |
| D | 0 | 21773 | 3 |
| Mode SS | |||
|---|---|---|---|
| Quadrant | BADHDUFLAG | Total packets | Discarded packets |
| A | 0 | 150 | 0 |
| B | 0 | 150 | 0 |
| C | 0 | 150 | 0 |
| D | 0 | 150 | 0 |
| Mode M9 | |||
|---|---|---|---|
| Quadrant | BADHDUFLAG | Total packets | Discarded packets |
| A | 0 | 6 | 0 |
| B | 0 | 7 | 0 |
| C | 0 | 7 | 0 |
| D | 0 | 7 | 0 |
| Quadrant | Total seconds | Saturated seconds | Saturation percentage |
|---|---|---|---|
| A | 7433 | 15 | 0.201803% |
| B | 7433 | 73 | 0.982107% |
| C | 7433 | 475 | 6.390421% |
| D | 7432 | 417 | 5.610872% |
Noise dominated data is calculated using 1-second bins in cleaned event files. If a bin has >2000 counts, and if more than 50% of those come from <1% of pixels, then it is considered to be noise-dominated and hence unusable.
| Quadrant | # 1 sec bins | Bins with >0 counts | Bins with >2000 counts | High rate bins dominated by noise | Noise dominated (total time) | Noise dominated (detector-on time) | Marked lightcurve |
|---|---|---|---|---|---|---|---|
| A | 7828 | 7434 | 0 | 0 | 0.00% | 0.00% | 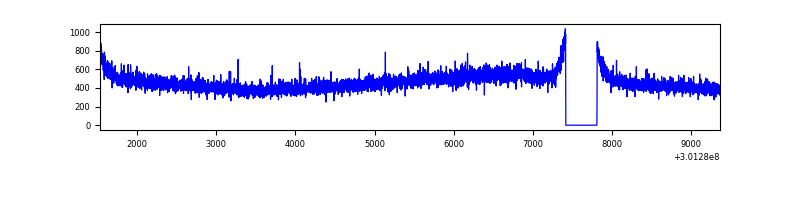 |
| B | 7828 | 7434 | 11 | 11 | 0.14% | 0.15% | 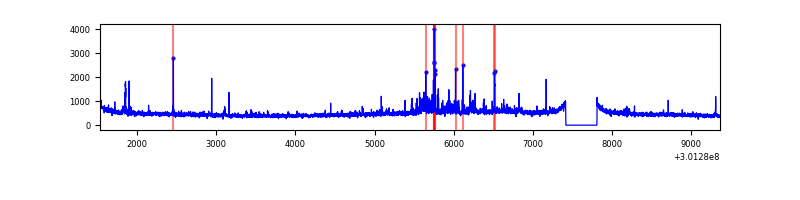 |
| C | 7828 | 7434 | 147 | 147 | 1.88% | 1.98% | 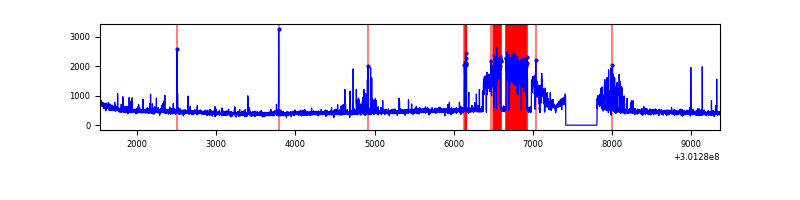 |
| D | 7827 | 7433 | 294 | 294 | 3.76% | 3.96% | 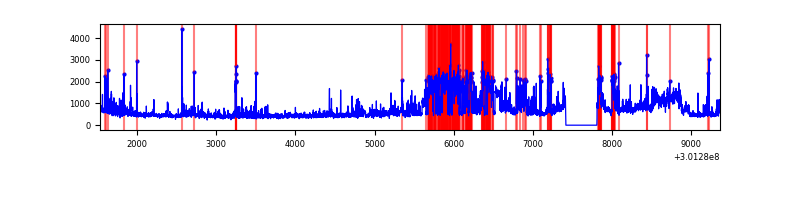 |
Top three noisy pixels from each quadrant. If the there are fewer than three noisy pixels in the level2.evt file, extra rows are filled as -1
| Pixel properties | Quadrant properties | ||||||
|---|---|---|---|---|---|---|---|
| Quadrant | DetID | PixID | Counts | Sigma | Mean | Median | Sigma |
| A | 12 | 16 | 18965 | 101.43 | 883 | 860 | 178.5 |
| A | 8 | 205 | 9761 | 49.87 | 883 | 860 | 178.5 |
| A | 12 | 194 | 9380 | 47.73 | 883 | 860 | 178.5 |
| B | 7 | 220 | 62225 | 360.0 | 886 | 865 | 170.4 |
| B | 0 | 190 | 59445 | 343.69 | 886 | 865 | 170.4 |
| B | 0 | 189 | 57366 | 331.49 | 886 | 865 | 170.4 |
| C | 8 | 208 | 927202 | 4640.14 | 843 | 851 | 199.6 |
| C | 14 | 238 | 129142 | 642.62 | 843 | 851 | 199.6 |
| C | 5 | 112 | 35937 | 175.75 | 843 | 851 | 199.6 |
| D | 7 | 238 | 997309 | 4822.28 | 849 | 827 | 206.6 |
| D | 5 | 222 | 792327 | 3830.31 | 849 | 827 | 206.6 |
| D | 1 | 20 | 379655 | 1833.26 | 849 | 827 | 206.6 |
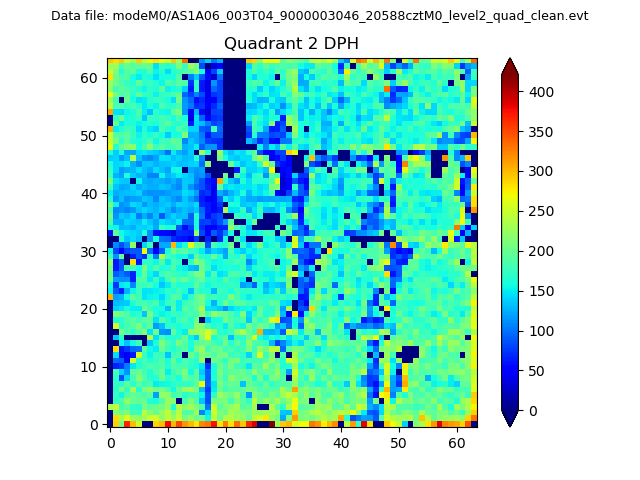
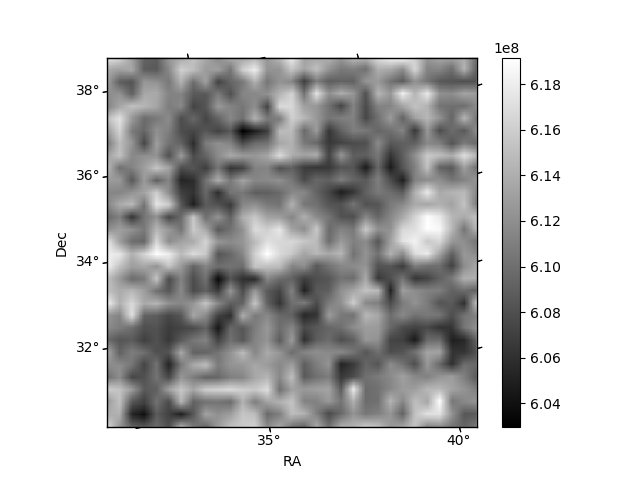
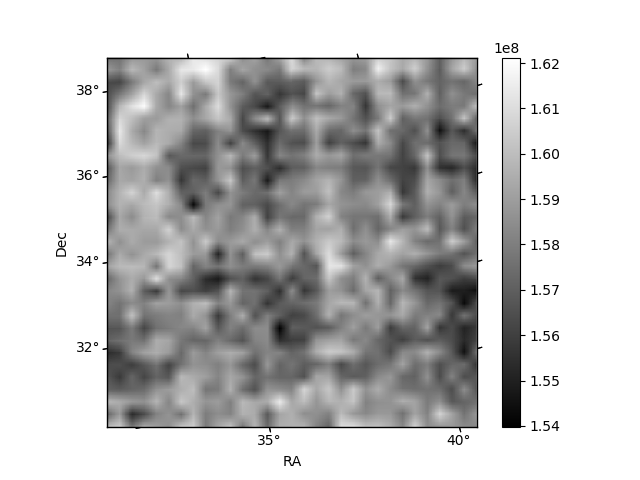
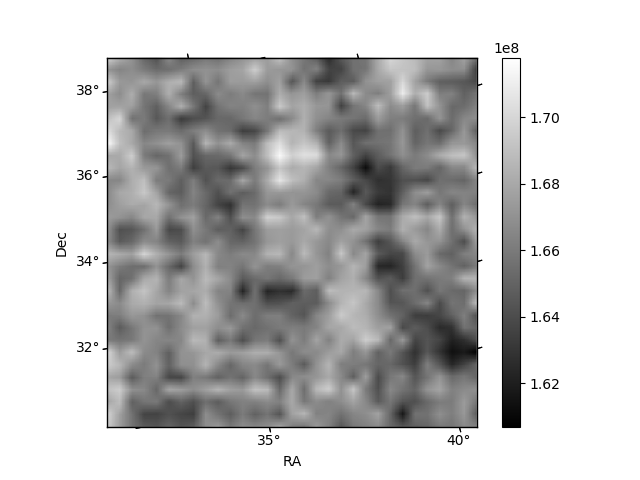
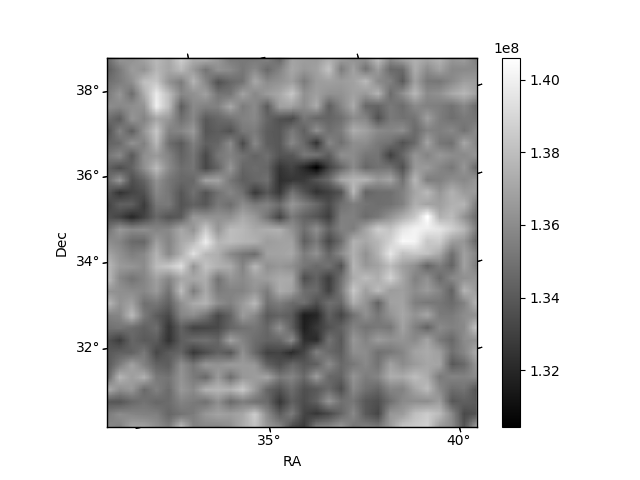
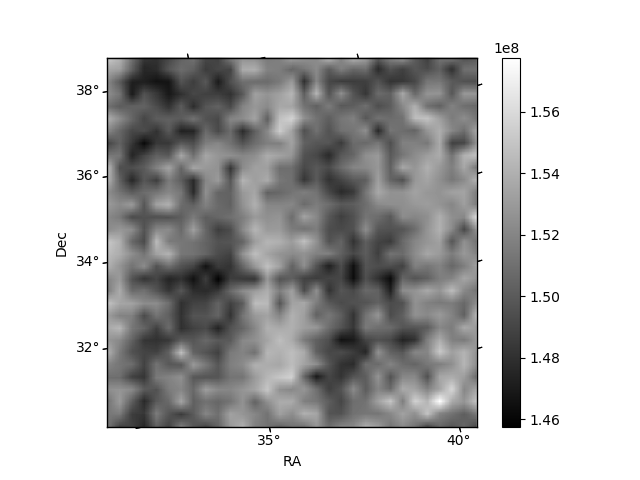
Histogram calculated using DETX and DETY for each event in the final _common_clean file
| Quadrant A | 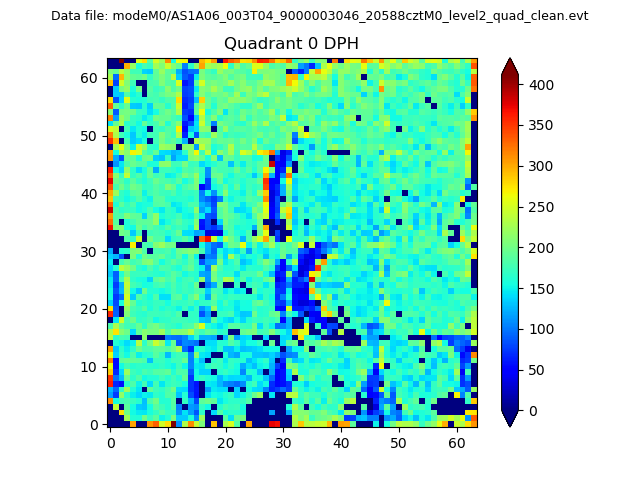 |
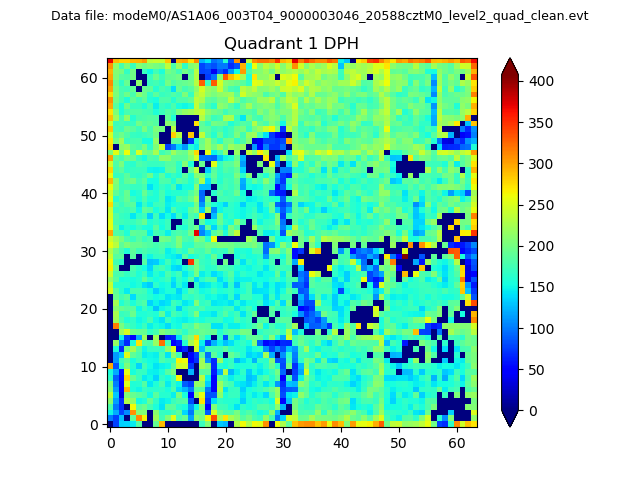 |
Quadrant B |
|---|---|---|---|
| Quadrant D | 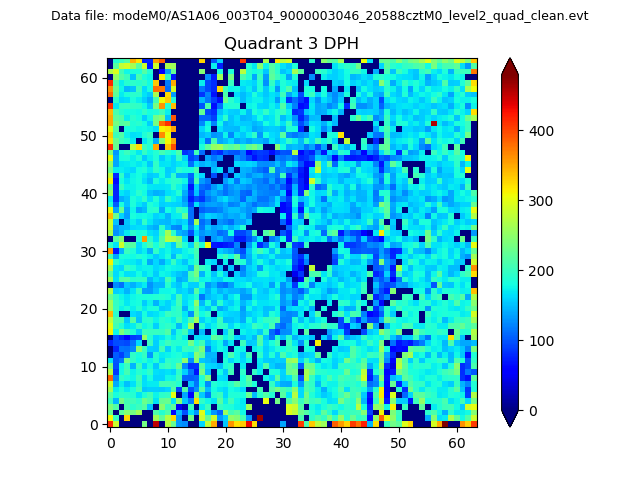 |
 |
Quadrant C |
| Plot type | Count rate plots | Images |
|---|---|---|
| Comparison with Poisson distribution Blue bars denote a histogram of data divided into 1 sec bins. Red curve is a Poisson curve with rate = median count rate of data. |
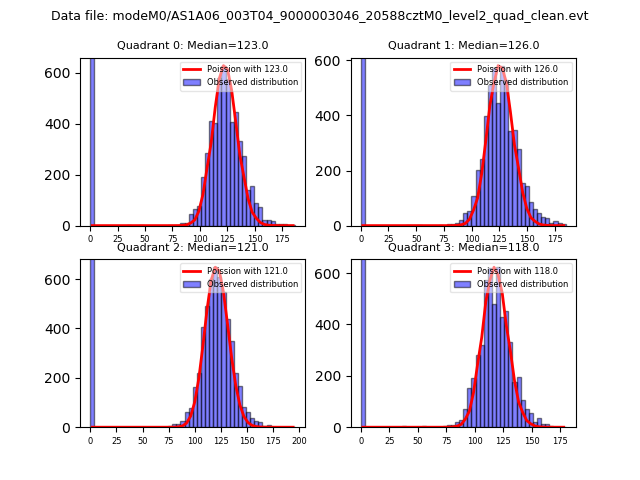 |
 |
| Quadrant-wise count rates Data is divided into 100 sec bins |
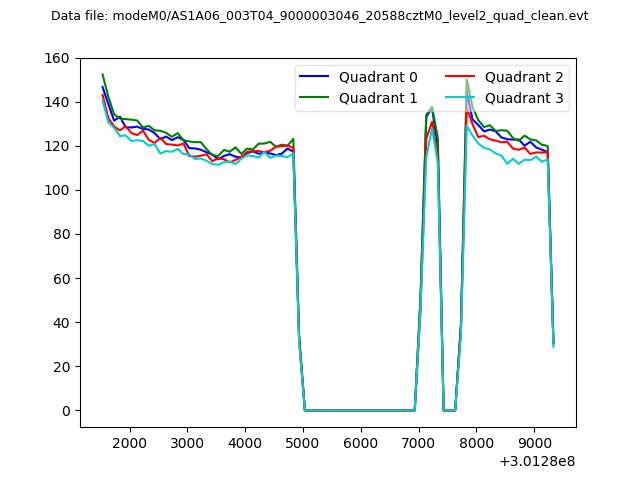 |
|
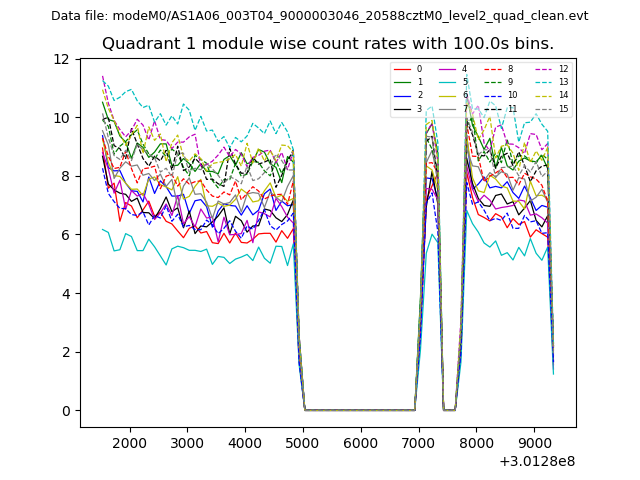
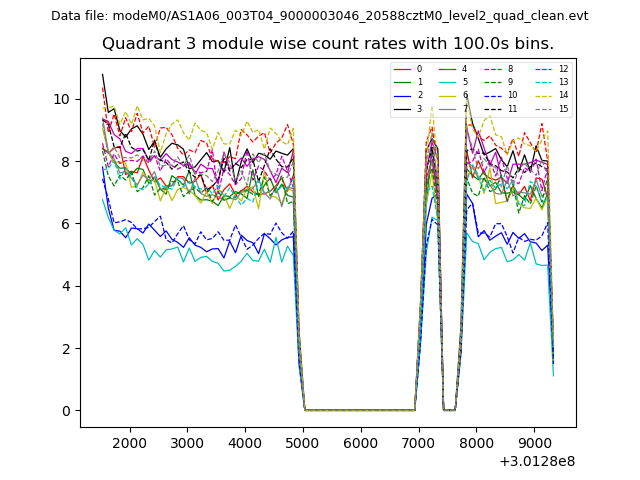
| Module-wise count rates for Quadrant A Data is divided into 100 sec bins |
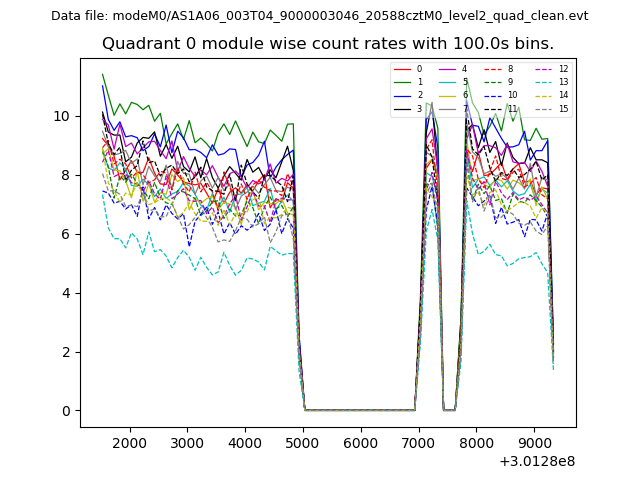 |
 |
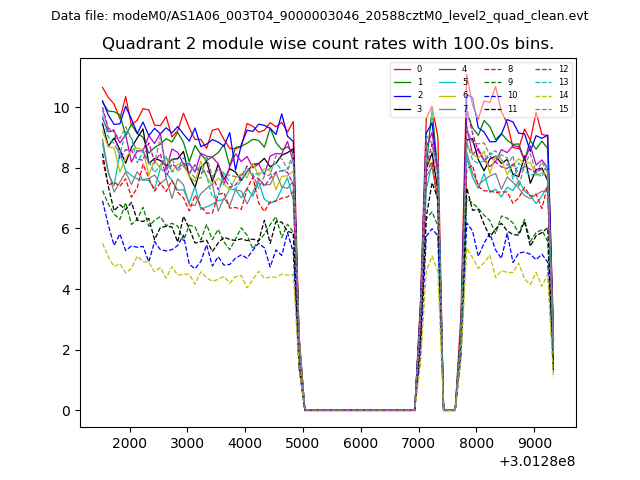
| Module-wise count rates for Quadrant B Data is divided into 100 sec bins |
 |
 |
| Module-wise count rates for Quadrant C Data is divided into 100 sec bins |
 |
 |
| Module-wise count rates for Quadrant D Data is divided into 100 sec bins |
 |
 |
| Parameter | Plot |
|---|---|
| CZT HV Monitor | 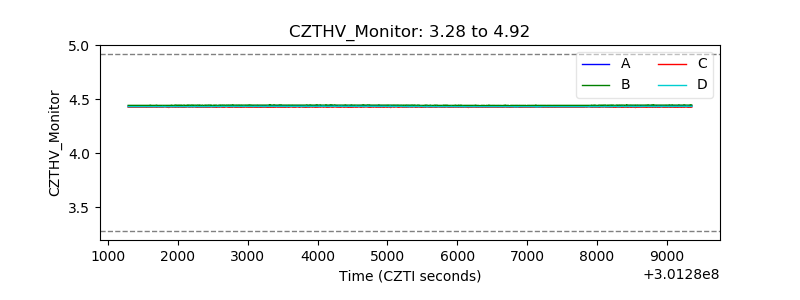 |
| D_VDD | 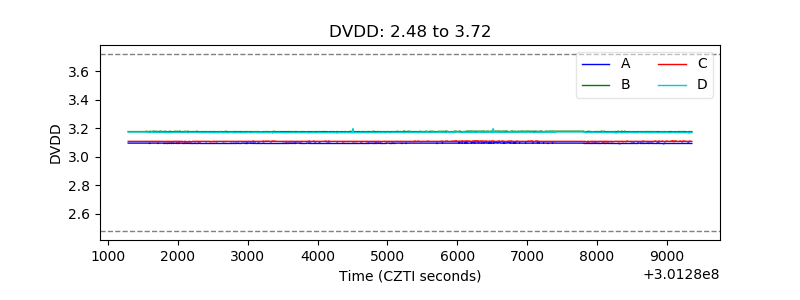 |
| Temperature 1 |  |
| Veto HV Monitor | 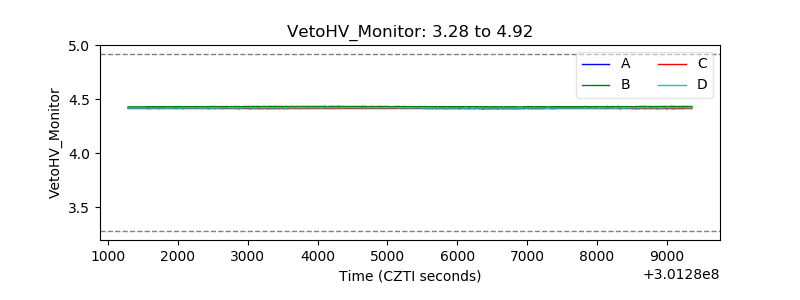 |
| Veto LLD | 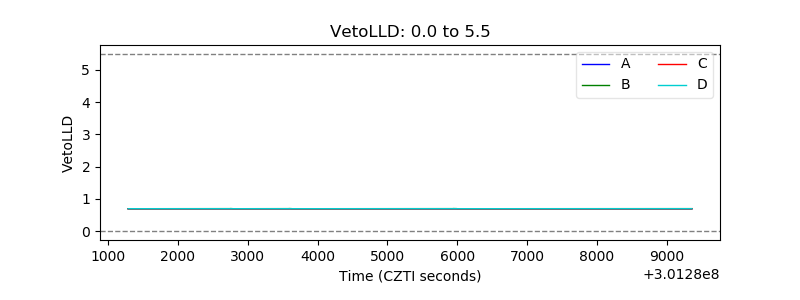 |
| Alpha Counter | 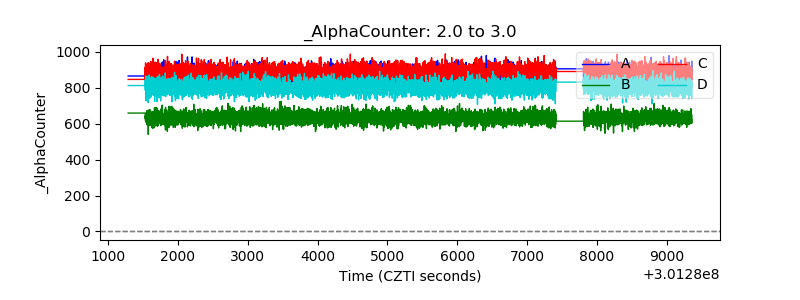 |
| _CPM_Rate | 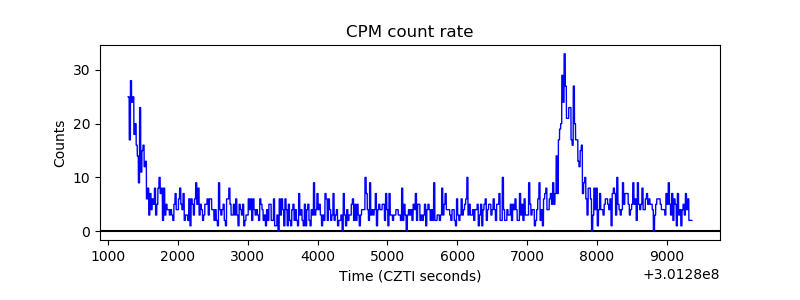 |
| CZT Counter | 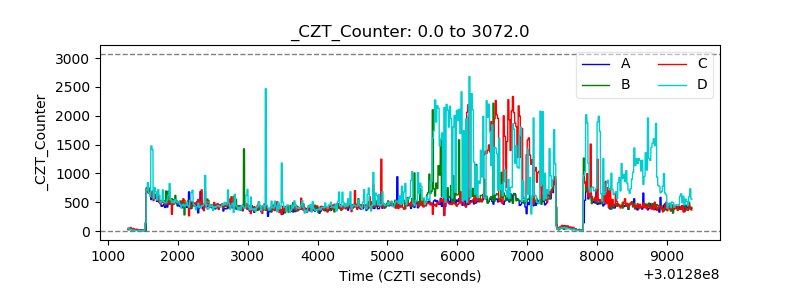 |
| +2.5 Volts monitor |  |
| +5 Volts monitor |  |
| _ROLL_ROT | 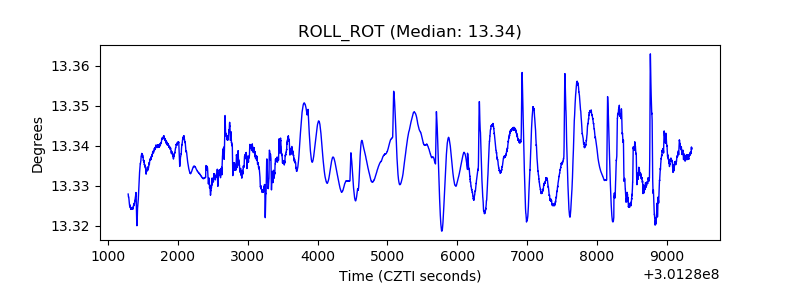 |
| _Roll_DEC | 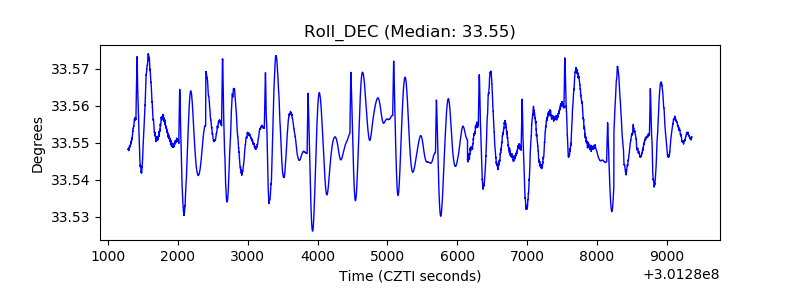 |
| _Roll_RA | 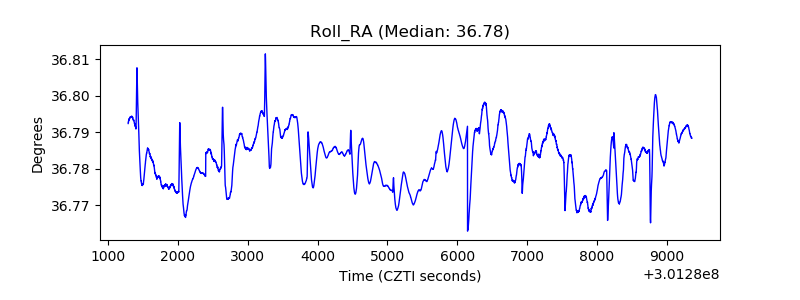 |
| Veto Counter | 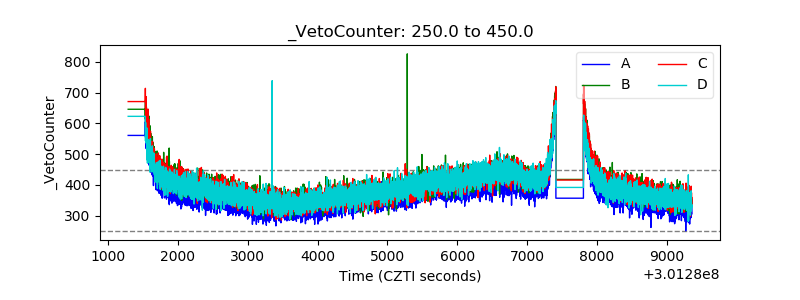 |