| Param | Original file | Final file |
|---|---|---|
| Filename | modeM0/AS1A06_003T04_9000003046_20594cztM0_level2.evt | modeM0/AS1A06_003T04_9000003046_20594cztM0_level2_quad_clean.evt |
| Size (bytes) | 567,106,560 | 83,062,080 |
| Size | 540.8 MB | 79.2 MB |
| Events in quadrant A | 3,289,145 | 522,377 |
| Events in quadrant B | 3,847,717 | 531,248 |
| Events in quadrant C | 3,425,569 | 507,723 |
| Events in quadrant D | 6,158,592 | 486,752 |
| Mode M0 | |||
|---|---|---|---|
| Quadrant | BADHDUFLAG | Total packets | Discarded packets |
| A | 0 | 13833 | 1 |
| B | 0 | 15558 | 1 |
| C | 0 | 14128 | 1 |
| D | 0 | 23016 | 1 |
| Mode SS | |||
|---|---|---|---|
| Quadrant | BADHDUFLAG | Total packets | Discarded packets |
| A | 0 | 138 | 0 |
| B | 0 | 138 | 0 |
| C | 0 | 138 | 0 |
| D | 0 | 138 | 0 |
| Mode M9 | |||
|---|---|---|---|
| Quadrant | BADHDUFLAG | Total packets | Discarded packets |
| A | 0 | 10 | 0 |
| B | 0 | 10 | 0 |
| C | 0 | 10 | 0 |
| D | 0 | 10 | 0 |
| Quadrant | Total seconds | Saturated seconds | Saturation percentage |
|---|---|---|---|
| A | 6692 | 59 | 0.881650% |
| B | 6692 | 114 | 1.703527% |
| C | 6693 | 90 | 1.344688% |
| D | 6693 | 433 | 6.469446% |
Noise dominated data is calculated using 1-second bins in cleaned event files. If a bin has >2000 counts, and if more than 50% of those come from <1% of pixels, then it is considered to be noise-dominated and hence unusable.
| Quadrant | # 1 sec bins | Bins with >0 counts | Bins with >2000 counts | High rate bins dominated by noise | Noise dominated (total time) | Noise dominated (detector-on time) | Marked lightcurve |
|---|---|---|---|---|---|---|---|
| A | 7757 | 6693 | 0 | 0 | 0.00% | 0.00% | 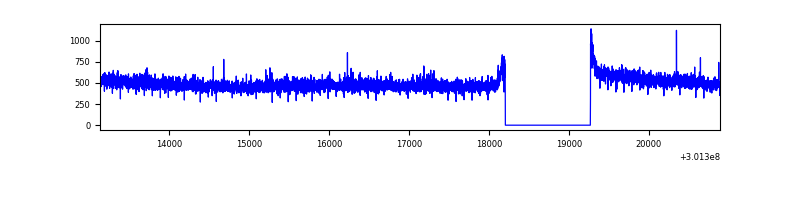 |
| B | 7757 | 6693 | 23 | 23 | 0.30% | 0.34% | 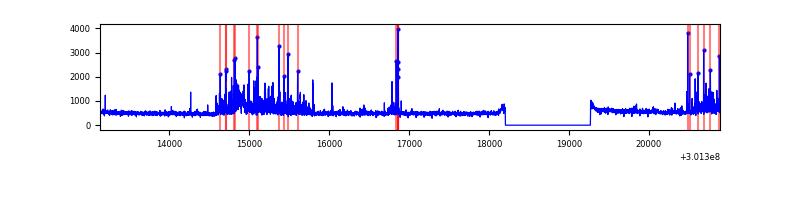 |
| C | 7758 | 6694 | 0 | 0 | 0.00% | 0.00% | 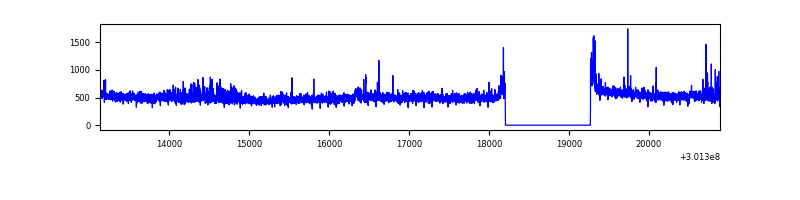 |
| D | 7758 | 6694 | 356 | 356 | 4.59% | 5.32% | 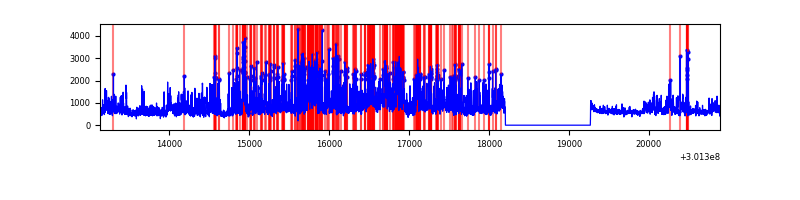 |
Top three noisy pixels from each quadrant. If the there are fewer than three noisy pixels in the level2.evt file, extra rows are filled as -1
| Pixel properties | Quadrant properties | ||||||
|---|---|---|---|---|---|---|---|
| Quadrant | DetID | PixID | Counts | Sigma | Mean | Median | Sigma |
| A | 12 | 16 | 13374 | 73.11 | 850 | 832 | 171.5 |
| A | 12 | 194 | 8052 | 42.09 | 850 | 832 | 171.5 |
| A | 0 | 226 | 7429 | 38.45 | 850 | 832 | 171.5 |
| B | 7 | 220 | 345198 | 2148.78 | 839 | 819 | 160.3 |
| B | 0 | 197 | 66338 | 408.81 | 839 | 819 | 160.3 |
| B | 0 | 190 | 53016 | 325.69 | 839 | 819 | 160.3 |
| C | 8 | 208 | 134425 | 712.13 | 803 | 810 | 187.6 |
| C | 14 | 238 | 127312 | 674.22 | 803 | 810 | 187.6 |
| C | 9 | 54 | 30175 | 156.51 | 803 | 810 | 187.6 |
| D | 5 | 222 | 2614498 | 13338.06 | 809 | 786 | 196.0 |
| D | 1 | 20 | 231505 | 1177.38 | 809 | 786 | 196.0 |
| D | 2 | 165 | 139870 | 709.76 | 809 | 786 | 196.0 |
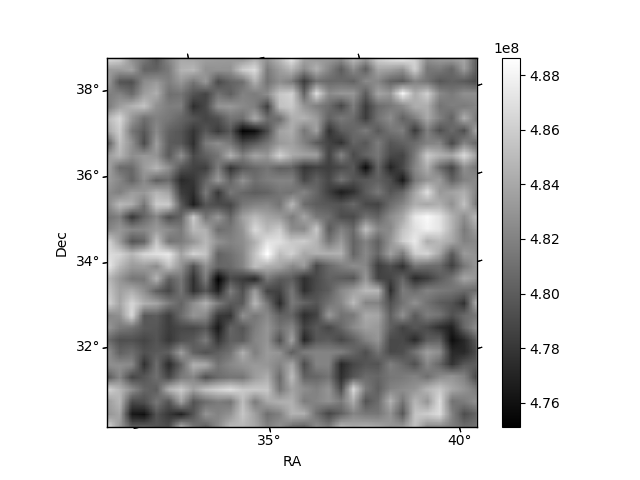
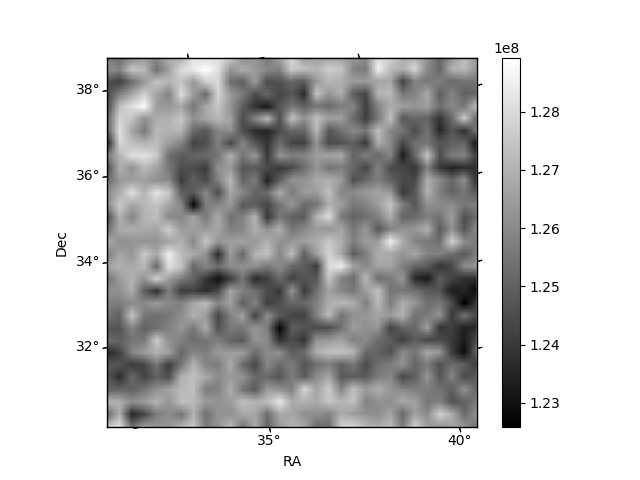
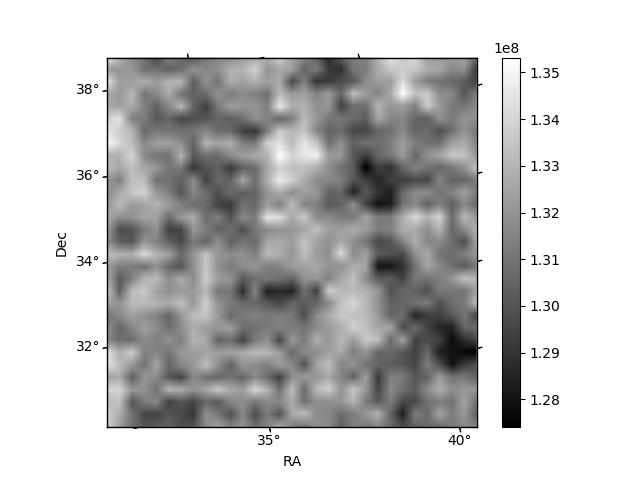
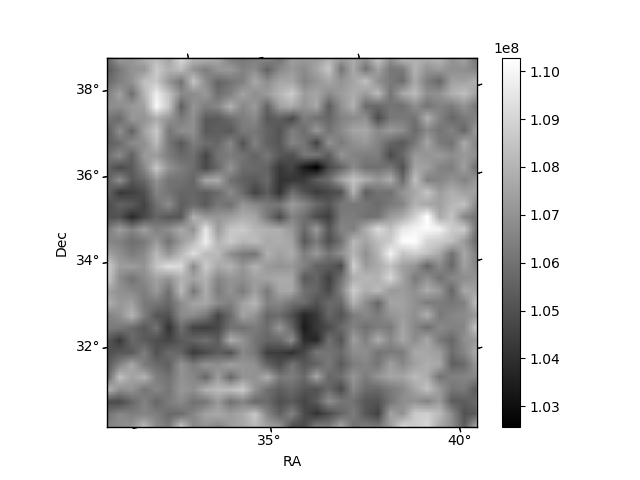
Histogram calculated using DETX and DETY for each event in the final _common_clean file
| Quadrant A | 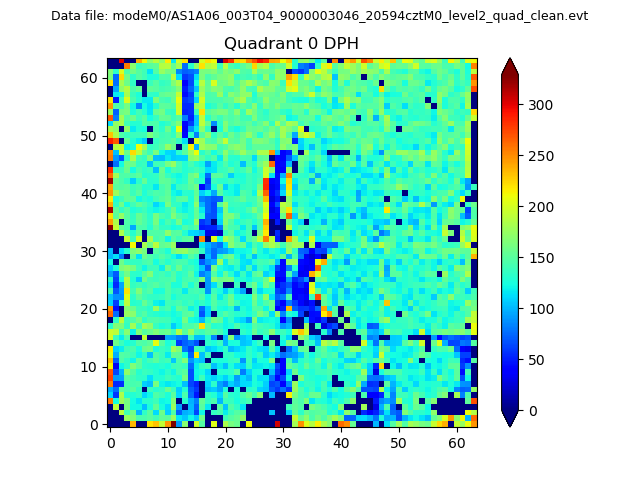 |
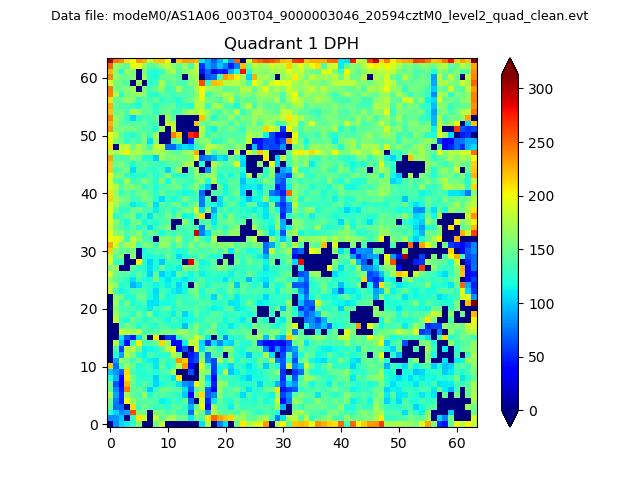 |
Quadrant B |
|---|---|---|---|
| Quadrant D | 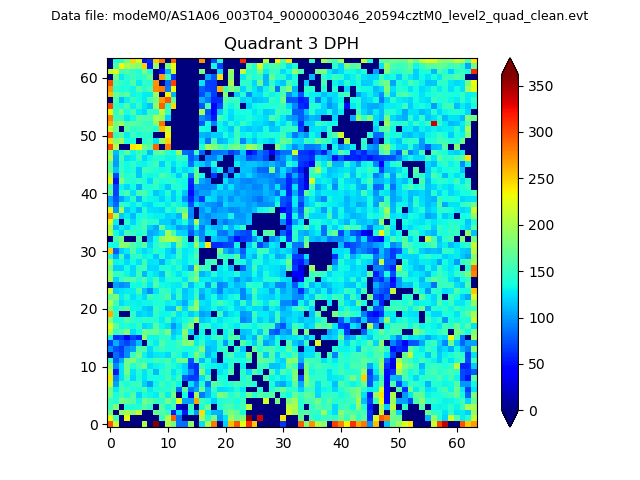 |
 |
Quadrant C |
| Plot type | Count rate plots | Images |
|---|---|---|
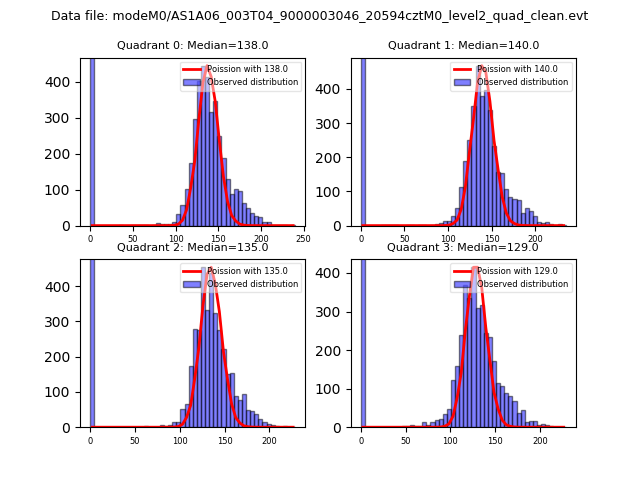
| Comparison with Poisson distribution Blue bars denote a histogram of data divided into 1 sec bins. Red curve is a Poisson curve with rate = median count rate of data. |
 |
 |
| Quadrant-wise count rates Data is divided into 100 sec bins |
 |
|
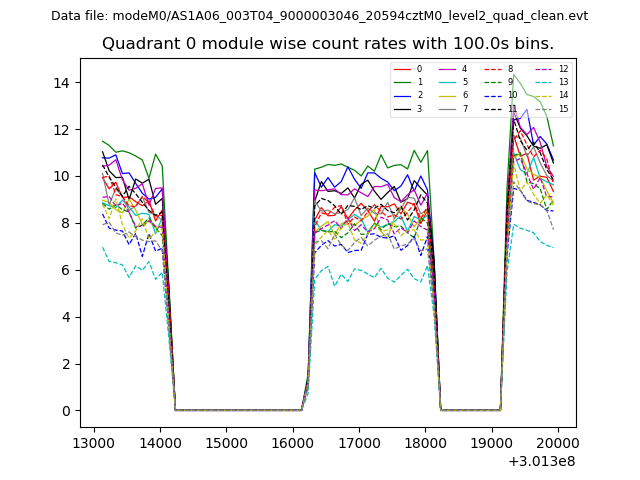
| Module-wise count rates for Quadrant A Data is divided into 100 sec bins |
 |
 |
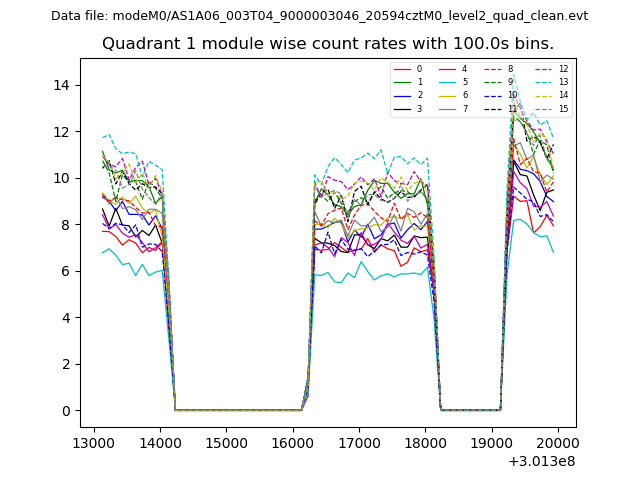
| Module-wise count rates for Quadrant B Data is divided into 100 sec bins |
 |
 |
| Module-wise count rates for Quadrant C Data is divided into 100 sec bins |
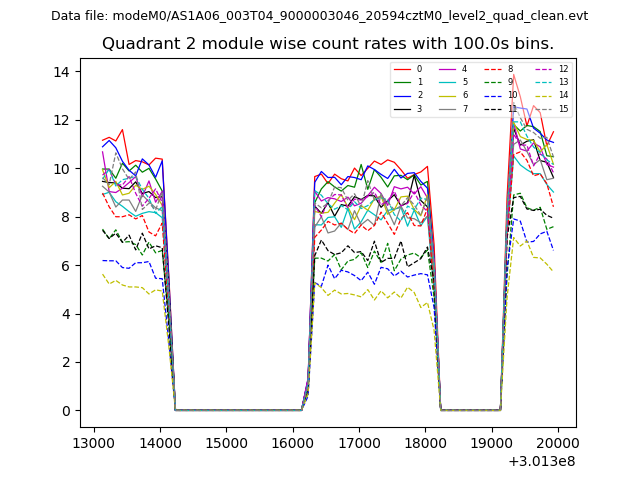 |
 |
| Module-wise count rates for Quadrant D Data is divided into 100 sec bins |
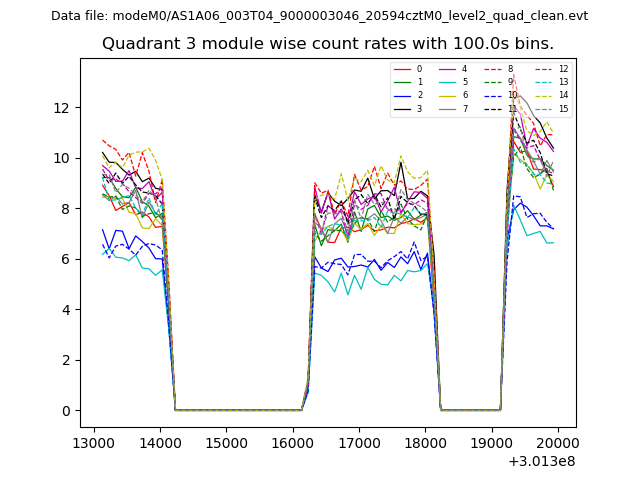 |
 |
| Parameter | Plot |
|---|---|
| CZT HV Monitor | 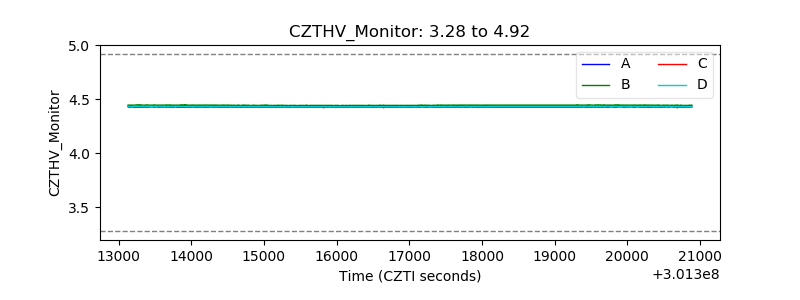 |
| D_VDD |  |
| Temperature 1 | 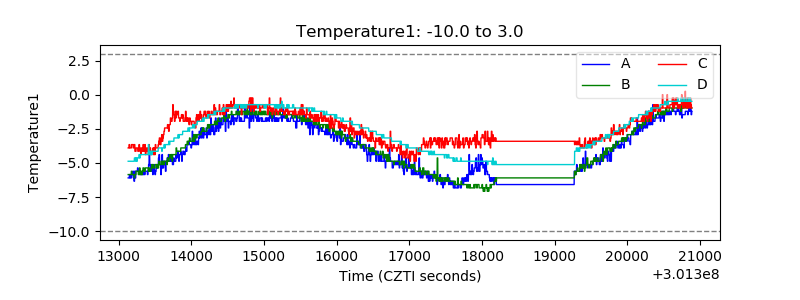 |
| Veto HV Monitor |  |
| Veto LLD | 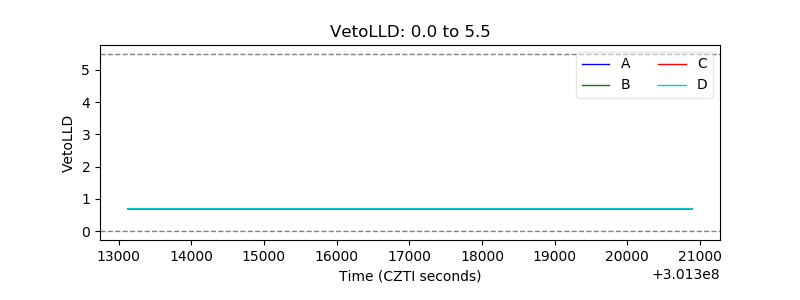 |
| Alpha Counter | 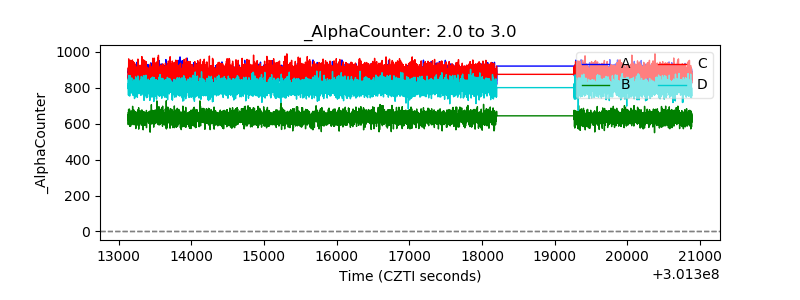 |
| _CPM_Rate |  |
| CZT Counter | 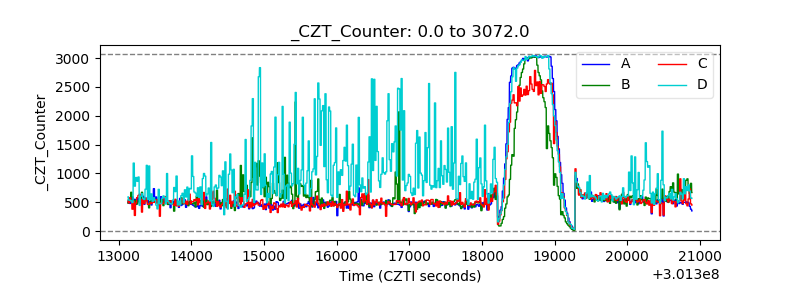 |
| +2.5 Volts monitor |  |
| +5 Volts monitor |  |
| _ROLL_ROT | 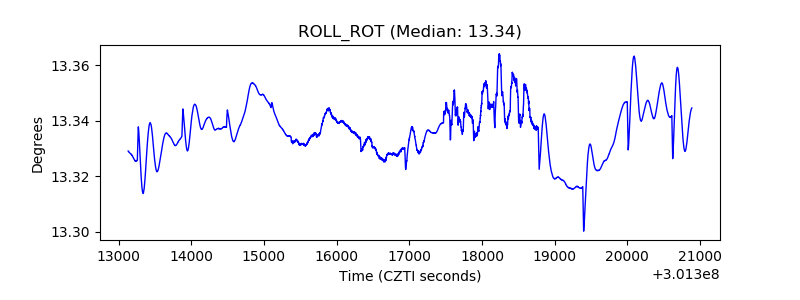 |
| _Roll_DEC | 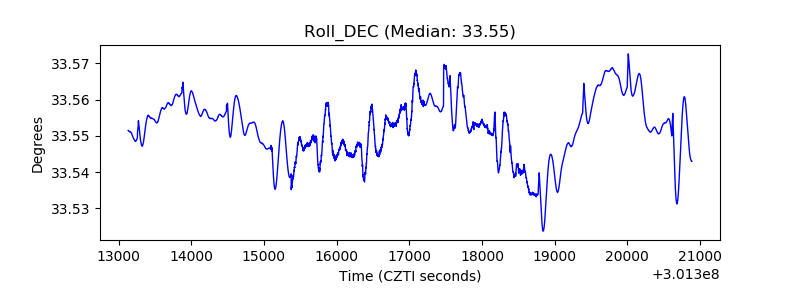 |
| _Roll_RA | 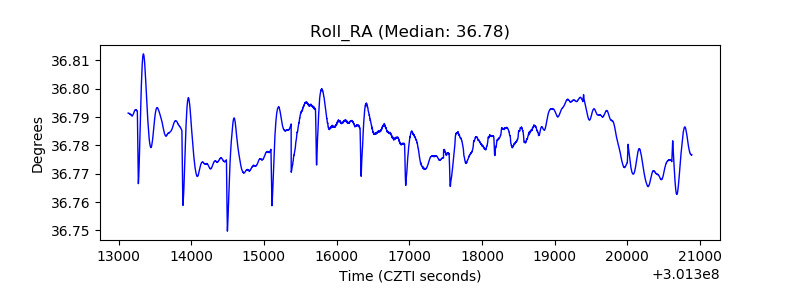 |
| Veto Counter | 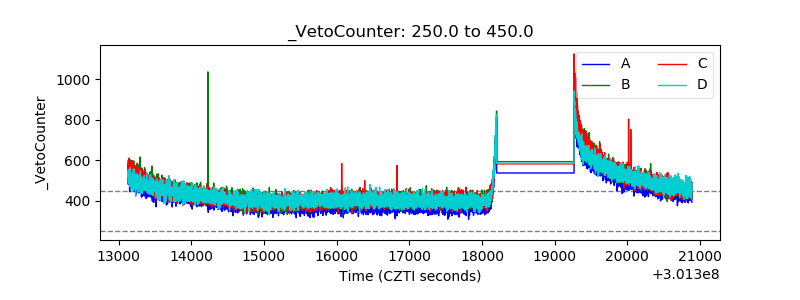 |