| Param | Original file | Final file |
|---|---|---|
| Filename | modeM0/AS1A06_003T04_9000003046_20596cztM0_level2.evt | modeM0/AS1A06_003T04_9000003046_20596cztM0_level2_quad_clean.evt |
| Size (bytes) | 571,726,080 | 63,135,360 |
| Size | 545.2 MB | 60.2 MB |
| Events in quadrant A | 3,405,697 | 376,890 |
| Events in quadrant B | 4,046,005 | 379,154 |
| Events in quadrant C | 3,545,566 | 364,071 |
| Events in quadrant D | 5,893,894 | 354,801 |
| Mode M0 | |||
|---|---|---|---|
| Quadrant | BADHDUFLAG | Total packets | Discarded packets |
| A | 0 | 14151 | 1 |
| B | 0 | 16181 | 1 |
| C | 0 | 14460 | 1 |
| D | 0 | 21888 | 1 |
| Mode SS | |||
|---|---|---|---|
| Quadrant | BADHDUFLAG | Total packets | Discarded packets |
| A | 0 | 128 | 0 |
| B | 0 | 128 | 0 |
| C | 0 | 128 | 0 |
| D | 0 | 128 | 0 |
| Mode M9 | |||
|---|---|---|---|
| Quadrant | BADHDUFLAG | Total packets | Discarded packets |
| A | 0 | 13 | 0 |
| B | 0 | 13 | 0 |
| C | 0 | 13 | 0 |
| D | 0 | 13 | 0 |
| Quadrant | Total seconds | Saturated seconds | Saturation percentage |
|---|---|---|---|
| A | 6250 | 77 | 1.232000% |
| B | 6251 | 183 | 2.927532% |
| C | 6251 | 129 | 2.063670% |
| D | 6251 | 754 | 12.062070% |
Noise dominated data is calculated using 1-second bins in cleaned event files. If a bin has >2000 counts, and if more than 50% of those come from <1% of pixels, then it is considered to be noise-dominated and hence unusable.
| Quadrant | # 1 sec bins | Bins with >0 counts | Bins with >2000 counts | High rate bins dominated by noise | Noise dominated (total time) | Noise dominated (detector-on time) | Marked lightcurve |
|---|---|---|---|---|---|---|---|
| A | 7535 | 6251 | 0 | 0 | 0.00% | 0.00% | 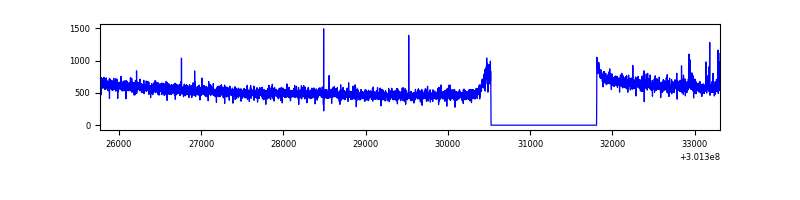 |
| B | 7536 | 6252 | 42 | 42 | 0.56% | 0.67% | 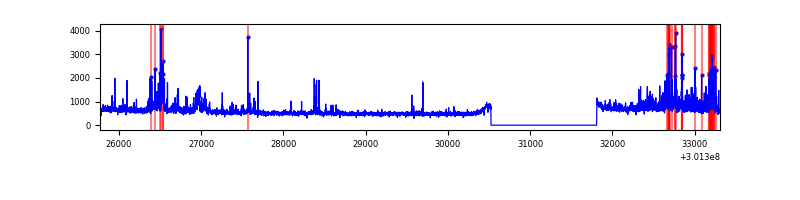 |
| C | 7536 | 6252 | 12 | 12 | 0.16% | 0.19% | 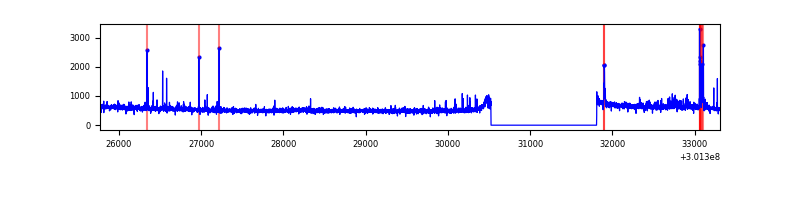 |
| D | 7536 | 6252 | 603 | 603 | 8.00% | 9.64% | 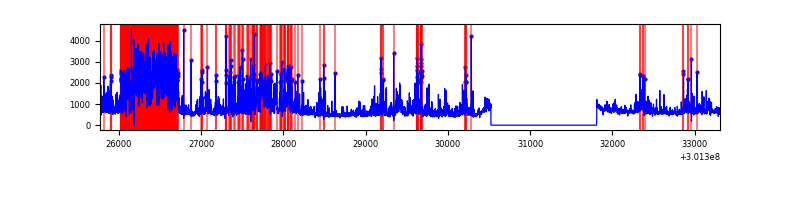 |
Top three noisy pixels from each quadrant. If the there are fewer than three noisy pixels in the level2.evt file, extra rows are filled as -1
| Pixel properties | Quadrant properties | ||||||
|---|---|---|---|---|---|---|---|
| Quadrant | DetID | PixID | Counts | Sigma | Mean | Median | Sigma |
| A | 12 | 16 | 37609 | 213.32 | 872 | 858 | 172.3 |
| A | 12 | 194 | 12545 | 67.84 | 872 | 858 | 172.3 |
| A | 0 | 226 | 7719 | 39.83 | 872 | 858 | 172.3 |
| B | 7 | 220 | 364408 | 2286.75 | 859 | 841 | 159.0 |
| B | 0 | 189 | 109645 | 684.35 | 859 | 841 | 159.0 |
| B | 0 | 197 | 96671 | 602.75 | 859 | 841 | 159.0 |
| C | 14 | 238 | 132255 | 690.97 | 830 | 838 | 190.2 |
| C | 8 | 208 | 93719 | 488.36 | 830 | 838 | 190.2 |
| C | 0 | 207 | 58074 | 300.94 | 830 | 838 | 190.2 |
| D | 5 | 222 | 1180359 | 5997.85 | 814 | 792 | 196.7 |
| D | 1 | 20 | 1054085 | 5355.77 | 814 | 792 | 196.7 |
| D | 7 | 38 | 218442 | 1106.7 | 814 | 792 | 196.7 |
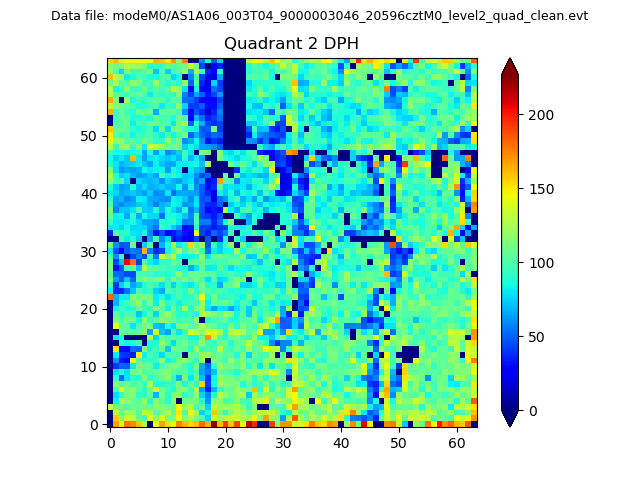
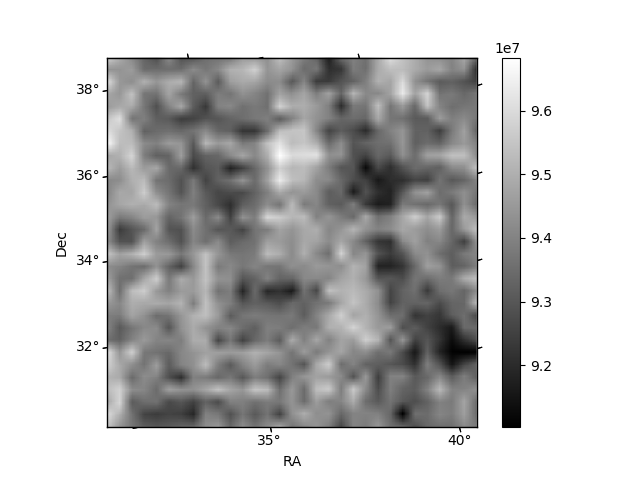
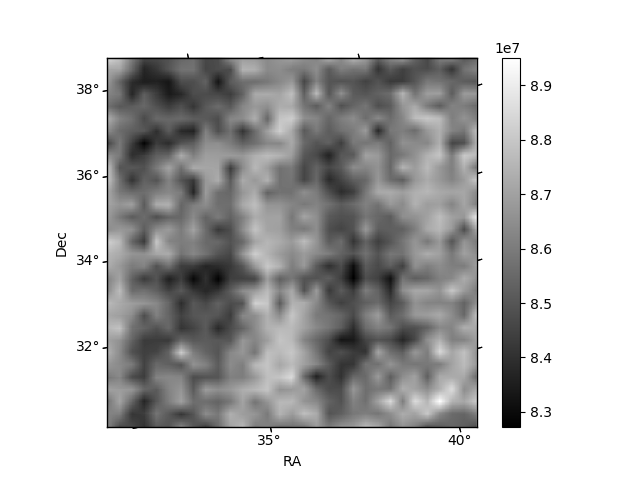
Histogram calculated using DETX and DETY for each event in the final _common_clean file
| Quadrant A | 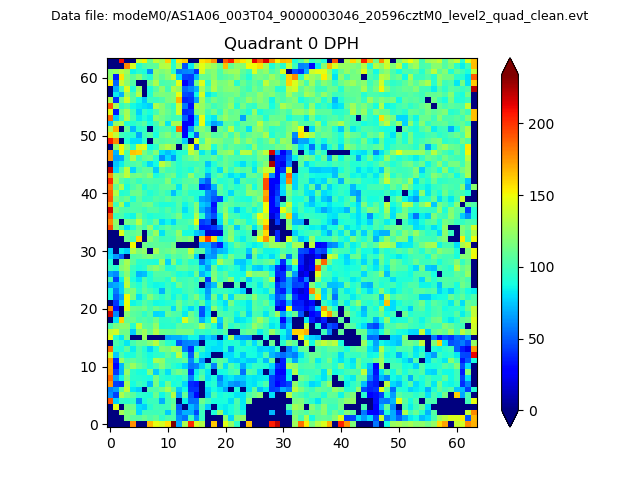 |
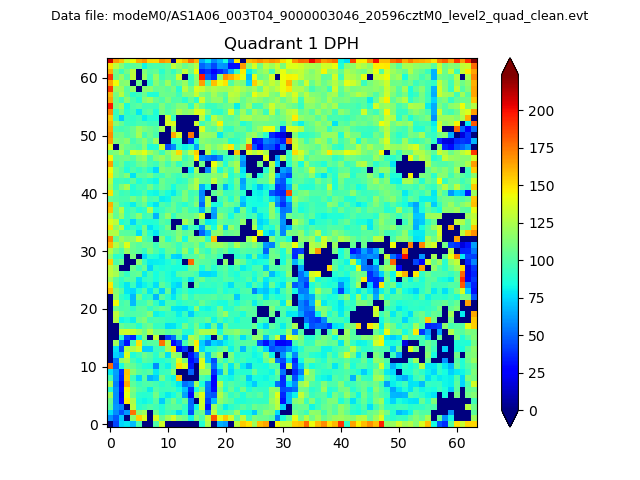 |
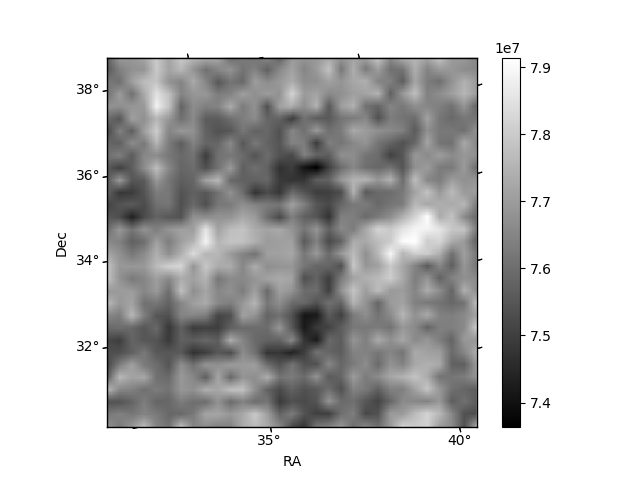
Quadrant B |
|---|---|---|---|
| Quadrant D | 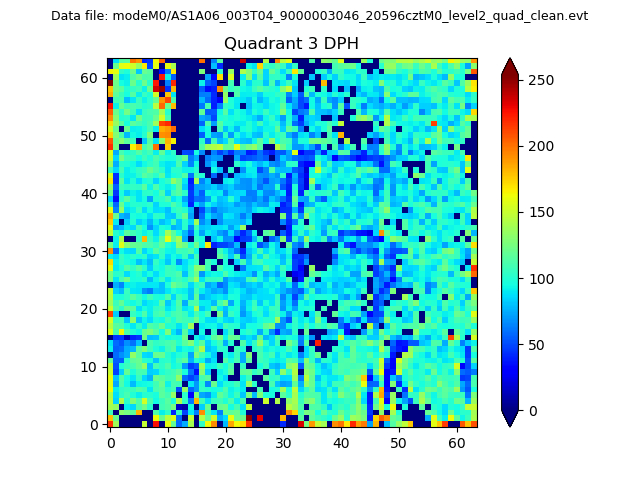 |
 |
Quadrant C |
| Plot type | Count rate plots | Images |
|---|---|---|
| Comparison with Poisson distribution Blue bars denote a histogram of data divided into 1 sec bins. Red curve is a Poisson curve with rate = median count rate of data. |
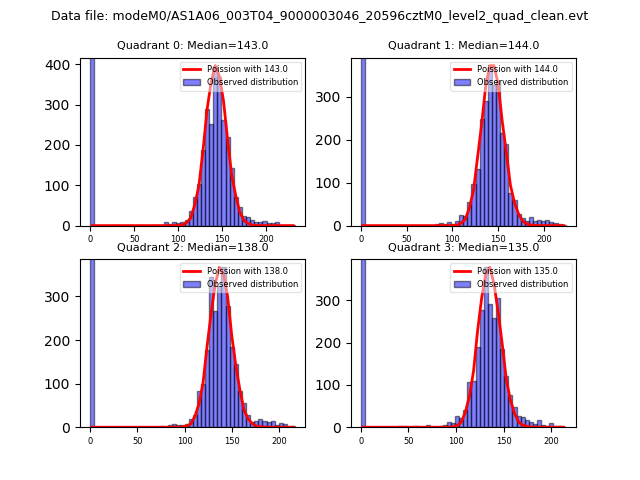 |
 |
| Quadrant-wise count rates Data is divided into 100 sec bins |
 |
|
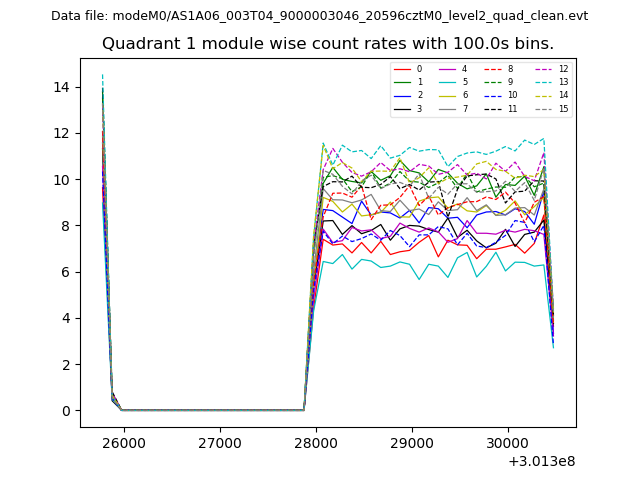
| Module-wise count rates for Quadrant A Data is divided into 100 sec bins |
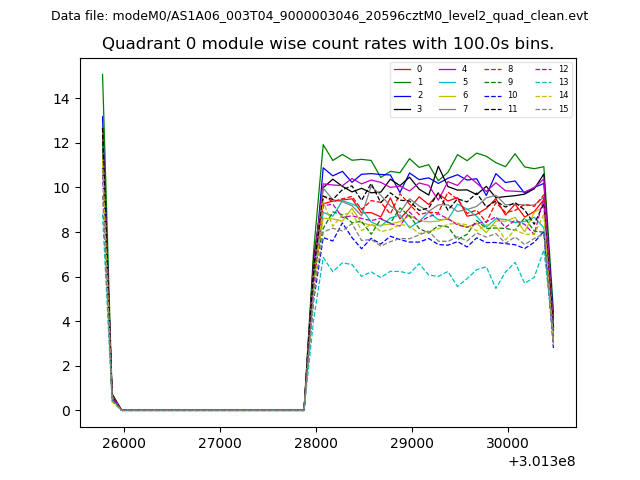 |
 |
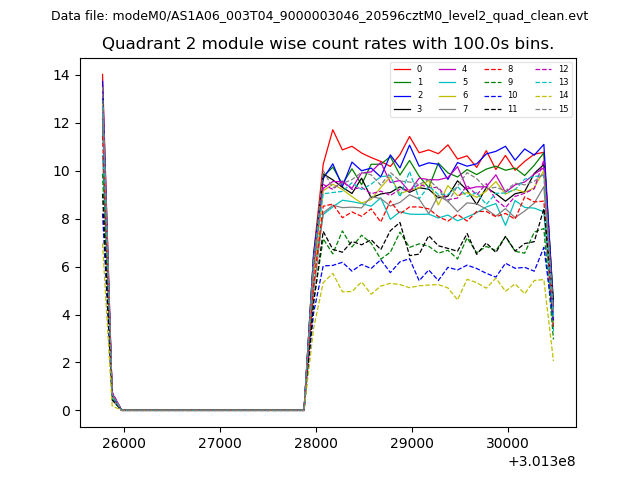
| Module-wise count rates for Quadrant B Data is divided into 100 sec bins |
 |
 |
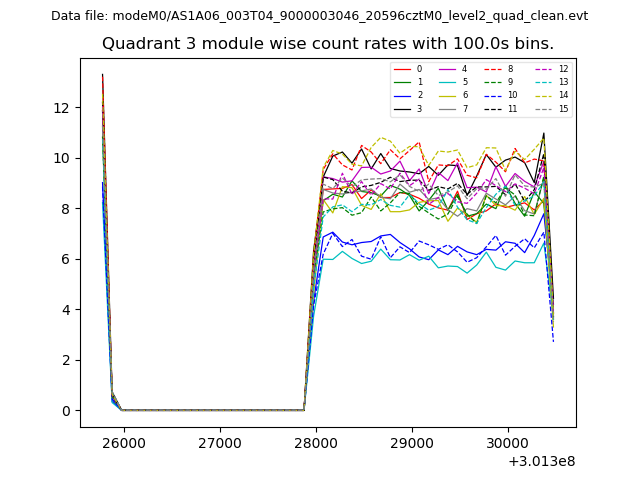
| Module-wise count rates for Quadrant C Data is divided into 100 sec bins |
 |
 |
| Module-wise count rates for Quadrant D Data is divided into 100 sec bins |
 |
 |
| Parameter | Plot |
|---|---|
| CZT HV Monitor | 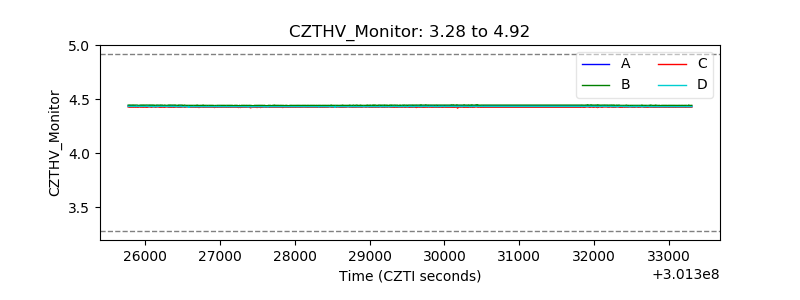 |
| D_VDD | 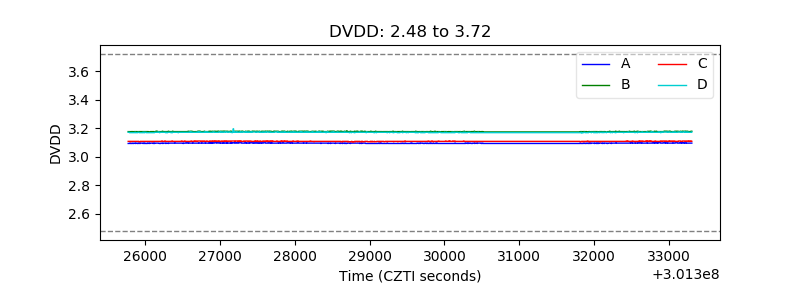 |
| Temperature 1 |  |
| Veto HV Monitor | 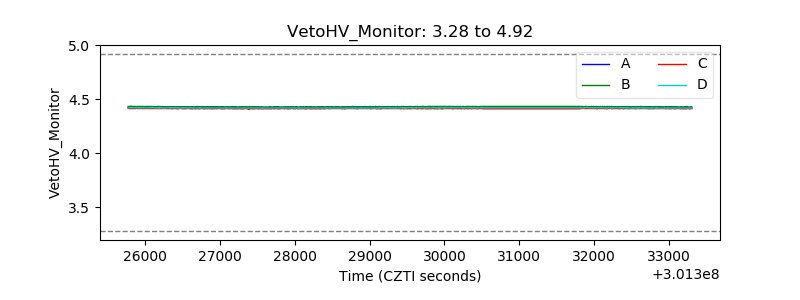 |
| Veto LLD | 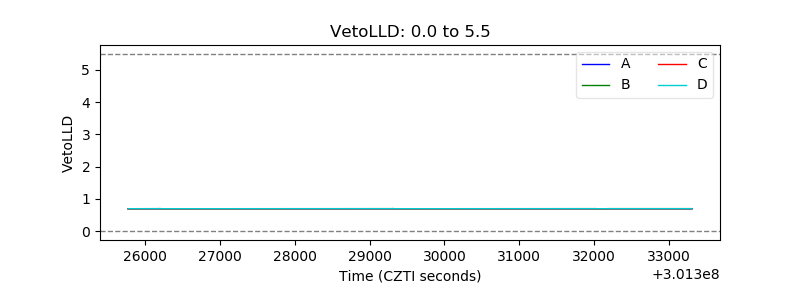 |
| Alpha Counter | 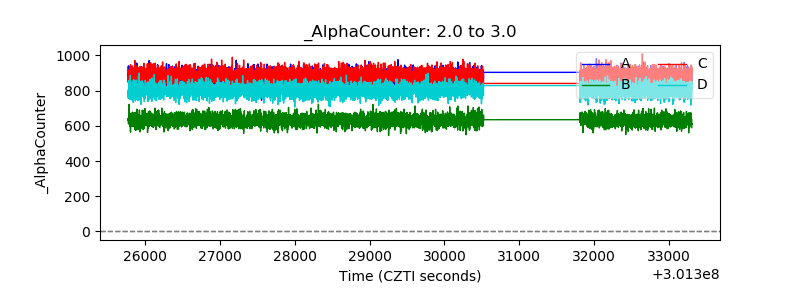 |
| _CPM_Rate | 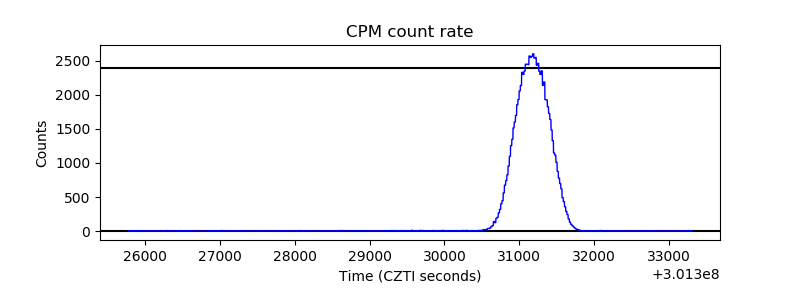 |
| CZT Counter | 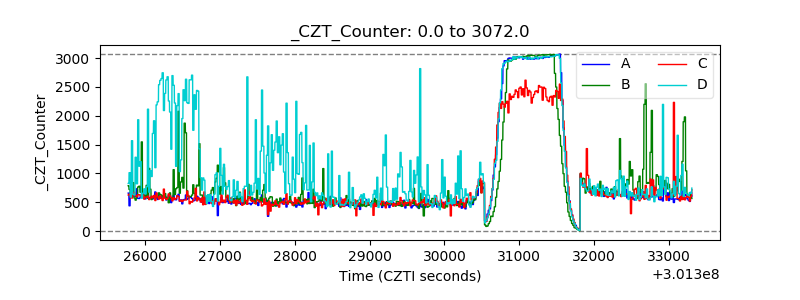 |
| +2.5 Volts monitor |  |
| +5 Volts monitor |  |
| _ROLL_ROT | 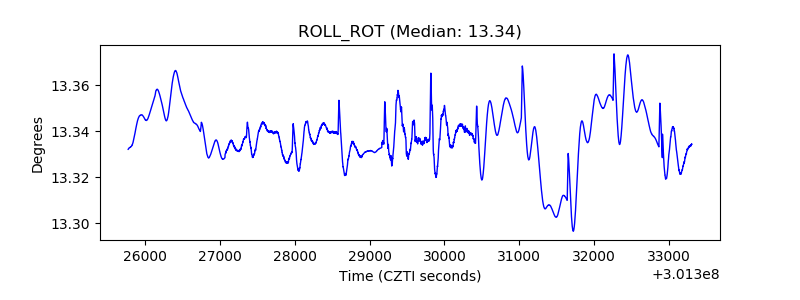 |
| _Roll_DEC | 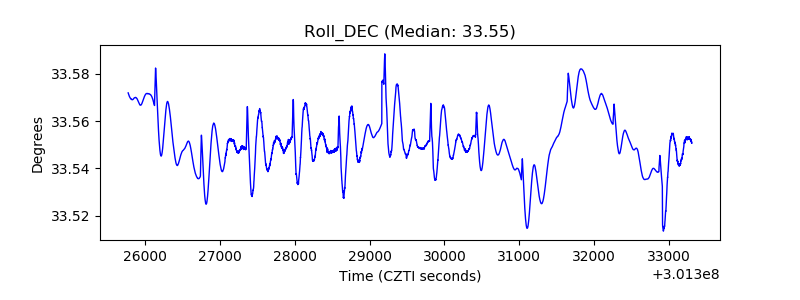 |
| _Roll_RA | 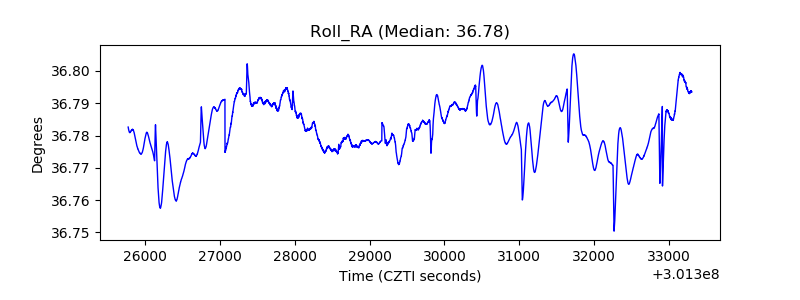 |
| Veto Counter | 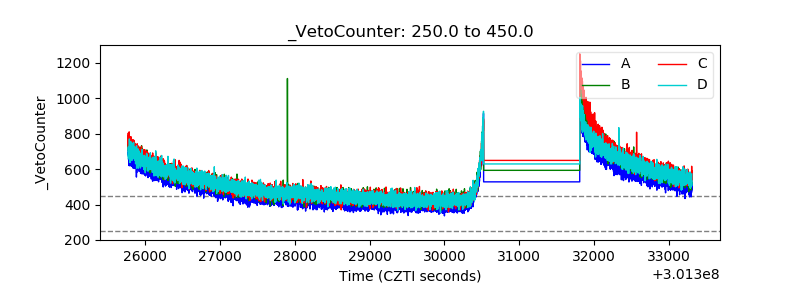 |