| Param | Original file | Final file |
|---|---|---|
| Filename | modeM0/AS1A06_003T04_9000003046_20598cztM0_level2.evt | modeM0/AS1A06_003T04_9000003046_20598cztM0_level2_quad_clean.evt |
| Size (bytes) | 571,668,480 | 76,668,480 |
| Size | 545.2 MB | 73.1 MB |
| Events in quadrant A | 3,436,487 | 485,010 |
| Events in quadrant B | 3,790,734 | 492,367 |
| Events in quadrant C | 3,590,859 | 474,794 |
| Events in quadrant D | 6,073,819 | 434,806 |
| Mode M0 | |||
|---|---|---|---|
| Quadrant | BADHDUFLAG | Total packets | Discarded packets |
| A | 0 | 14331 | 2 |
| B | 0 | 15212 | 2 |
| C | 0 | 14733 | 2 |
| D | 0 | 22305 | 2 |
| Mode SS | |||
|---|---|---|---|
| Quadrant | BADHDUFLAG | Total packets | Discarded packets |
| A | 0 | 128 | 0 |
| B | 0 | 128 | 0 |
| C | 0 | 128 | 0 |
| D | 0 | 128 | 0 |
| Mode M9 | |||
|---|---|---|---|
| Quadrant | BADHDUFLAG | Total packets | Discarded packets |
| A | 0 | 18 | 0 |
| B | 0 | 19 | 0 |
| C | 0 | 19 | 0 |
| D | 0 | 19 | 0 |
| Quadrant | Total seconds | Saturated seconds | Saturation percentage |
|---|---|---|---|
| A | 6223 | 107 | 1.719428% |
| B | 6223 | 181 | 2.908565% |
| C | 6223 | 171 | 2.747871% |
| D | 6223 | 644 | 10.348706% |
Noise dominated data is calculated using 1-second bins in cleaned event files. If a bin has >2000 counts, and if more than 50% of those come from <1% of pixels, then it is considered to be noise-dominated and hence unusable.
| Quadrant | # 1 sec bins | Bins with >0 counts | Bins with >2000 counts | High rate bins dominated by noise | Noise dominated (total time) | Noise dominated (detector-on time) | Marked lightcurve |
|---|---|---|---|---|---|---|---|
| A | 7533 | 6225 | 1 | 1 | 0.01% | 0.02% | 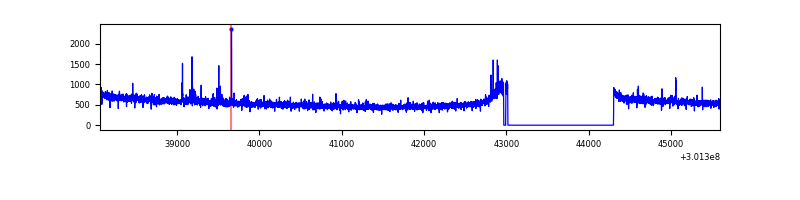 |
| B | 7533 | 6225 | 21 | 21 | 0.28% | 0.34% | 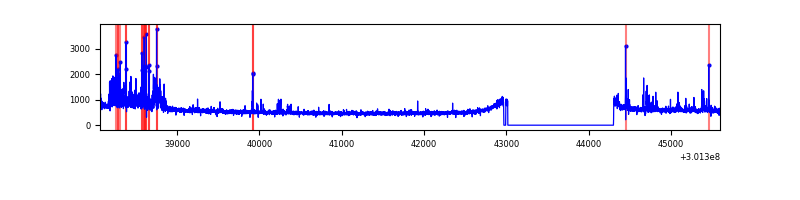 |
| C | 7533 | 6225 | 0 | 0 | 0.00% | 0.00% | 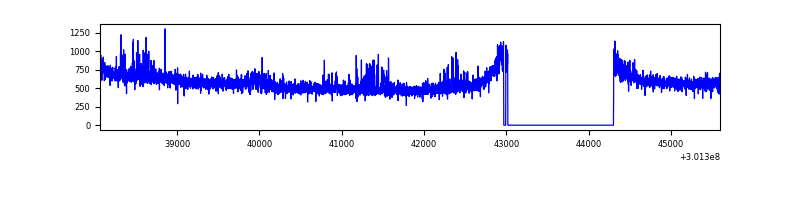 |
| D | 7533 | 6225 | 487 | 487 | 6.46% | 7.82% | 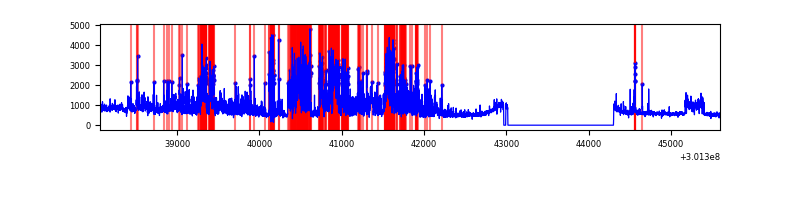 |
Top three noisy pixels from each quadrant. If the there are fewer than three noisy pixels in the level2.evt file, extra rows are filled as -1
| Pixel properties | Quadrant properties | ||||||
|---|---|---|---|---|---|---|---|
| Quadrant | DetID | PixID | Counts | Sigma | Mean | Median | Sigma |
| A | 12 | 16 | 48148 | 274.83 | 869 | 855 | 172.1 |
| A | 5 | 16 | 32470 | 183.72 | 869 | 855 | 172.1 |
| A | 12 | 194 | 14408 | 78.76 | 869 | 855 | 172.1 |
| B | 7 | 220 | 198024 | 1222.45 | 863 | 844 | 161.3 |
| B | 0 | 197 | 73085 | 447.87 | 863 | 844 | 161.3 |
| B | 0 | 190 | 68626 | 420.23 | 863 | 844 | 161.3 |
| C | 8 | 208 | 178167 | 912.0 | 840 | 849 | 194.4 |
| C | 14 | 238 | 132596 | 677.62 | 840 | 849 | 194.4 |
| C | 13 | 61 | 5971 | 26.34 | 840 | 849 | 194.4 |
| D | 5 | 222 | 2205088 | 10858.06 | 834 | 809 | 203.0 |
| D | 1 | 20 | 522419 | 2569.4 | 834 | 809 | 203.0 |
| D | 2 | 165 | 95949 | 468.65 | 834 | 809 | 203.0 |
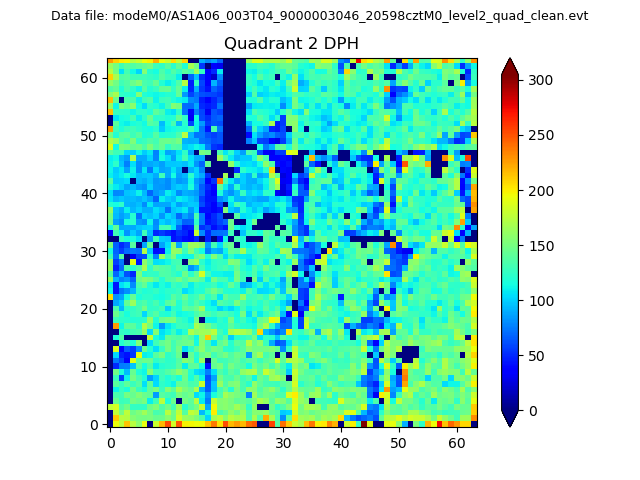
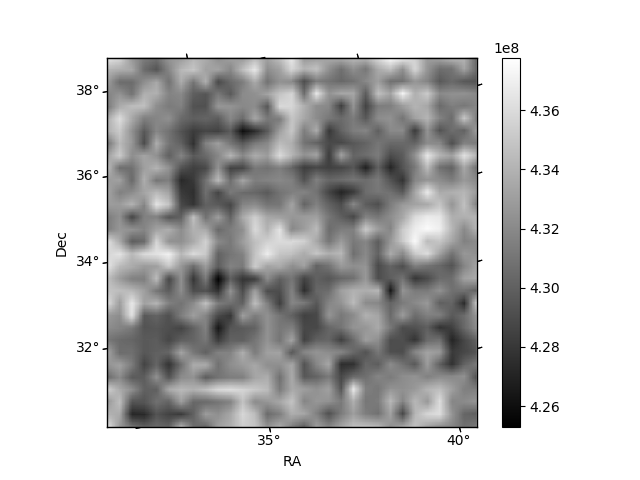
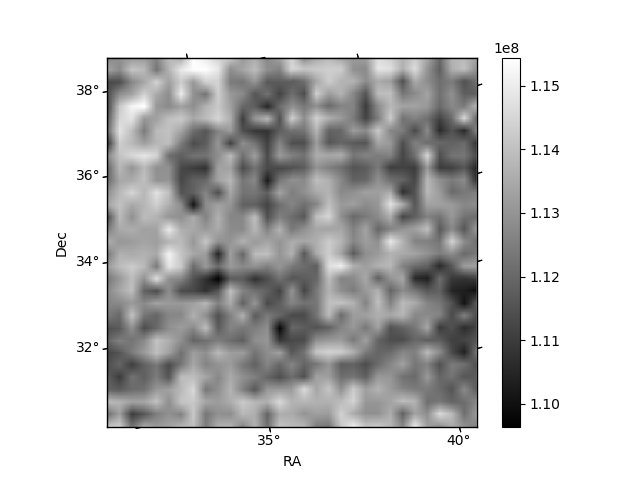
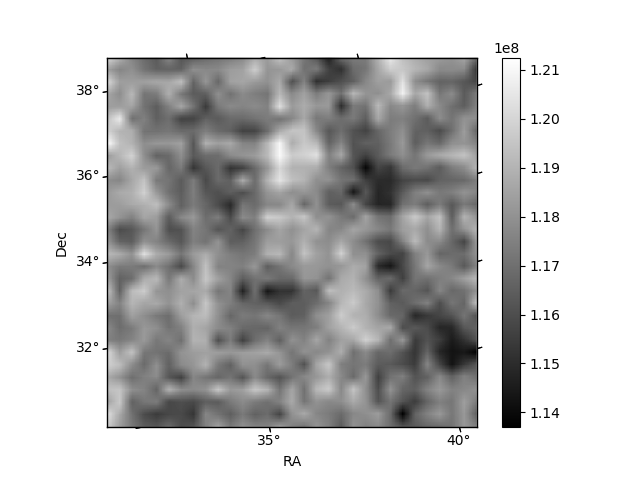
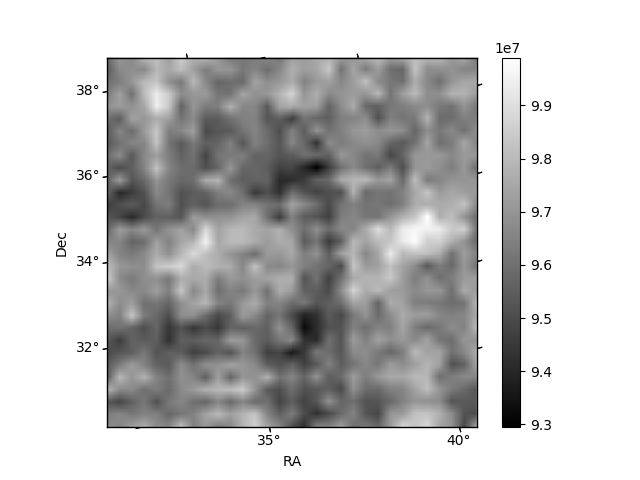
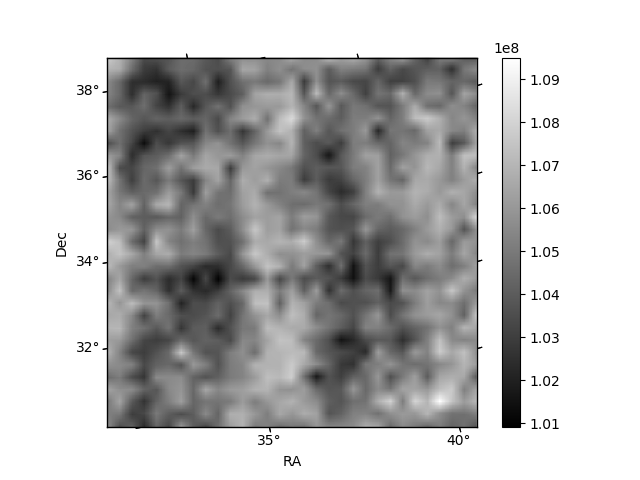
Histogram calculated using DETX and DETY for each event in the final _common_clean file
| Quadrant A | 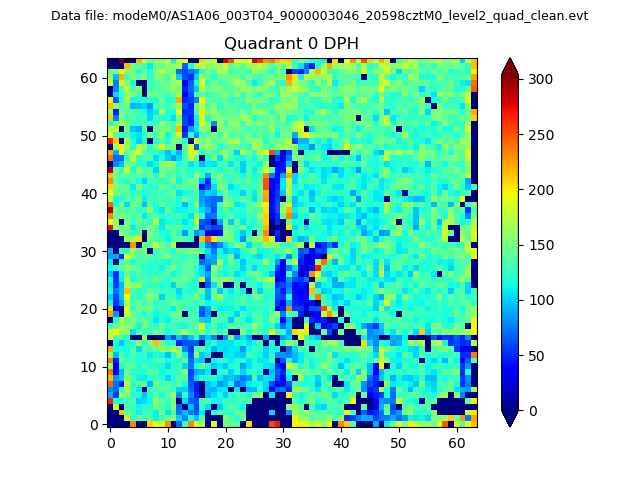 |
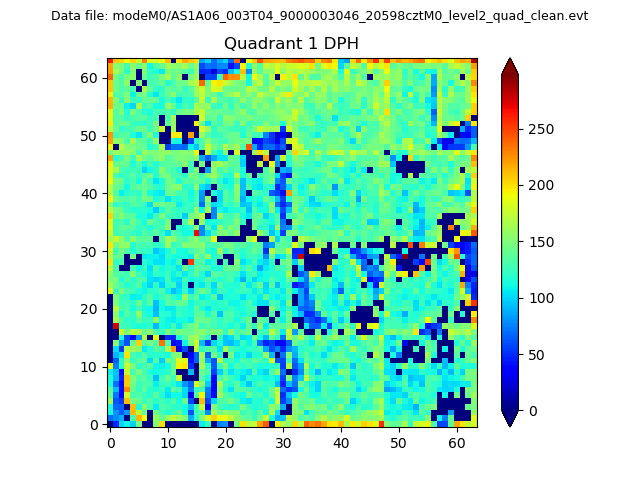 |
Quadrant B |
|---|---|---|---|
| Quadrant D | 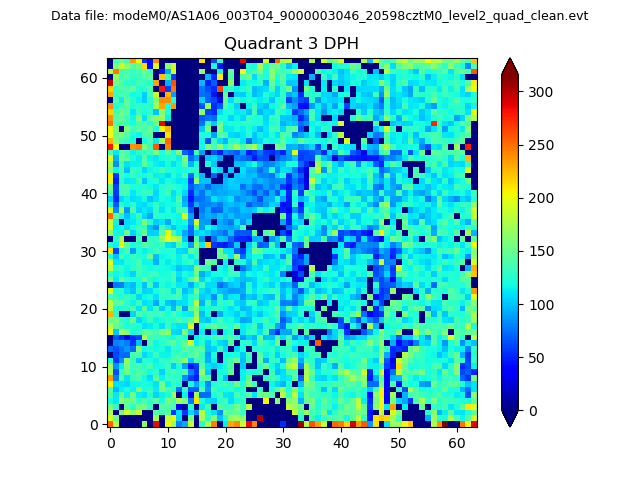 |
 |
Quadrant C |
| Plot type | Count rate plots | Images |
|---|---|---|
| Comparison with Poisson distribution Blue bars denote a histogram of data divided into 1 sec bins. Red curve is a Poisson curve with rate = median count rate of data. |
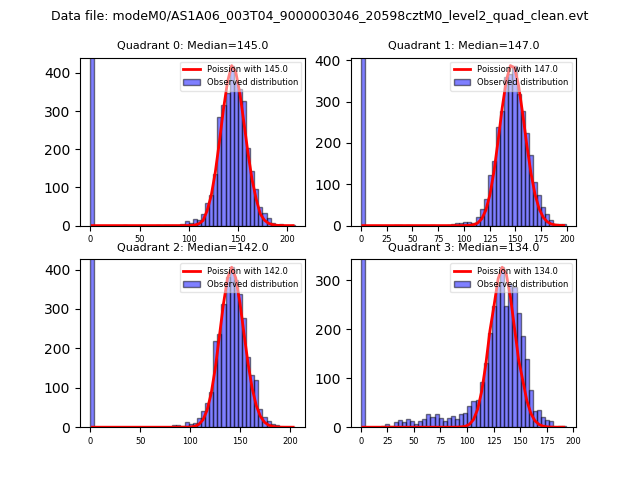 |
 |
| Quadrant-wise count rates Data is divided into 100 sec bins |
 |
|
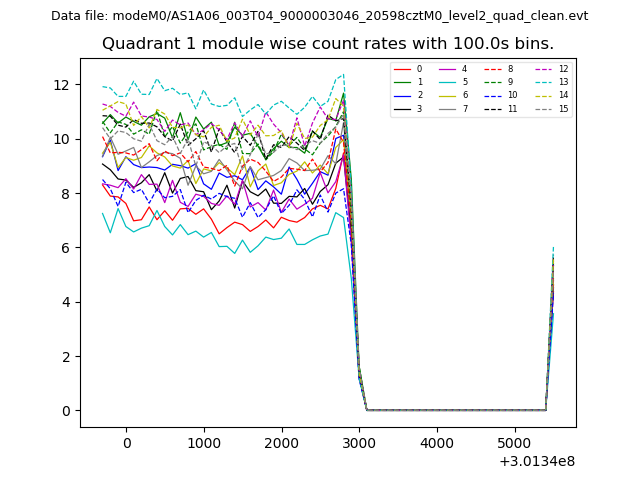
| Module-wise count rates for Quadrant A Data is divided into 100 sec bins |
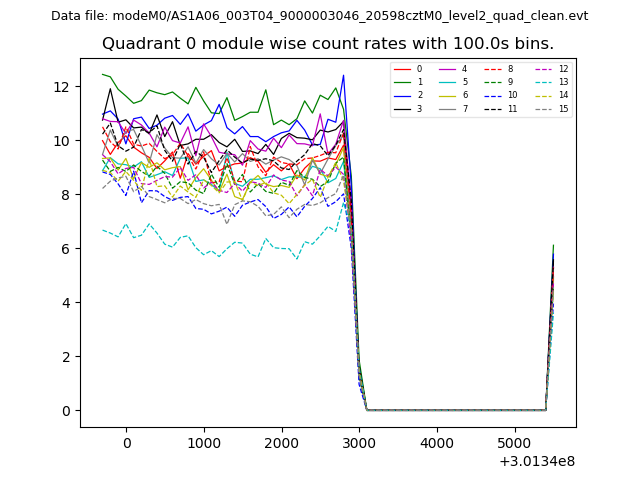 |
 |
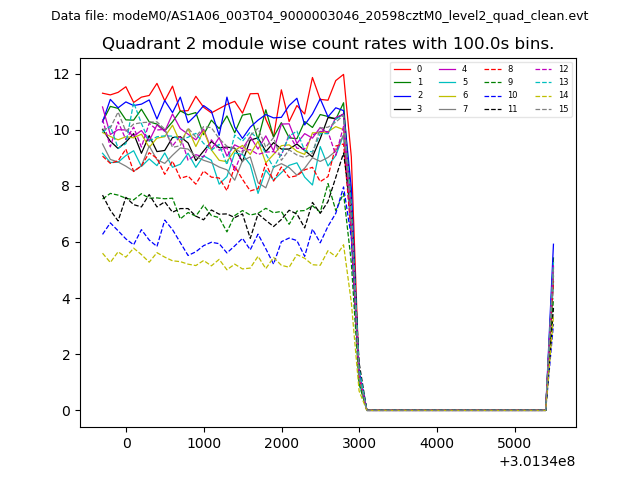
| Module-wise count rates for Quadrant B Data is divided into 100 sec bins |
 |
 |
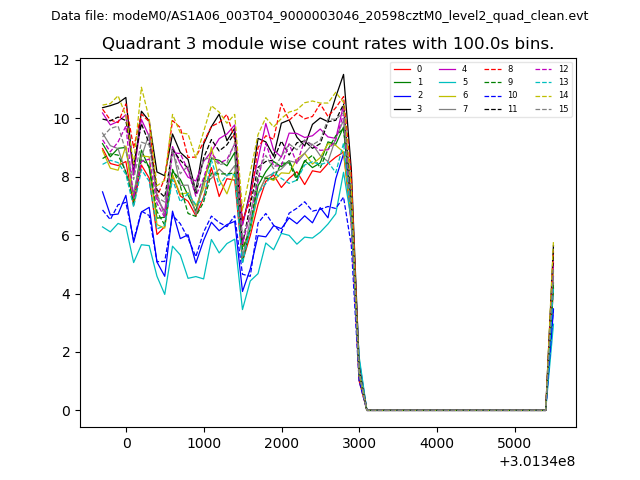
| Module-wise count rates for Quadrant C Data is divided into 100 sec bins |
 |
 |
| Module-wise count rates for Quadrant D Data is divided into 100 sec bins |
 |
 |
| Parameter | Plot |
|---|---|
| CZT HV Monitor | 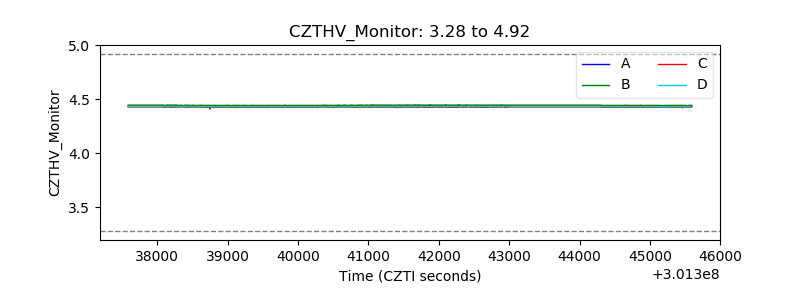 |
| D_VDD | 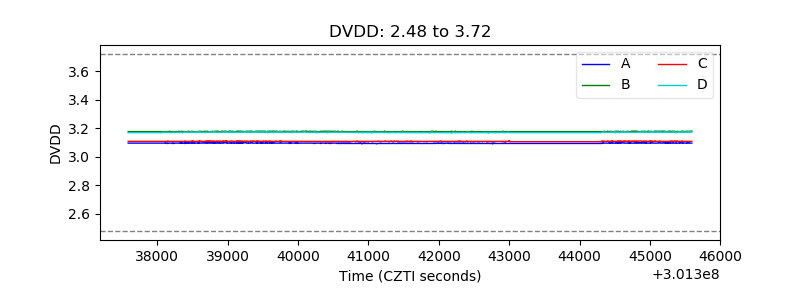 |
| Temperature 1 | 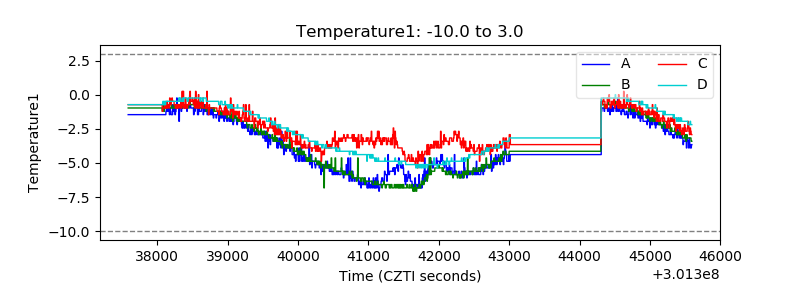 |
| Veto HV Monitor |  |
| Veto LLD |  |
| Alpha Counter | 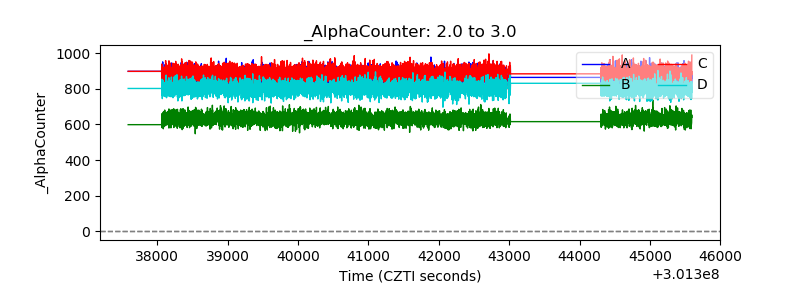 |
| _CPM_Rate | 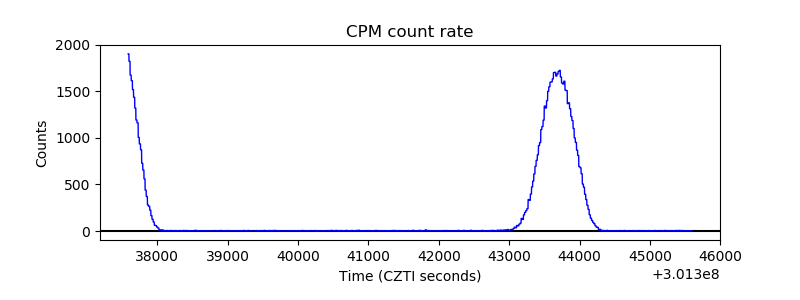 |
| CZT Counter | 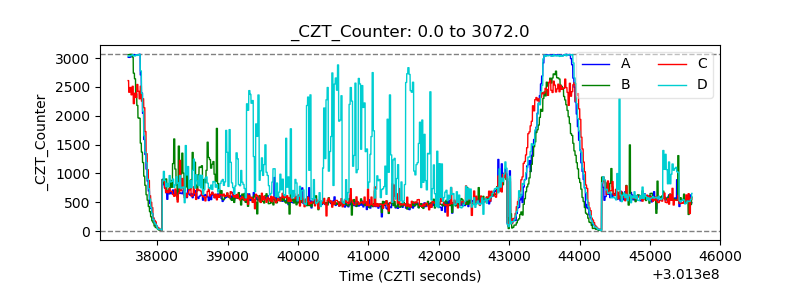 |
| +2.5 Volts monitor |  |
| +5 Volts monitor |  |
| _ROLL_ROT | 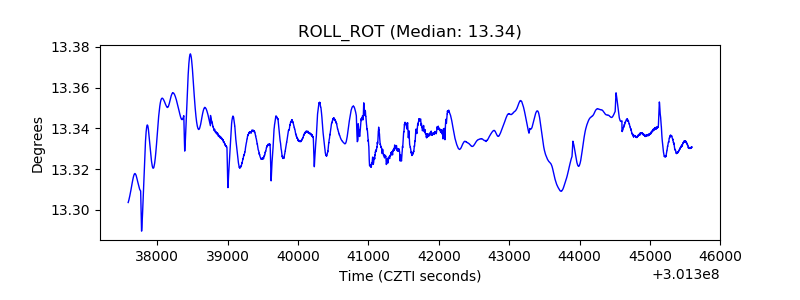 |
| _Roll_DEC | 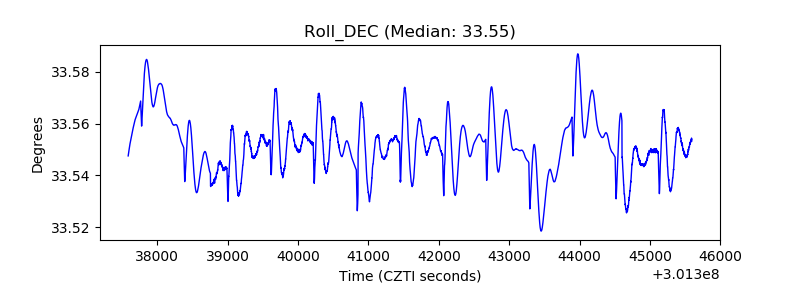 |
| _Roll_RA |  |
| Veto Counter | 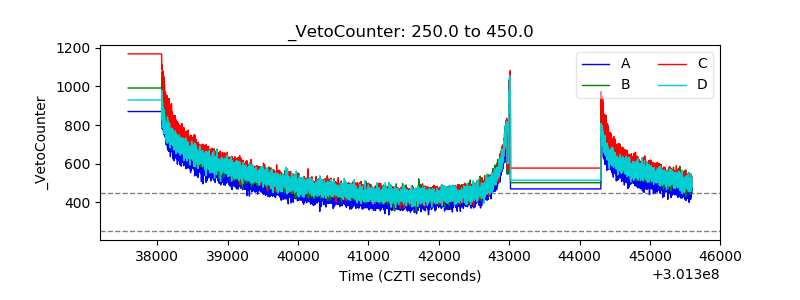 |