| Param | Original file | Final file |
|---|---|---|
| Filename | modeM0/AS1A06_003T04_9000003046_20599cztM0_level2.evt | modeM0/AS1A06_003T04_9000003046_20599cztM0_level2_quad_clean.evt |
| Size (bytes) | 485,904,960 | 90,722,880 |
| Size | 463.4 MB | 86.5 MB |
| Events in quadrant A | 3,389,179 | 581,500 |
| Events in quadrant B | 3,396,528 | 593,836 |
| Events in quadrant C | 3,407,450 | 573,581 |
| Events in quadrant D | 4,096,892 | 560,809 |
| Mode M0 | |||
|---|---|---|---|
| Quadrant | BADHDUFLAG | Total packets | Discarded packets |
| A | 0 | 14088 | 1 |
| B | 0 | 14076 | 1 |
| C | 0 | 13965 | 1 |
| D | 0 | 16419 | 1 |
| Mode SS | |||
|---|---|---|---|
| Quadrant | BADHDUFLAG | Total packets | Discarded packets |
| A | 0 | 128 | 0 |
| B | 0 | 128 | 0 |
| C | 0 | 128 | 0 |
| D | 0 | 128 | 0 |
| Mode M9 | |||
|---|---|---|---|
| Quadrant | BADHDUFLAG | Total packets | Discarded packets |
| A | 0 | 11 | 0 |
| B | 0 | 11 | 0 |
| C | 0 | 11 | 0 |
| D | 0 | 11 | 0 |
| Quadrant | Total seconds | Saturated seconds | Saturation percentage |
|---|---|---|---|
| A | 6267 | 99 | 1.579703% |
| B | 6268 | 137 | 2.185705% |
| C | 6268 | 149 | 2.377154% |
| D | 6268 | 170 | 2.712189% |
Noise dominated data is calculated using 1-second bins in cleaned event files. If a bin has >2000 counts, and if more than 50% of those come from <1% of pixels, then it is considered to be noise-dominated and hence unusable.
| Quadrant | # 1 sec bins | Bins with >0 counts | Bins with >2000 counts | High rate bins dominated by noise | Noise dominated (total time) | Noise dominated (detector-on time) | Marked lightcurve |
|---|---|---|---|---|---|---|---|
| A | 7397 | 6268 | 12 | 12 | 0.16% | 0.19% | 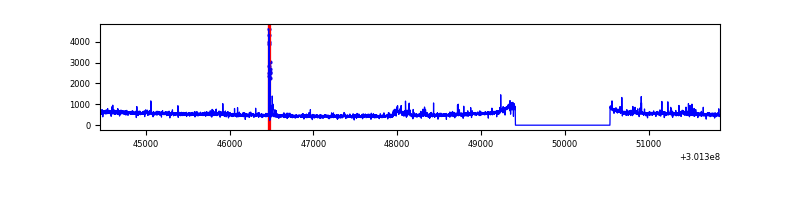 |
| B | 7398 | 6269 | 7 | 7 | 0.09% | 0.11% | 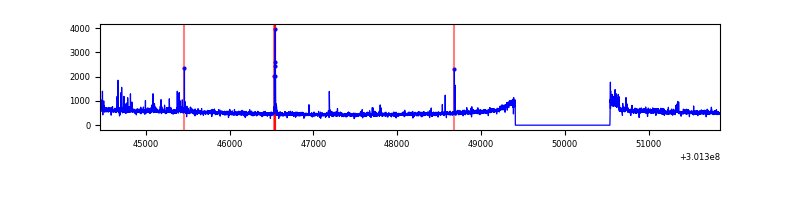 |
| C | 7398 | 6269 | 0 | 0 | 0.00% | 0.00% | 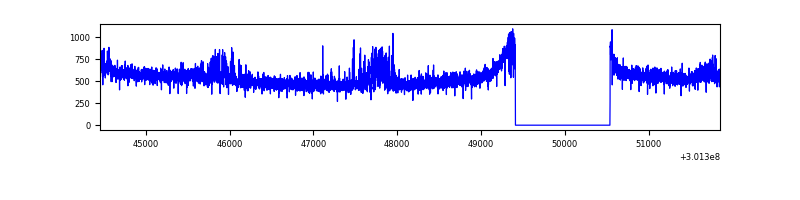 |
| D | 7398 | 6269 | 72 | 72 | 0.97% | 1.15% | 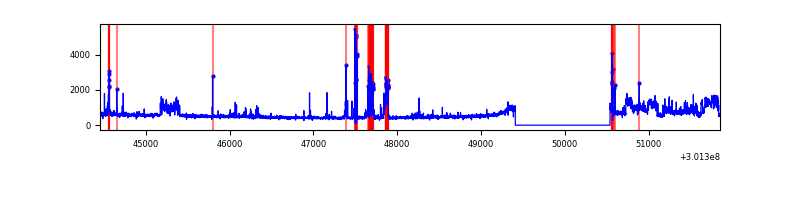 |
Top three noisy pixels from each quadrant. If the there are fewer than three noisy pixels in the level2.evt file, extra rows are filled as -1
| Pixel properties | Quadrant properties | ||||||
|---|---|---|---|---|---|---|---|
| Quadrant | DetID | PixID | Counts | Sigma | Mean | Median | Sigma |
| A | 12 | 16 | 90215 | 535.47 | 824 | 808 | 167.0 |
| A | 5 | 16 | 71242 | 421.84 | 824 | 808 | 167.0 |
| A | 8 | 31 | 40059 | 235.08 | 824 | 808 | 167.0 |
| B | 0 | 190 | 62223 | 391.65 | 826 | 808 | 156.8 |
| B | 3 | 64 | 26853 | 166.09 | 826 | 808 | 156.8 |
| B | 0 | 189 | 22987 | 141.44 | 826 | 808 | 156.8 |
| C | 8 | 208 | 152483 | 812.66 | 802 | 808 | 186.6 |
| C | 14 | 238 | 125361 | 667.34 | 802 | 808 | 186.6 |
| C | 13 | 61 | 5772 | 26.6 | 802 | 808 | 186.6 |
| D | 1 | 20 | 644203 | 3270.0 | 811 | 789 | 196.8 |
| D | 2 | 165 | 241173 | 1221.69 | 811 | 789 | 196.8 |
| D | 5 | 222 | 59516 | 298.47 | 811 | 789 | 196.8 |
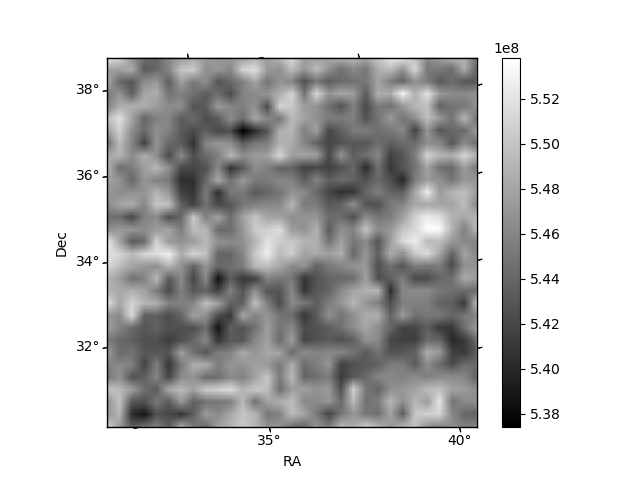
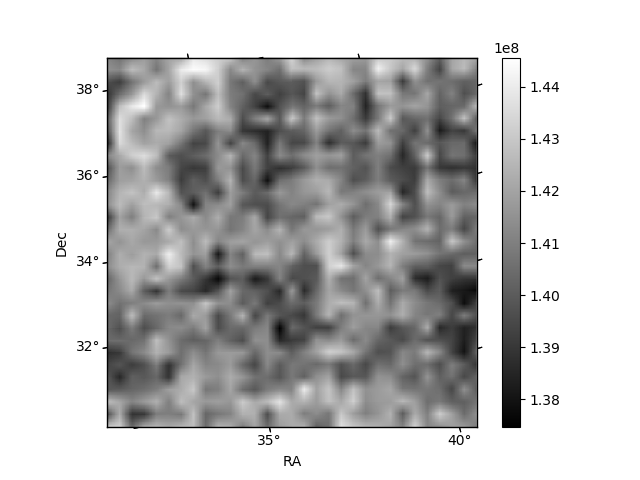
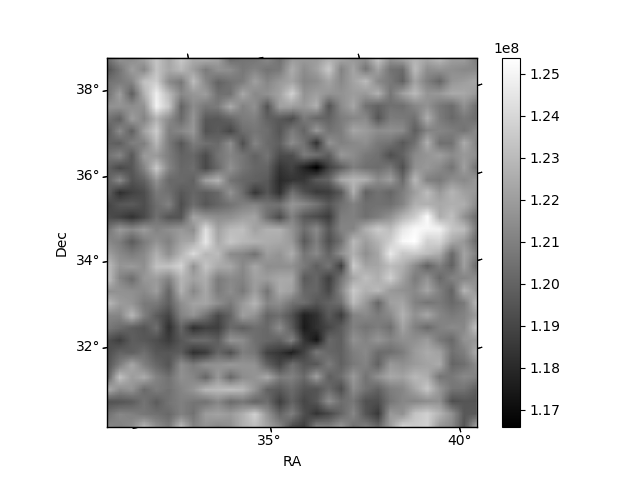
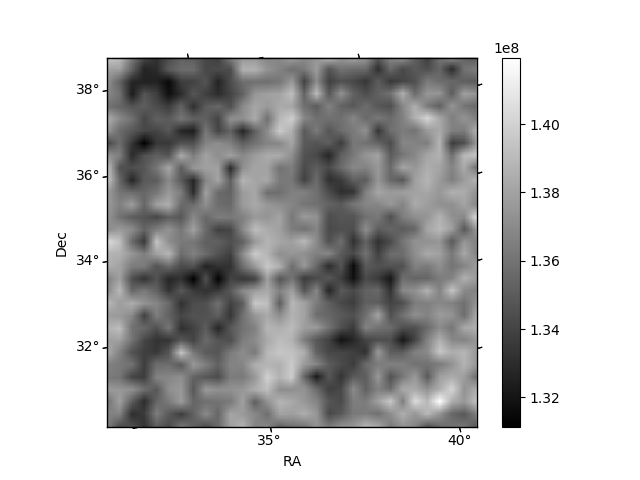
Histogram calculated using DETX and DETY for each event in the final _common_clean file
| Quadrant A | 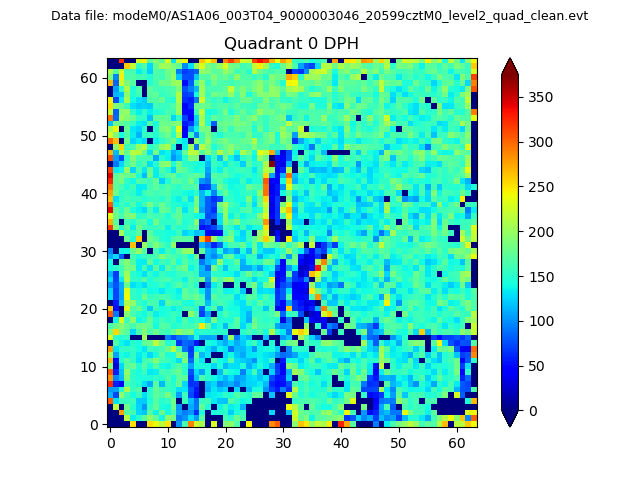 |
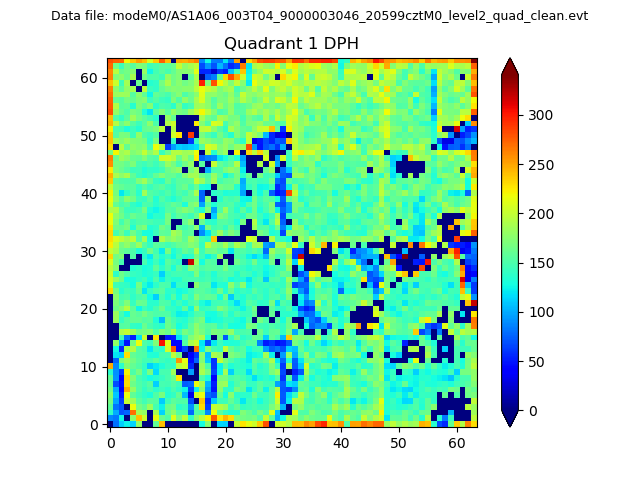 |
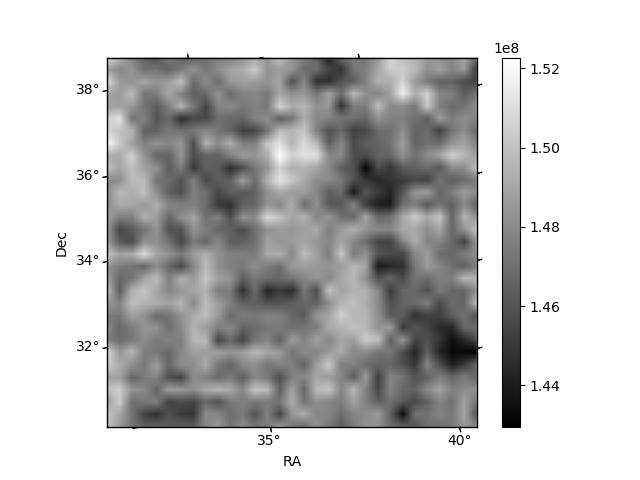
Quadrant B |
|---|---|---|---|
| Quadrant D | 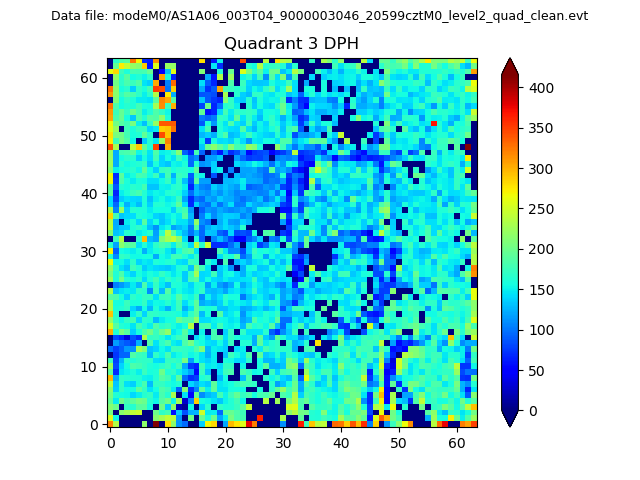 |
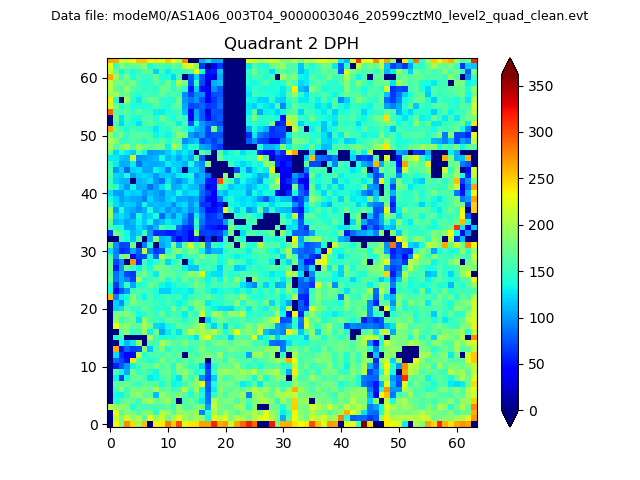 |
Quadrant C |
| Plot type | Count rate plots | Images |
|---|---|---|
| Comparison with Poisson distribution Blue bars denote a histogram of data divided into 1 sec bins. Red curve is a Poisson curve with rate = median count rate of data. |
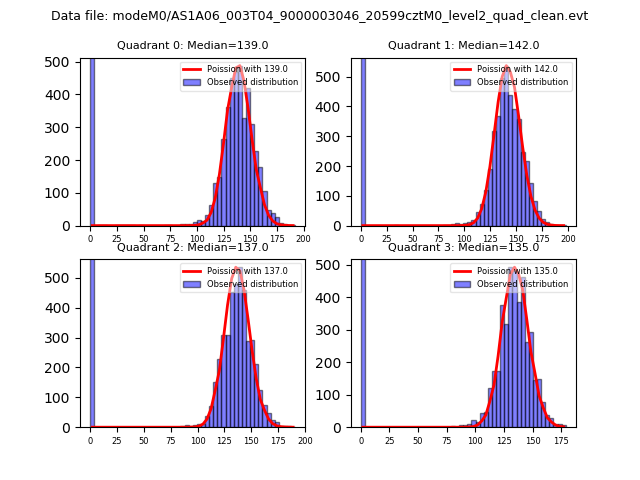 |
 |
| Quadrant-wise count rates Data is divided into 100 sec bins |
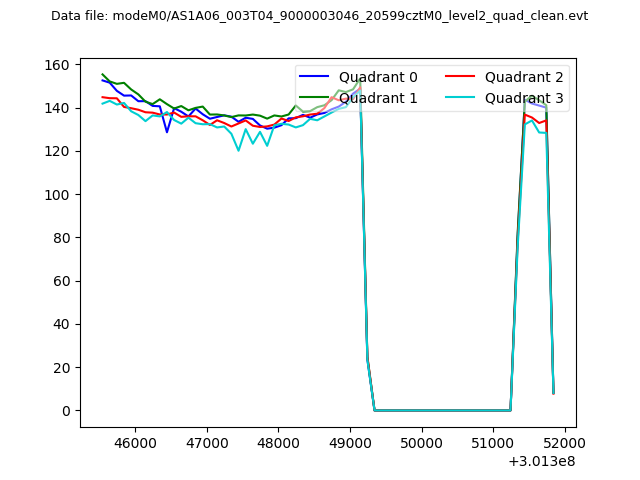 |
|
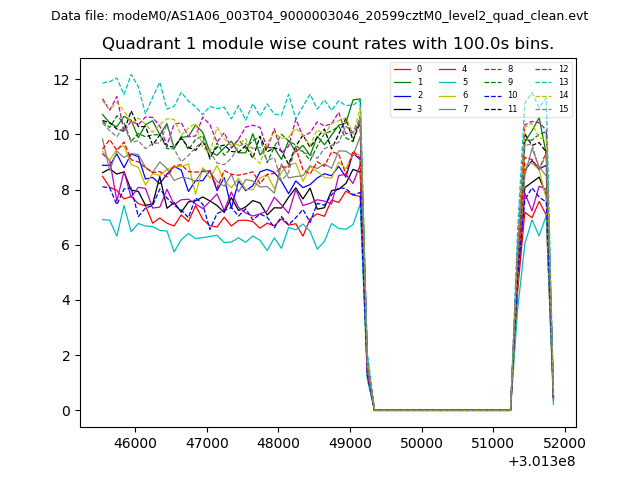
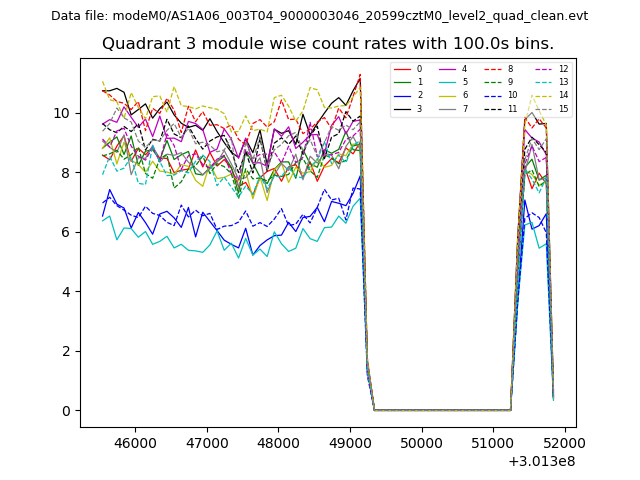
| Module-wise count rates for Quadrant A Data is divided into 100 sec bins |
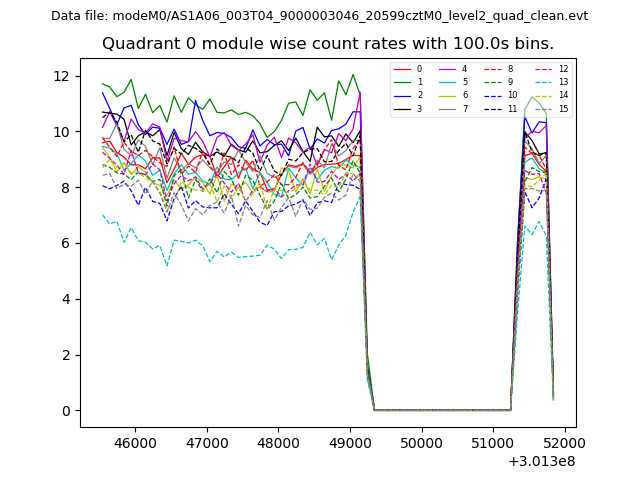 |
 |
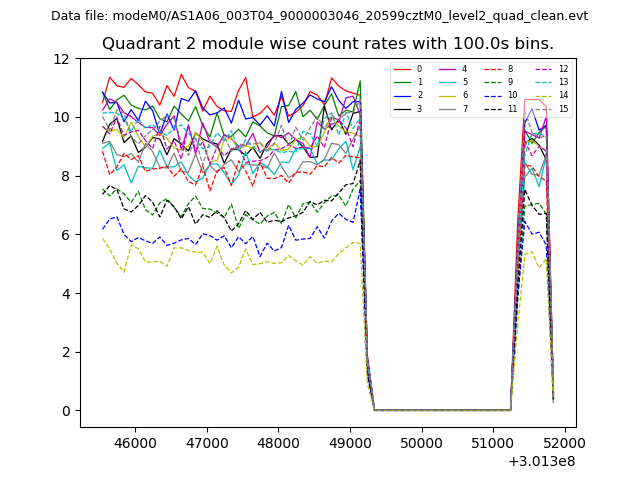
| Module-wise count rates for Quadrant B Data is divided into 100 sec bins |
 |
 |
| Module-wise count rates for Quadrant C Data is divided into 100 sec bins |
 |
 |
| Module-wise count rates for Quadrant D Data is divided into 100 sec bins |
 |
 |
| Parameter | Plot |
|---|---|
| CZT HV Monitor | 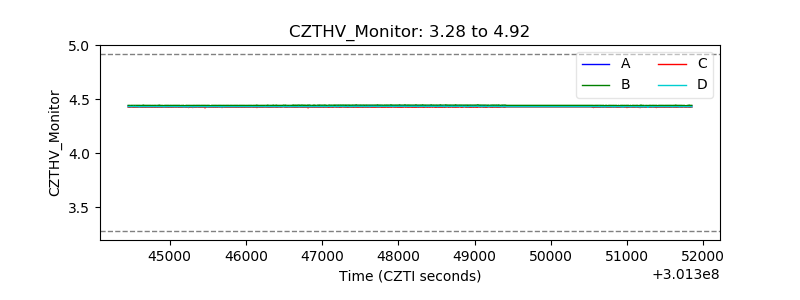 |
| D_VDD | 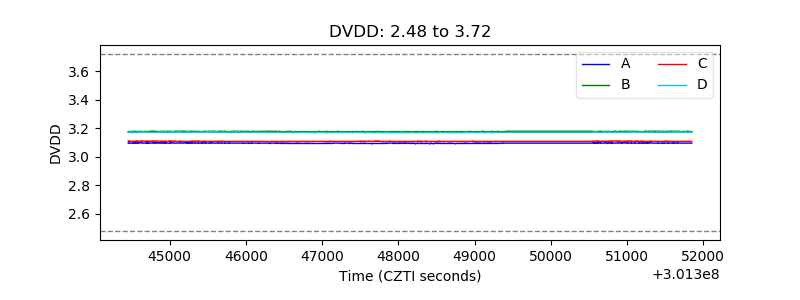 |
| Temperature 1 | 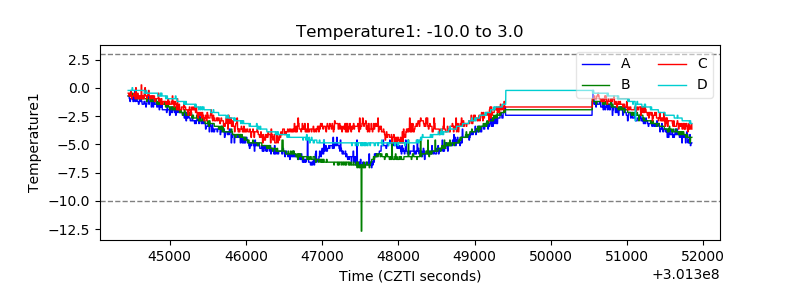 |
| Veto HV Monitor | 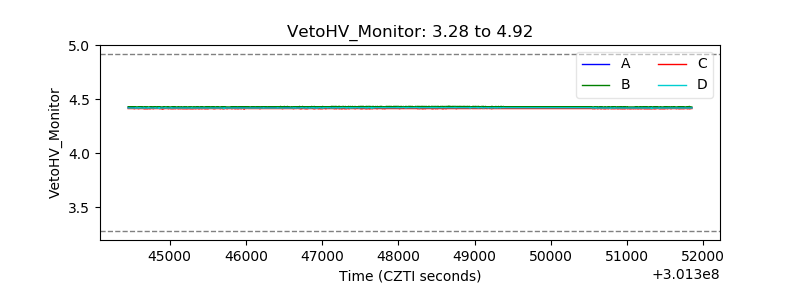 |
| Veto LLD |  |
| Alpha Counter |  |
| _CPM_Rate | 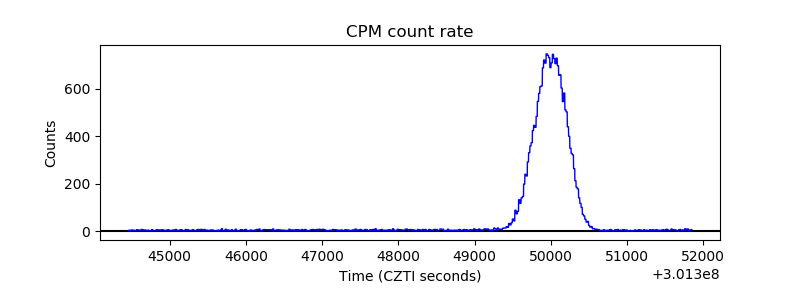 |
| CZT Counter | 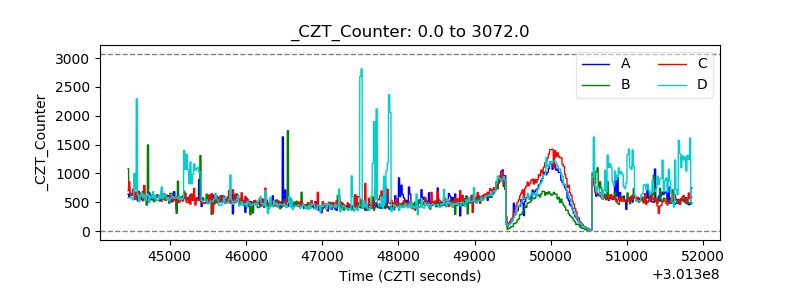 |
| +2.5 Volts monitor |  |
| +5 Volts monitor | 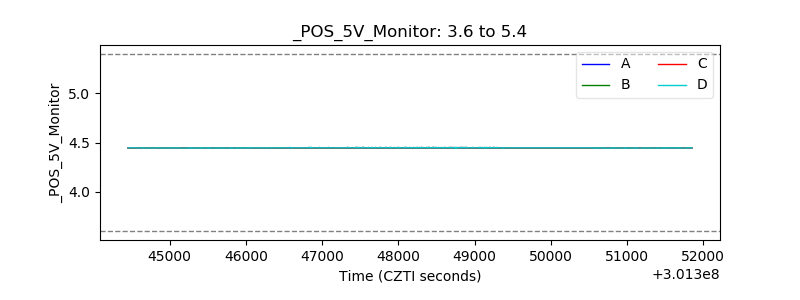 |
| _ROLL_ROT | 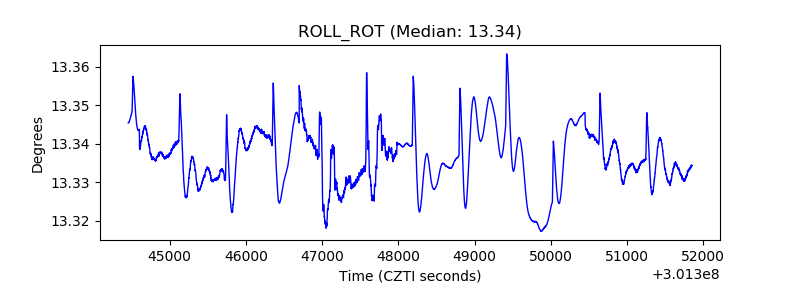 |
| _Roll_DEC | 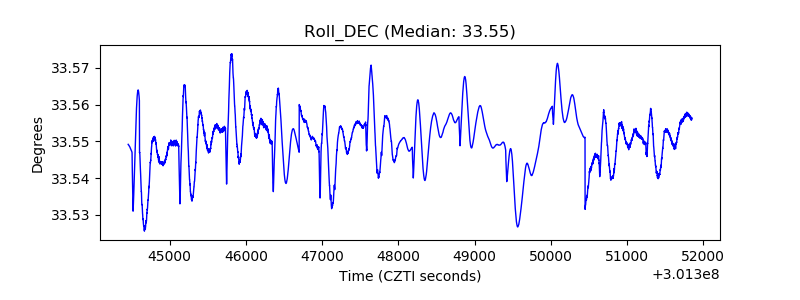 |
| _Roll_RA | 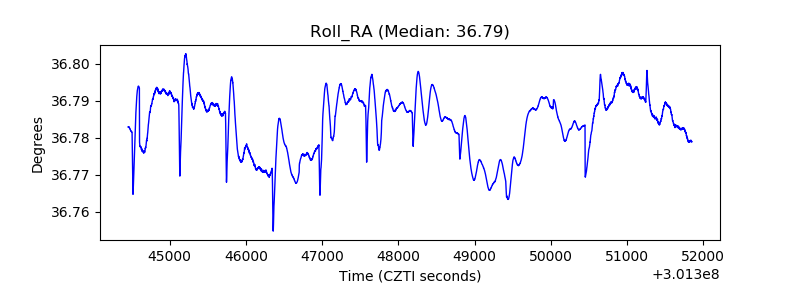 |
| Veto Counter | 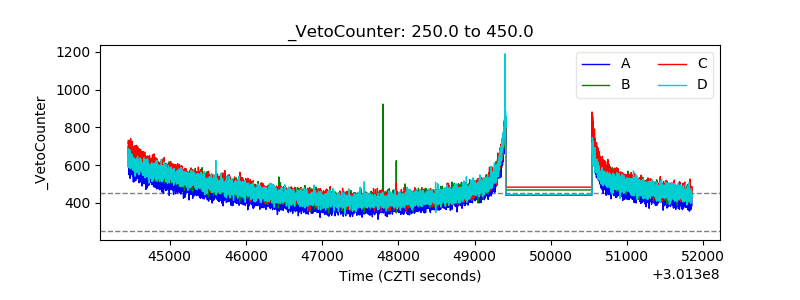 |