| Param | Original file | Final file |
|---|---|---|
| Filename | modeM0/AS1A06_003T04_9000003046_20600cztM0_level2.evt | modeM0/AS1A06_003T04_9000003046_20600cztM0_level2_quad_clean.evt |
| Size (bytes) | 589,662,720 | 95,253,120 |
| Size | 562.3 MB | 90.8 MB |
| Events in quadrant A | 3,554,176 | 616,180 |
| Events in quadrant B | 3,742,123 | 625,508 |
| Events in quadrant C | 3,645,314 | 603,792 |
| Events in quadrant D | 6,444,666 | 554,000 |
| Mode M0 | |||
|---|---|---|---|
| Quadrant | BADHDUFLAG | Total packets | Discarded packets |
| A | 0 | 15040 | 2 |
| B | 0 | 15618 | 2 |
| C | 0 | 15223 | 2 |
| D | 0 | 24096 | 2 |
| Mode SS | |||
|---|---|---|---|
| Quadrant | BADHDUFLAG | Total packets | Discarded packets |
| A | 0 | 144 | 0 |
| B | 0 | 144 | 0 |
| C | 0 | 144 | 0 |
| D | 0 | 144 | 0 |
| Mode M9 | |||
|---|---|---|---|
| Quadrant | BADHDUFLAG | Total packets | Discarded packets |
| A | 0 | 19 | 0 |
| B | 0 | 19 | 0 |
| C | 0 | 19 | 0 |
| D | 0 | 19 | 0 |
| Quadrant | Total seconds | Saturated seconds | Saturation percentage |
|---|---|---|---|
| A | 6959 | 149 | 2.141112% |
| B | 6960 | 241 | 3.462644% |
| C | 6960 | 228 | 3.275862% |
| D | 6960 | 589 | 8.462644% |
Noise dominated data is calculated using 1-second bins in cleaned event files. If a bin has >2000 counts, and if more than 50% of those come from <1% of pixels, then it is considered to be noise-dominated and hence unusable.
| Quadrant | # 1 sec bins | Bins with >0 counts | Bins with >2000 counts | High rate bins dominated by noise | Noise dominated (total time) | Noise dominated (detector-on time) | Marked lightcurve |
|---|---|---|---|---|---|---|---|
| A | 8894 | 6961 | 11 | 11 | 0.12% | 0.16% | 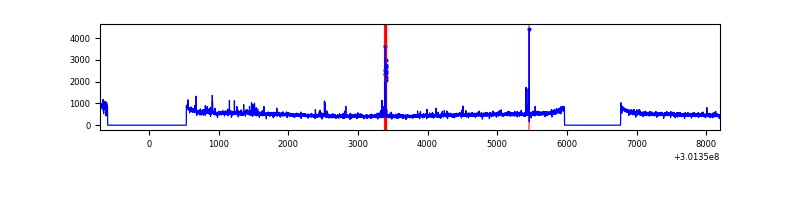 |
| B | 8895 | 6962 | 9 | 9 | 0.10% | 0.13% | 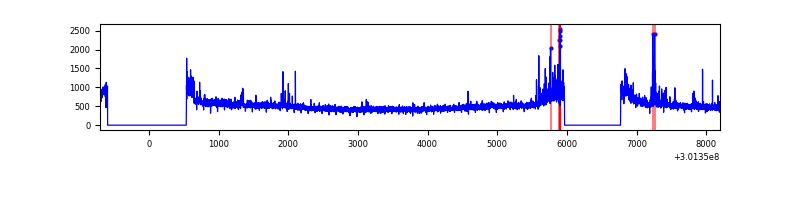 |
| C | 8895 | 6962 | 0 | 0 | 0.00% | 0.00% | 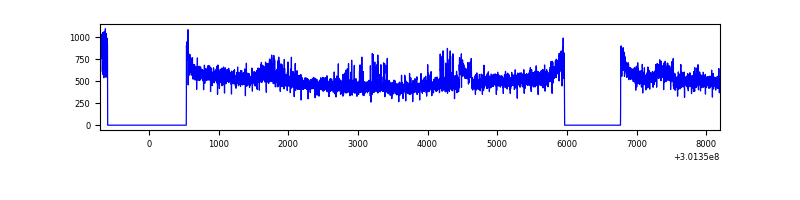 |
| D | 8895 | 6961 | 314 | 314 | 3.53% | 4.51% | 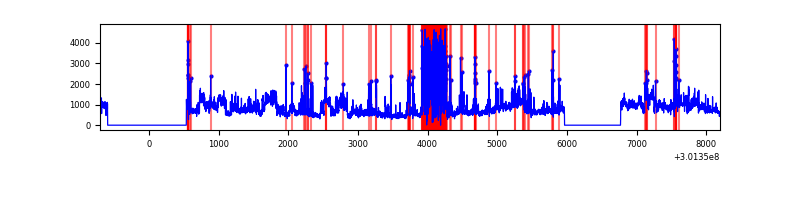 |
Top three noisy pixels from each quadrant. If the there are fewer than three noisy pixels in the level2.evt file, extra rows are filled as -1
| Pixel properties | Quadrant properties | ||||||
|---|---|---|---|---|---|---|---|
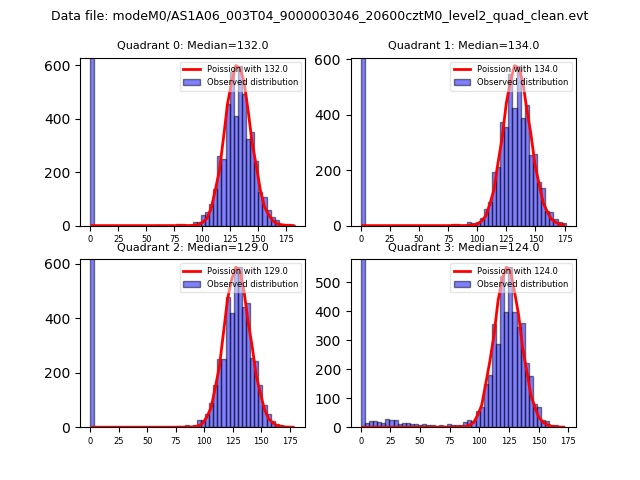
| Quadrant | DetID | PixID | Counts | Sigma | Mean | Median | Sigma |
| A | 12 | 16 | 73579 | 402.61 | 885 | 866 | 180.6 |
| A | 15 | 174 | 39605 | 214.5 | 885 | 866 | 180.6 |
| A | 5 | 16 | 23289 | 124.16 | 885 | 866 | 180.6 |
| B | 7 | 220 | 106071 | 621.67 | 884 | 862 | 169.2 |
| B | 0 | 190 | 61293 | 357.08 | 884 | 862 | 169.2 |
| B | 0 | 189 | 38095 | 220.01 | 884 | 862 | 169.2 |
| C | 8 | 208 | 142275 | 708.19 | 855 | 861 | 199.7 |
| C | 14 | 238 | 134381 | 668.65 | 855 | 861 | 199.7 |
| C | 5 | 112 | 31151 | 151.69 | 855 | 861 | 199.7 |
| D | 1 | 20 | 1707939 | 8331.45 | 840 | 815 | 204.9 |
| D | 5 | 222 | 1236951 | 6032.84 | 840 | 815 | 204.9 |
| D | 2 | 165 | 88272 | 426.83 | 840 | 815 | 204.9 |
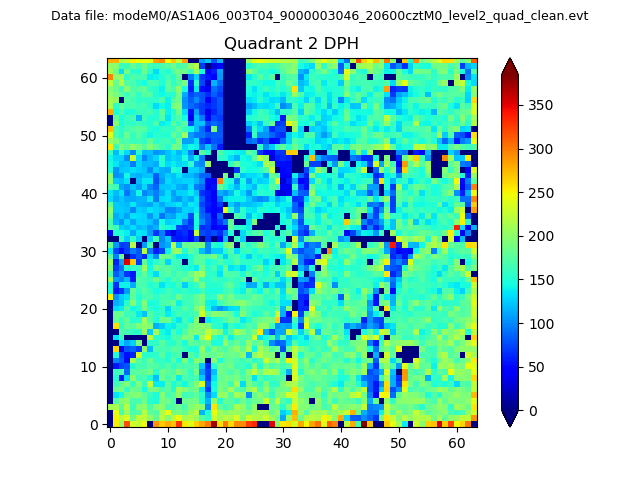
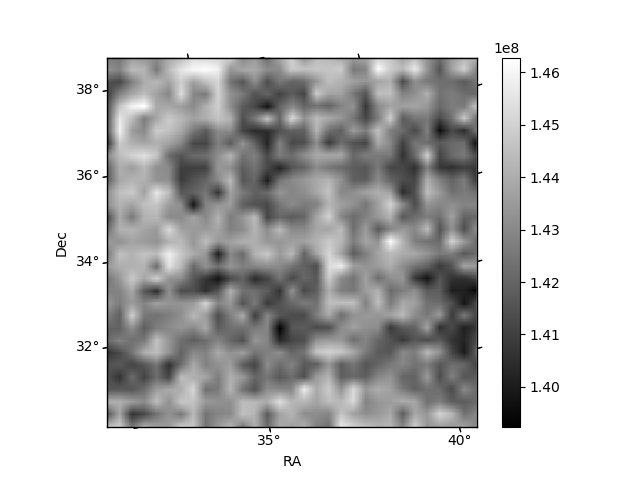
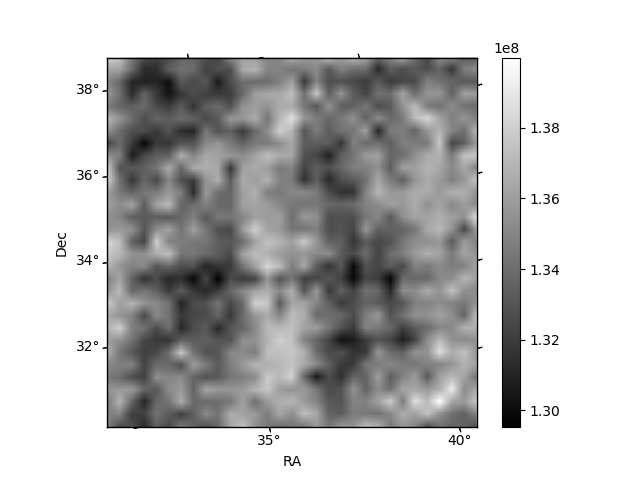
Histogram calculated using DETX and DETY for each event in the final _common_clean file
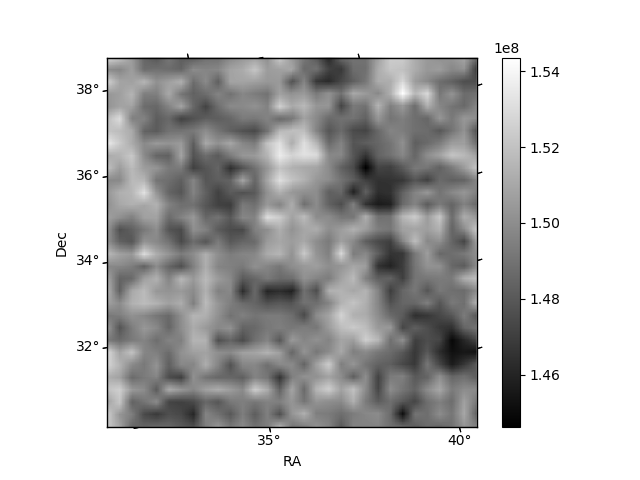
| Quadrant A | 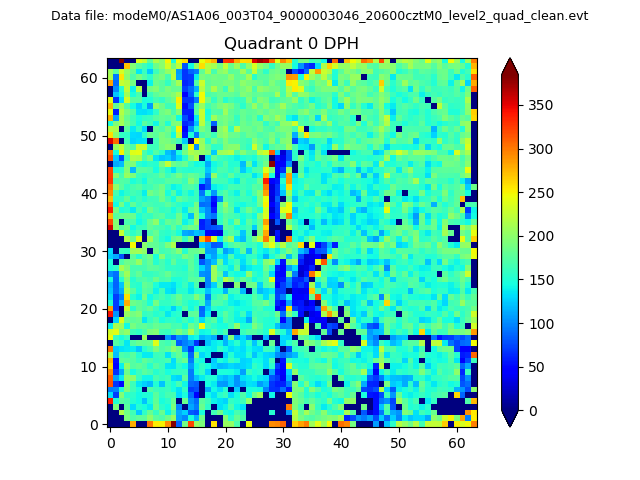 |
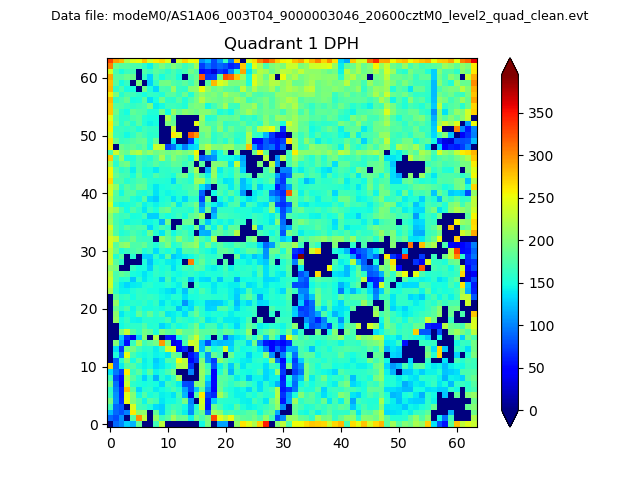 |
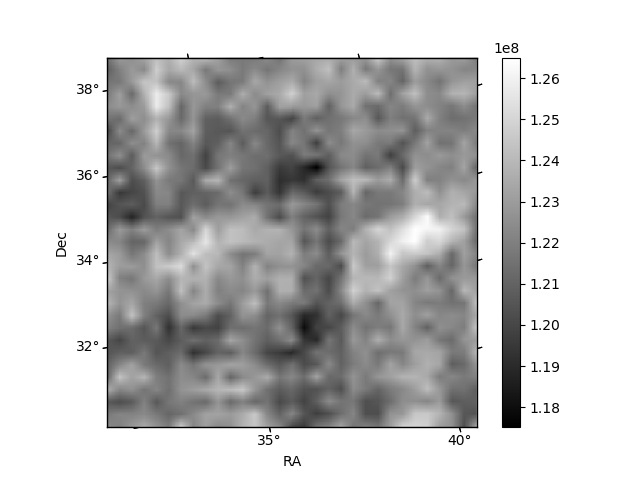
Quadrant B |
|---|---|---|---|
| Quadrant D | 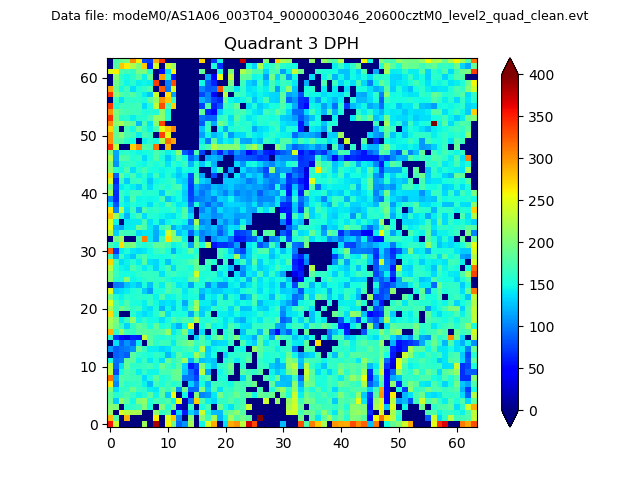 |
 |
Quadrant C |
| Plot type | Count rate plots | Images |
|---|---|---|
| Comparison with Poisson distribution Blue bars denote a histogram of data divided into 1 sec bins. Red curve is a Poisson curve with rate = median count rate of data. |
 |
 |
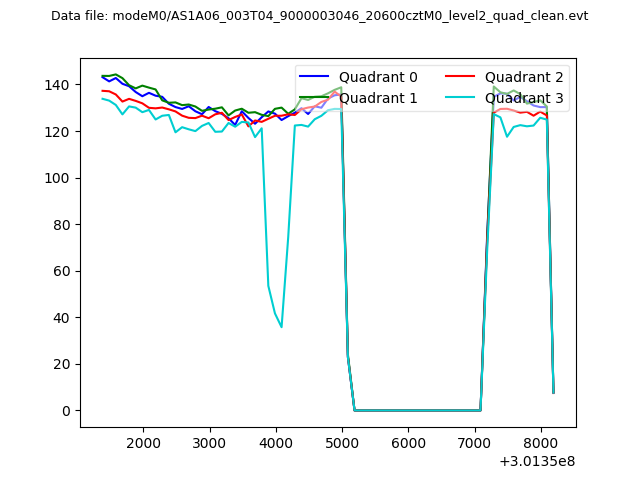
| Quadrant-wise count rates Data is divided into 100 sec bins |
 |
|
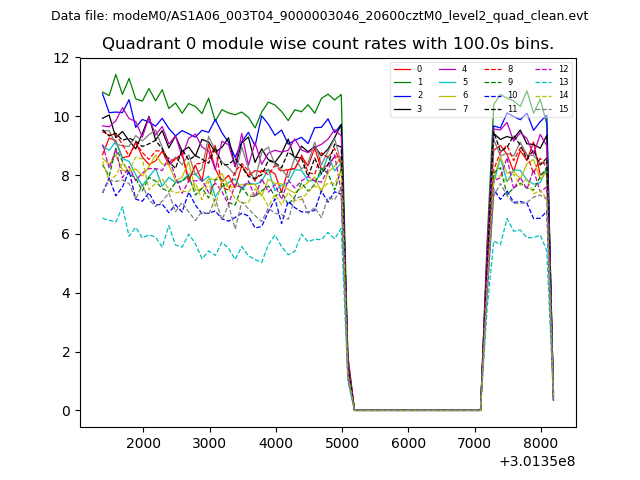
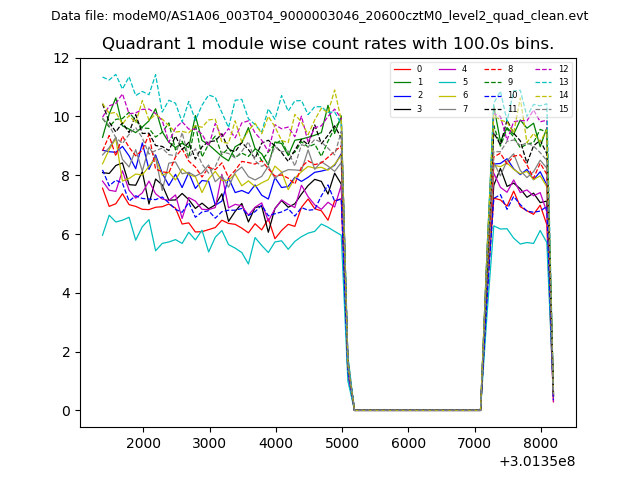
| Module-wise count rates for Quadrant A Data is divided into 100 sec bins |
 |
 |
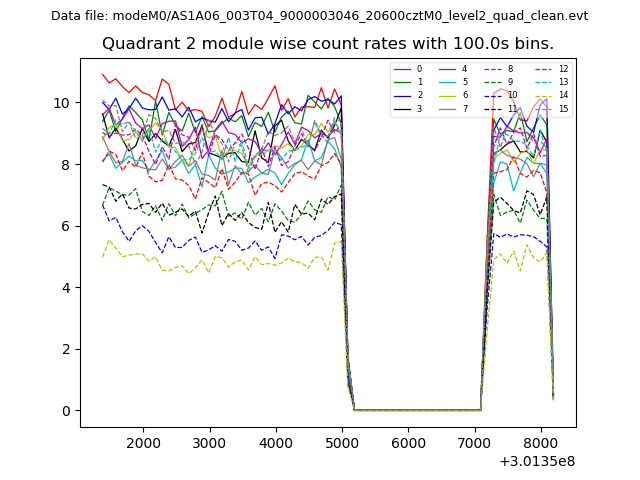
| Module-wise count rates for Quadrant B Data is divided into 100 sec bins |
 |
 |
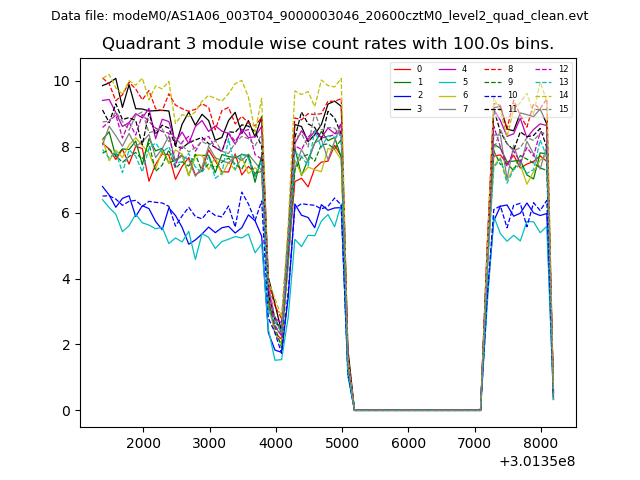
| Module-wise count rates for Quadrant C Data is divided into 100 sec bins |
 |
 |
| Module-wise count rates for Quadrant D Data is divided into 100 sec bins |
 |
 |
| Parameter | Plot |
|---|---|
| CZT HV Monitor | 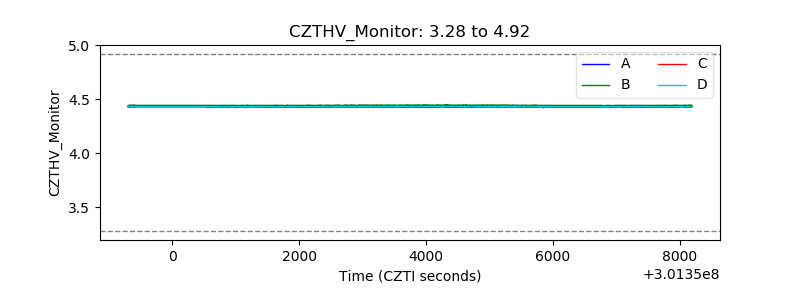 |
| D_VDD | 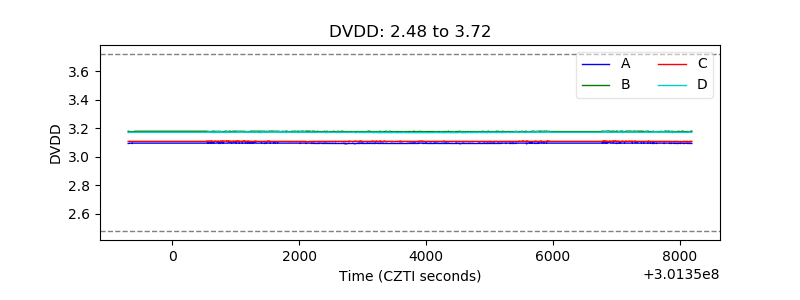 |
| Temperature 1 | 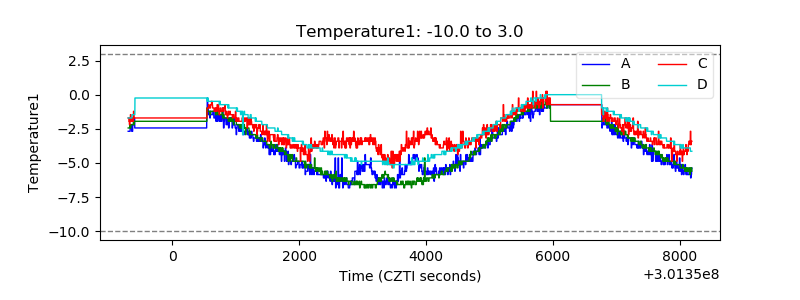 |
| Veto HV Monitor | 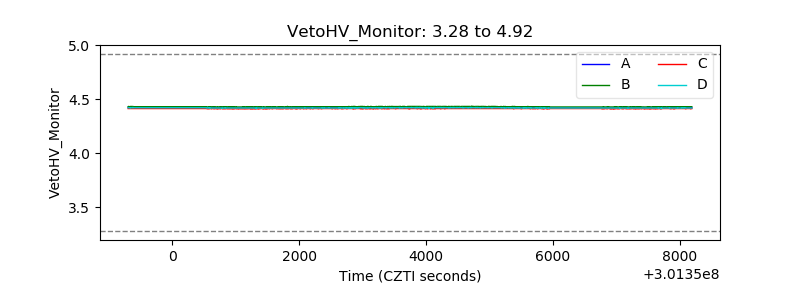 |
| Veto LLD | 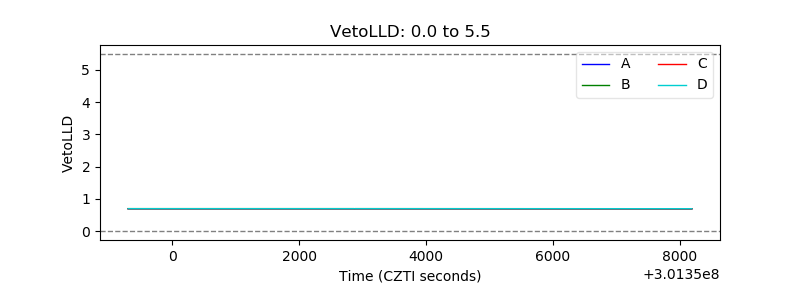 |
| Alpha Counter | 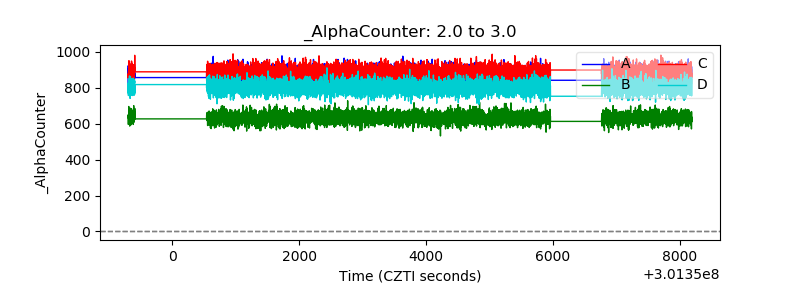 |
| _CPM_Rate | 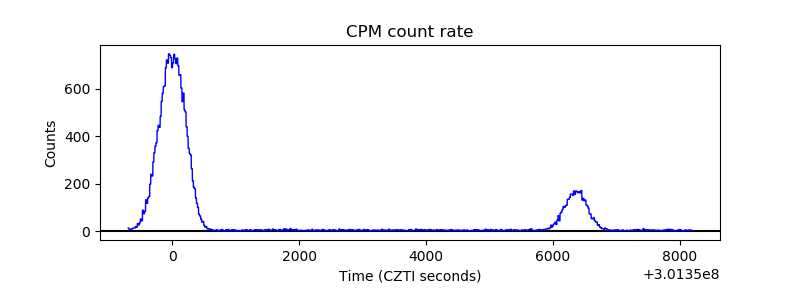 |
| CZT Counter | 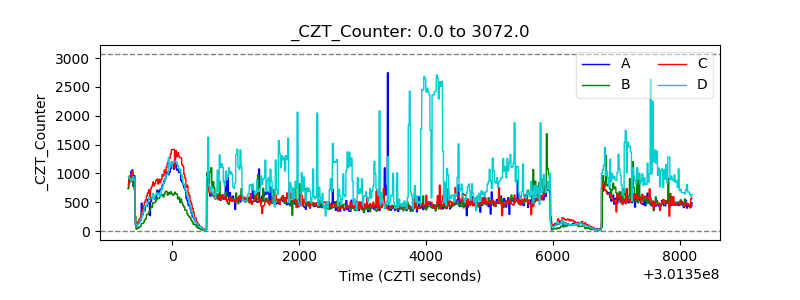 |
| +2.5 Volts monitor |  |
| +5 Volts monitor |  |
| _ROLL_ROT | 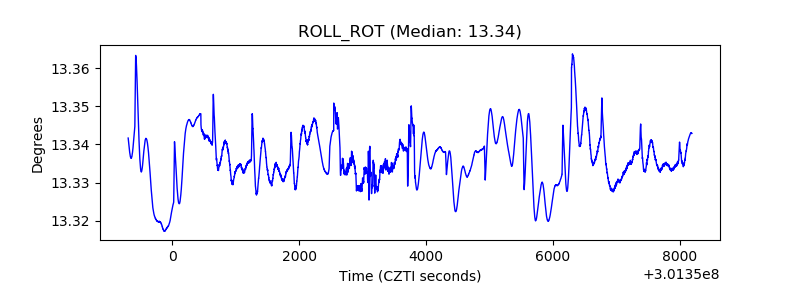 |
| _Roll_DEC | 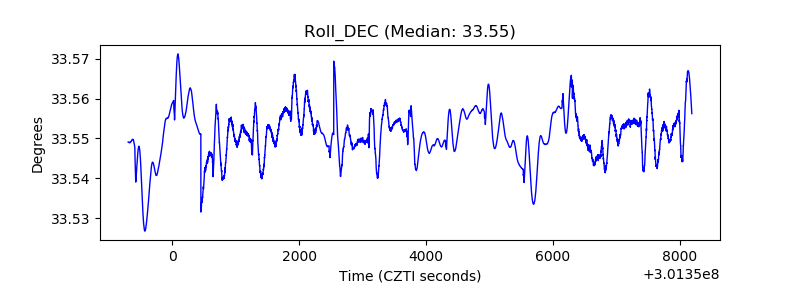 |
| _Roll_RA | 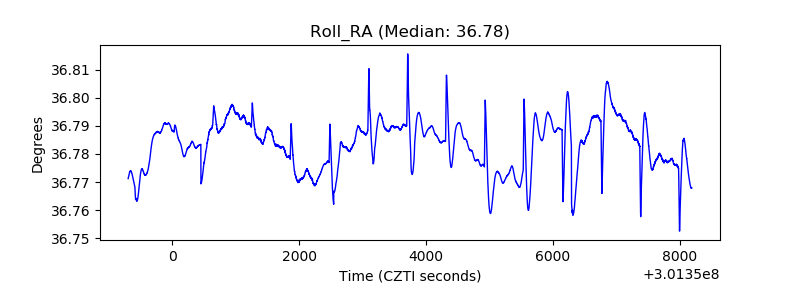 |
| Veto Counter | 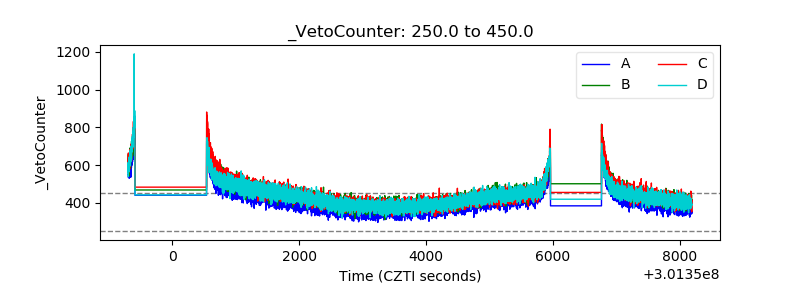 |