| Param | Original file | Final file |
|---|---|---|
| Filename | modeM0/AS1A06_003T04_9000003046_20602cztM0_level2.evt | modeM0/AS1A06_003T04_9000003046_20602cztM0_level2_quad_clean.evt |
| Size (bytes) | 587,289,600 | 105,361,920 |
| Size | 560.1 MB | 100.5 MB |
| Events in quadrant A | 3,580,085 | 674,067 |
| Events in quadrant B | 4,240,399 | 684,006 |
| Events in quadrant C | 3,752,378 | 661,724 |
| Events in quadrant D | 5,698,413 | 642,862 |
| Mode M0 | |||
|---|---|---|---|
| Quadrant | BADHDUFLAG | Total packets | Discarded packets |
| A | 0 | 15833 | 2 |
| B | 0 | 17852 | 2 |
| C | 0 | 16176 | 2 |
| D | 0 | 22327 | 2 |
| Mode SS | |||
|---|---|---|---|
| Quadrant | BADHDUFLAG | Total packets | Discarded packets |
| A | 0 | 154 | 0 |
| B | 0 | 154 | 0 |
| C | 0 | 154 | 0 |
| D | 0 | 154 | 0 |
| Mode M9 | |||
|---|---|---|---|
| Quadrant | BADHDUFLAG | Total packets | Discarded packets |
| A | 0 | 5 | 0 |
| B | 0 | 6 | 0 |
| C | 0 | 6 | 0 |
| D | 0 | 6 | 0 |
| Quadrant | Total seconds | Saturated seconds | Saturation percentage |
|---|---|---|---|
| A | 7593 | 76 | 1.000922% |
| B | 7593 | 236 | 3.108126% |
| C | 7593 | 163 | 2.146714% |
| D | 7593 | 496 | 6.532332% |
Noise dominated data is calculated using 1-second bins in cleaned event files. If a bin has >2000 counts, and if more than 50% of those come from <1% of pixels, then it is considered to be noise-dominated and hence unusable.
| Quadrant | # 1 sec bins | Bins with >0 counts | Bins with >2000 counts | High rate bins dominated by noise | Noise dominated (total time) | Noise dominated (detector-on time) | Marked lightcurve |
|---|---|---|---|---|---|---|---|
| A | 7898 | 7594 | 0 | 0 | 0.00% | 0.00% | 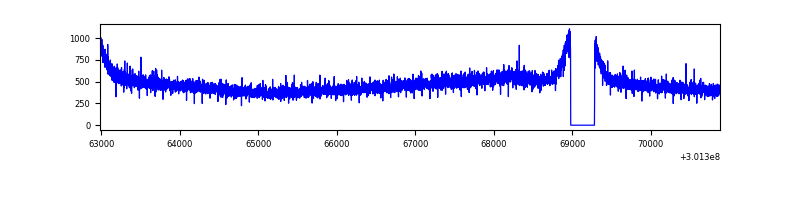 |
| B | 7898 | 7594 | 56 | 56 | 0.71% | 0.74% | 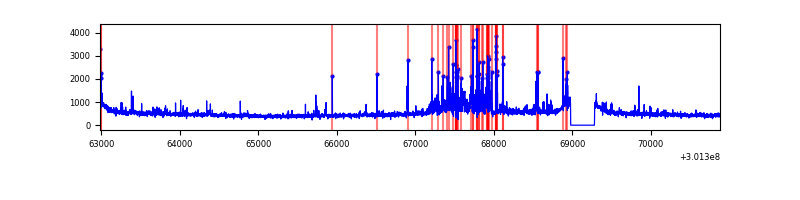 |
| C | 7898 | 7594 | 0 | 0 | 0.00% | 0.00% | 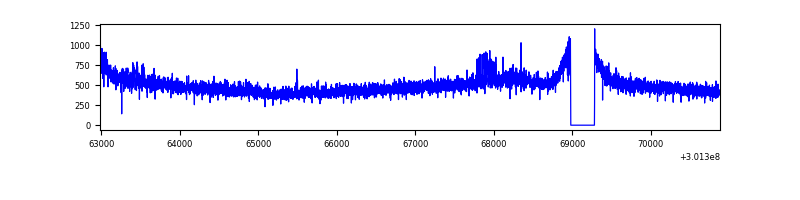 |
| D | 7898 | 7594 | 285 | 285 | 3.61% | 3.75% | 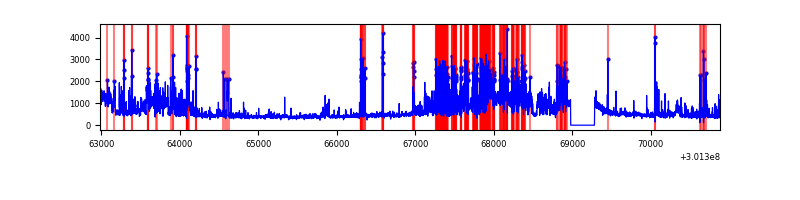 |
Top three noisy pixels from each quadrant. If the there are fewer than three noisy pixels in the level2.evt file, extra rows are filled as -1
| Pixel properties | Quadrant properties | ||||||
|---|---|---|---|---|---|---|---|
| Quadrant | DetID | PixID | Counts | Sigma | Mean | Median | Sigma |
| A | 0 | 226 | 7921 | 37.28 | 928 | 909 | 188.1 |
| A | 12 | 194 | 7432 | 34.68 | 928 | 909 | 188.1 |
| A | 3 | 137 | 7422 | 34.63 | 928 | 909 | 188.1 |
| B | 4 | 171 | 234792 | 1308.72 | 928 | 905 | 178.7 |
| B | 7 | 220 | 177867 | 990.2 | 928 | 905 | 178.7 |
| B | 0 | 197 | 62416 | 344.19 | 928 | 905 | 178.7 |
| C | 14 | 238 | 138533 | 649.68 | 895 | 901 | 211.8 |
| C | 8 | 208 | 114274 | 535.17 | 895 | 901 | 211.8 |
| C | 3 | 233 | 8038 | 33.69 | 895 | 901 | 211.8 |
| D | 1 | 20 | 1628869 | 7525.07 | 889 | 864 | 216.3 |
| D | 5 | 222 | 446943 | 2061.89 | 889 | 864 | 216.3 |
| D | 13 | 153 | 55271 | 251.48 | 889 | 864 | 216.3 |
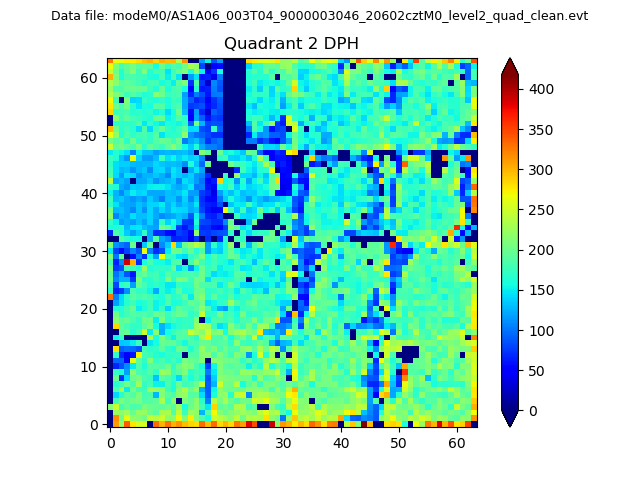
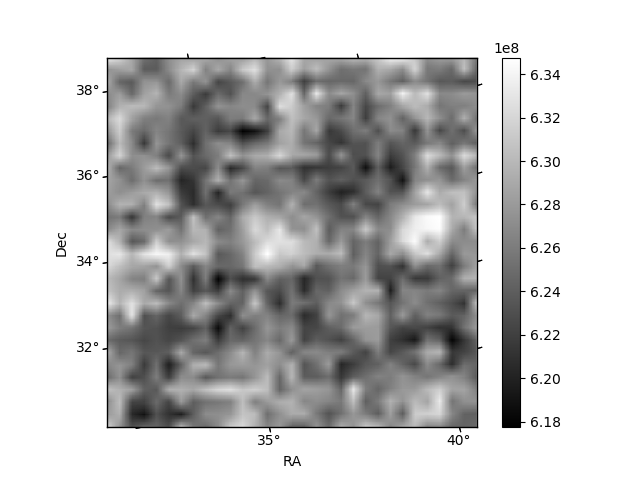
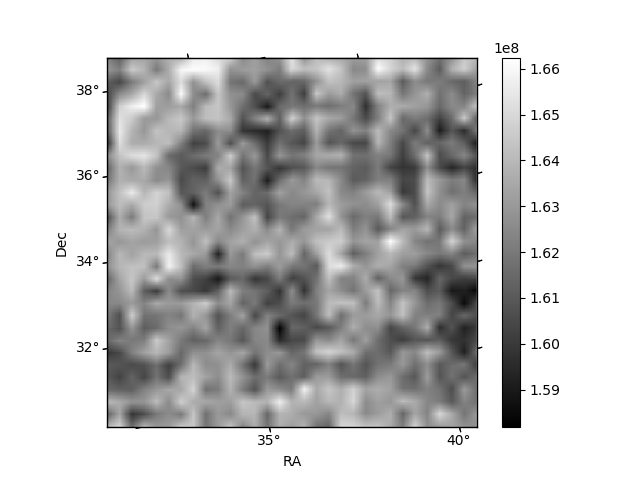
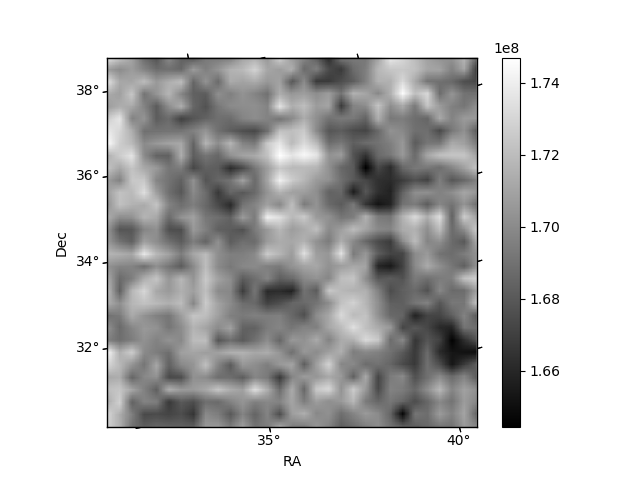
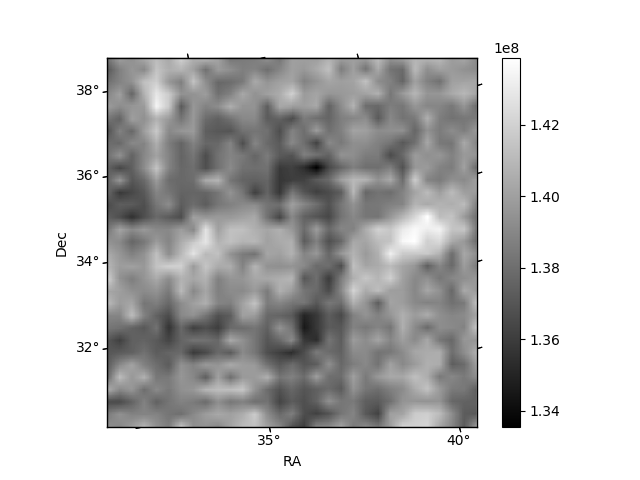
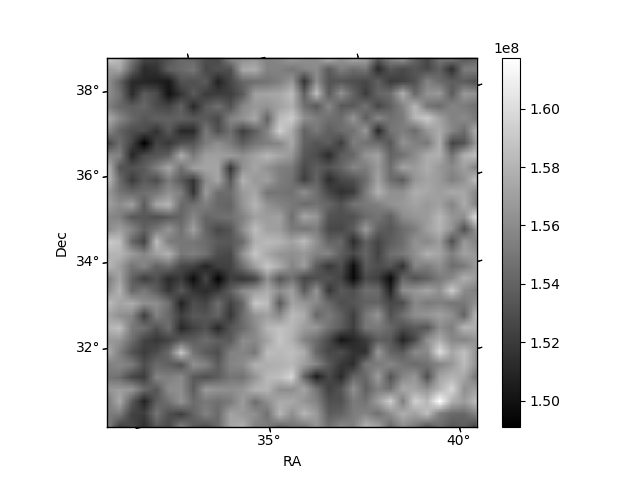
Histogram calculated using DETX and DETY for each event in the final _common_clean file
| Quadrant A | 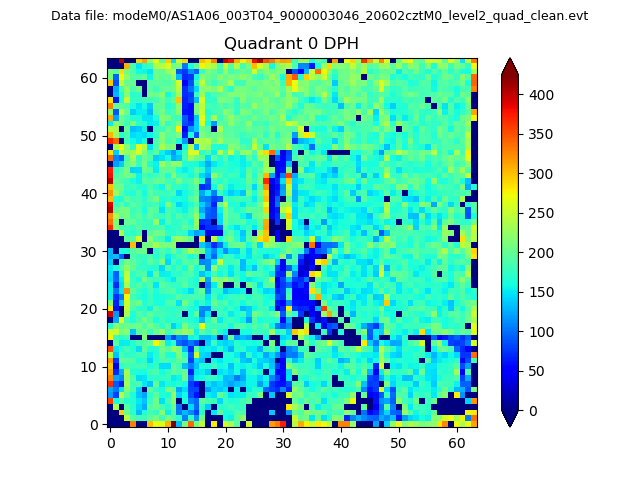 |
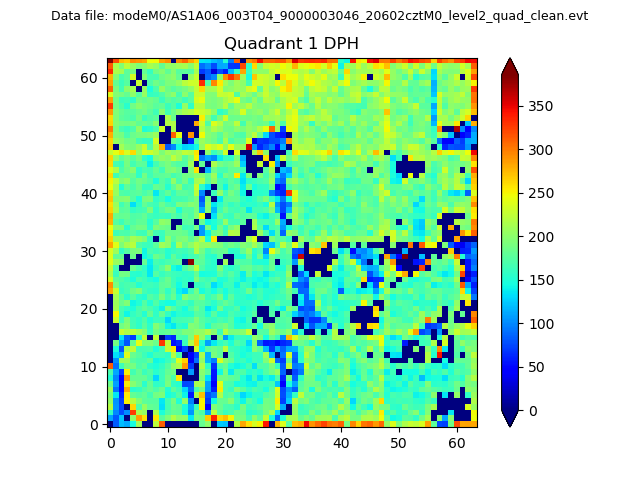 |
Quadrant B |
|---|---|---|---|
| Quadrant D | 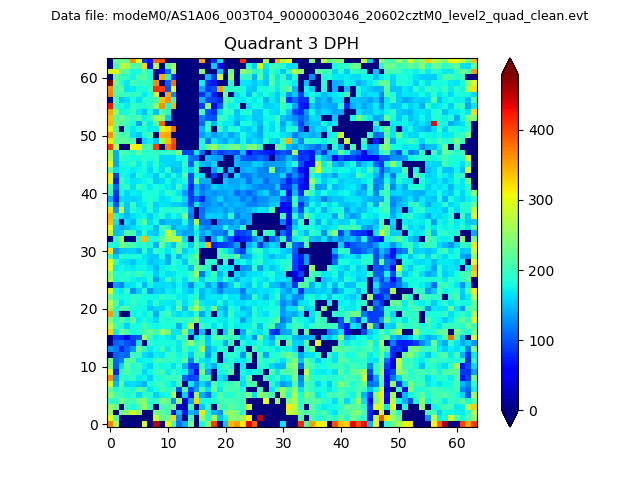 |
 |
Quadrant C |
| Plot type | Count rate plots | Images |
|---|---|---|
| Comparison with Poisson distribution Blue bars denote a histogram of data divided into 1 sec bins. Red curve is a Poisson curve with rate = median count rate of data. |
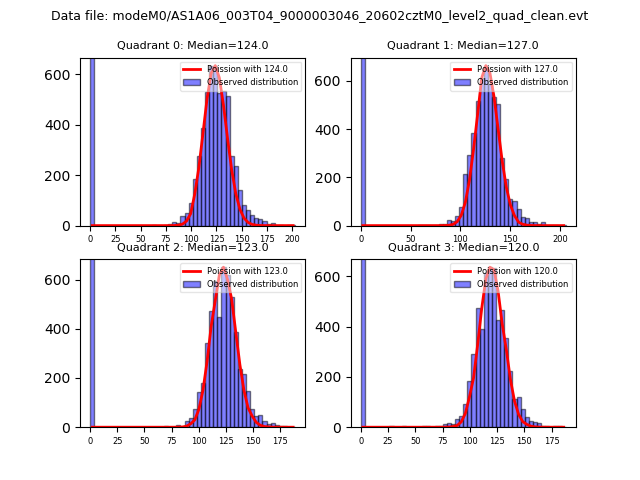 |
 |
| Quadrant-wise count rates Data is divided into 100 sec bins |
 |
|
| Module-wise count rates for Quadrant A Data is divided into 100 sec bins |
 |
 |
| Module-wise count rates for Quadrant B Data is divided into 100 sec bins |
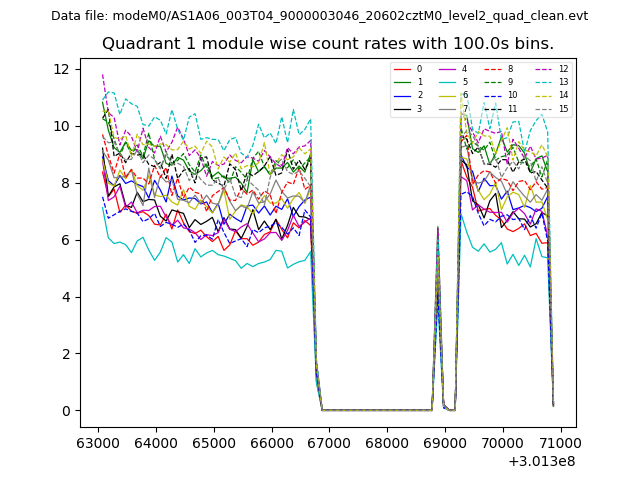 |
 |
| Module-wise count rates for Quadrant C Data is divided into 100 sec bins |
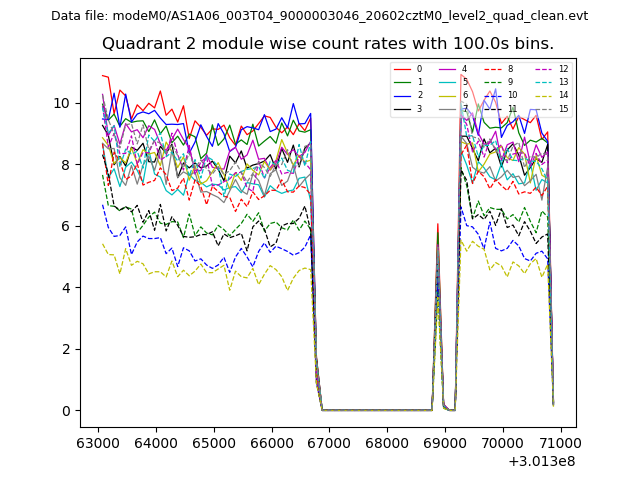 |
 |
| Module-wise count rates for Quadrant D Data is divided into 100 sec bins |
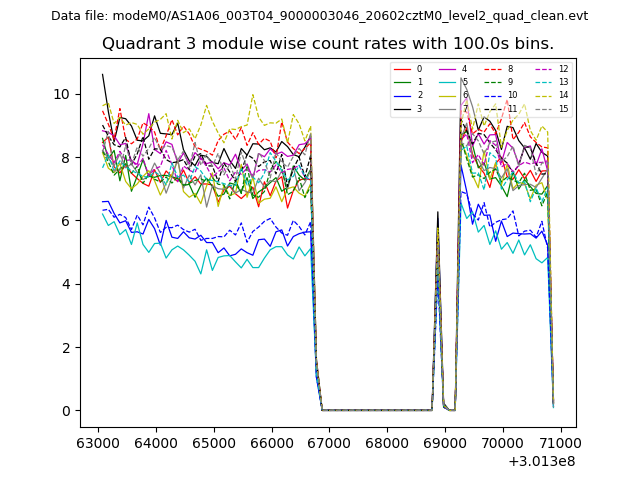 |
 |
| Parameter | Plot |
|---|---|
| CZT HV Monitor | 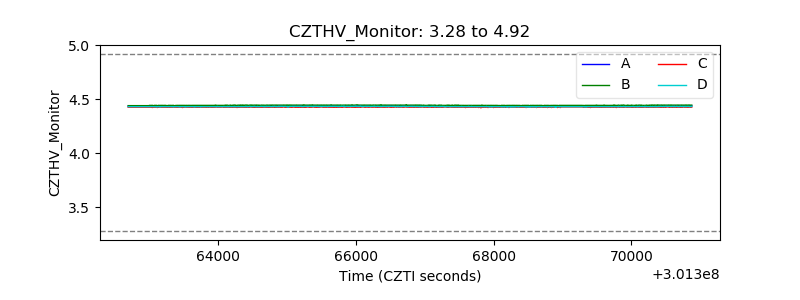 |
| D_VDD | 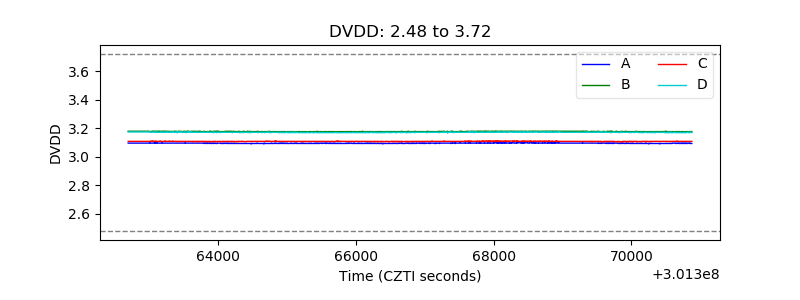 |
| Temperature 1 | 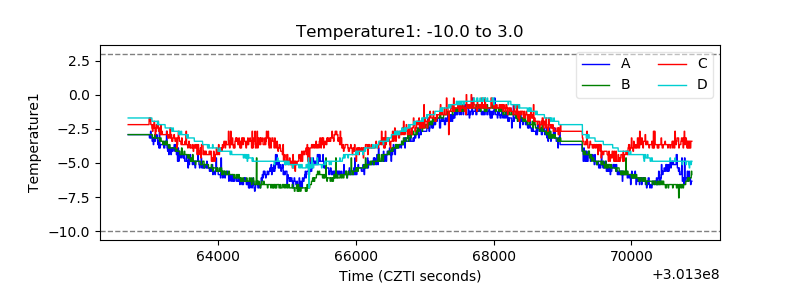 |
| Veto HV Monitor |  |
| Veto LLD | 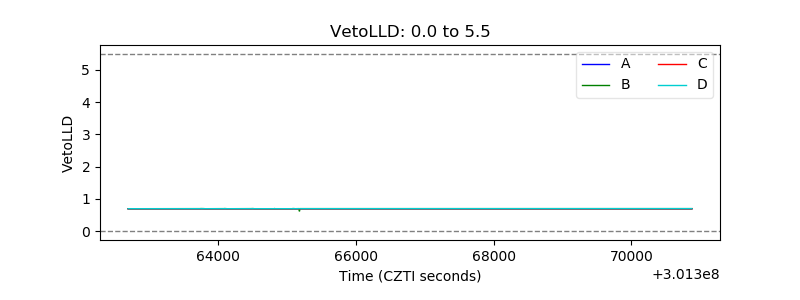 |
| Alpha Counter | 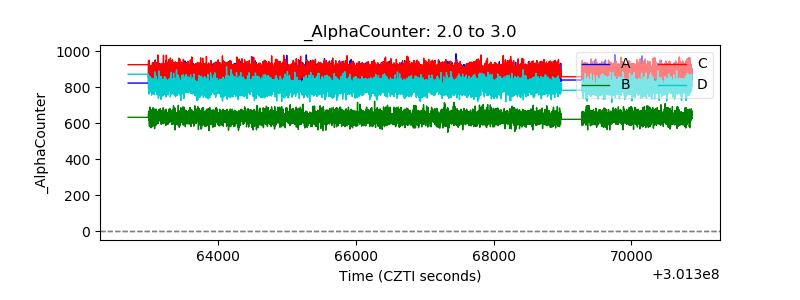 |
| _CPM_Rate | 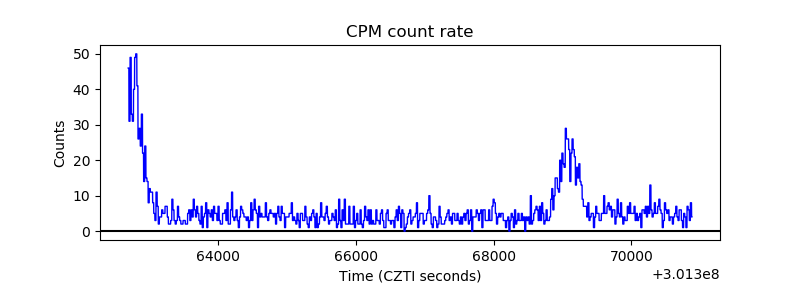 |
| CZT Counter | 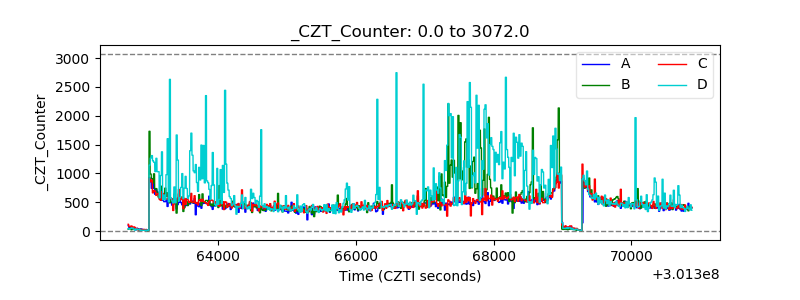 |
| +2.5 Volts monitor | 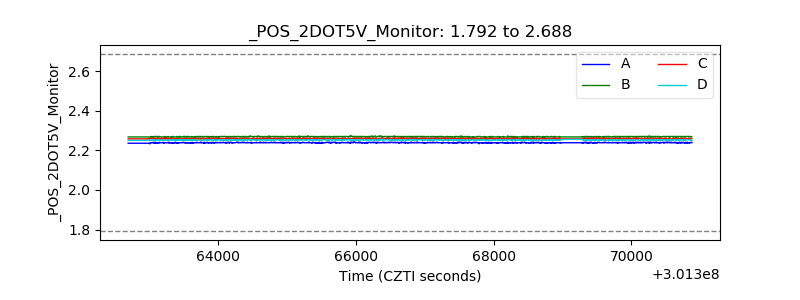 |
| +5 Volts monitor |  |
| _ROLL_ROT | 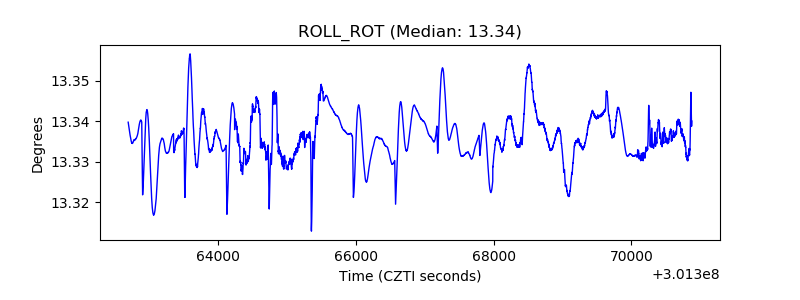 |
| _Roll_DEC | 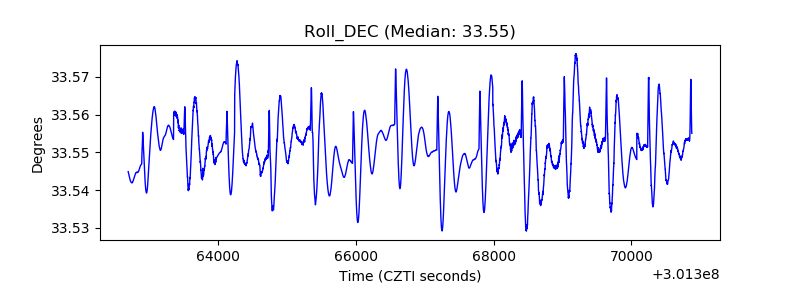 |
| _Roll_RA | 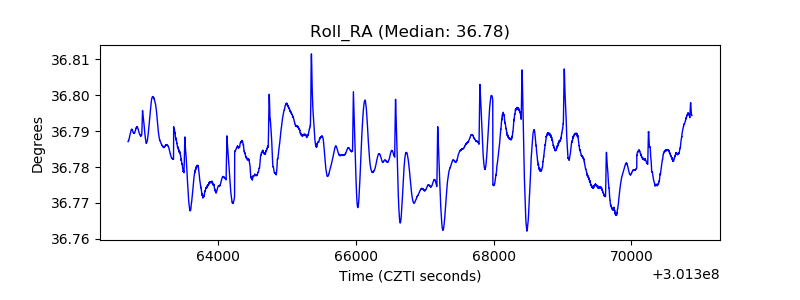 |
| Veto Counter | 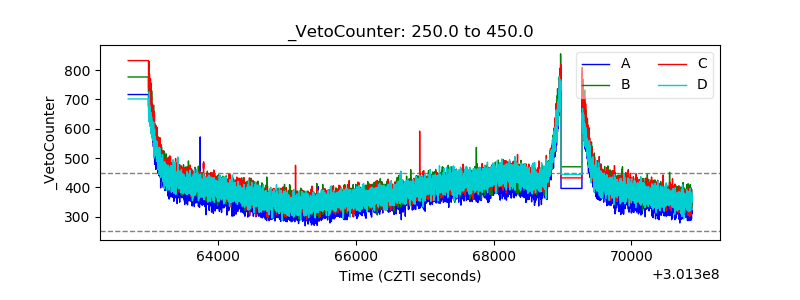 |