| Param | Original file | Final file |
|---|---|---|
| Filename | modeM0/AS1A06_003T04_9000003046_20603cztM0_level2.evt | modeM0/AS1A06_003T04_9000003046_20603cztM0_level2_quad_clean.evt |
| Size (bytes) | 566,982,720 | 103,599,360 |
| Size | 540.7 MB | 98.8 MB |
| Events in quadrant A | 3,612,934 | 664,701 |
| Events in quadrant B | 3,884,572 | 677,119 |
| Events in quadrant C | 3,679,246 | 654,820 |
| Events in quadrant D | 5,484,965 | 618,198 |
| Mode M0 | |||
|---|---|---|---|
| Quadrant | BADHDUFLAG | Total packets | Discarded packets |
| A | 0 | 15955 | 2 |
| B | 0 | 16793 | 2 |
| C | 0 | 15885 | 3 |
| D | 0 | 21404 | 2 |
| Mode SS | |||
|---|---|---|---|
| Quadrant | BADHDUFLAG | Total packets | Discarded packets |
| A | 0 | 154 | 0 |
| B | 0 | 154 | 0 |
| C | 0 | 154 | 0 |
| D | 0 | 154 | 0 |
| Mode M9 | |||
|---|---|---|---|
| Quadrant | BADHDUFLAG | Total packets | Discarded packets |
| A | 0 | 4 | 0 |
| B | 0 | 5 | 0 |
| C | 0 | 5 | 0 |
| D | 0 | 5 | 0 |
| Quadrant | Total seconds | Saturated seconds | Saturation percentage |
|---|---|---|---|
| A | 7504 | 79 | 1.052772% |
| B | 7504 | 136 | 1.812367% |
| C | 7503 | 119 | 1.586032% |
| D | 7503 | 465 | 6.197521% |
Noise dominated data is calculated using 1-second bins in cleaned event files. If a bin has >2000 counts, and if more than 50% of those come from <1% of pixels, then it is considered to be noise-dominated and hence unusable.
| Quadrant | # 1 sec bins | Bins with >0 counts | Bins with >2000 counts | High rate bins dominated by noise | Noise dominated (total time) | Noise dominated (detector-on time) | Marked lightcurve |
|---|---|---|---|---|---|---|---|
| A | 7909 | 7505 | 10 | 10 | 0.13% | 0.13% | 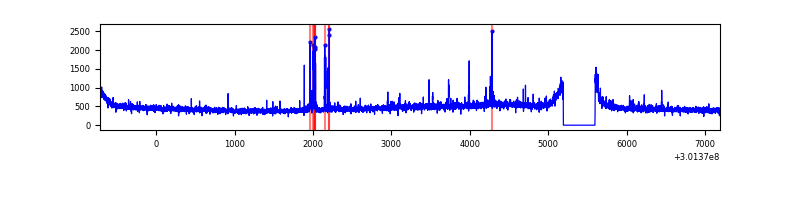 |
| B | 7909 | 7505 | 17 | 17 | 0.21% | 0.23% | 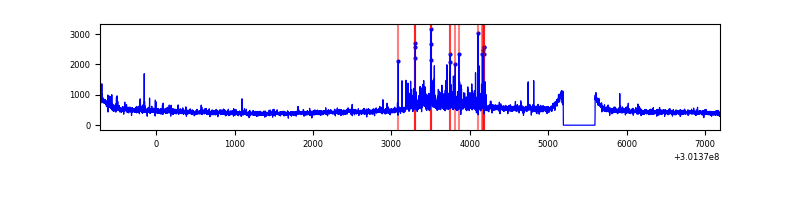 |
| C | 7908 | 7504 | 4 | 4 | 0.05% | 0.05% | 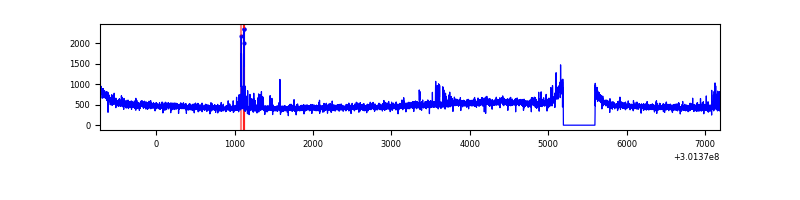 |
| D | 7908 | 7504 | 343 | 343 | 4.34% | 4.57% | 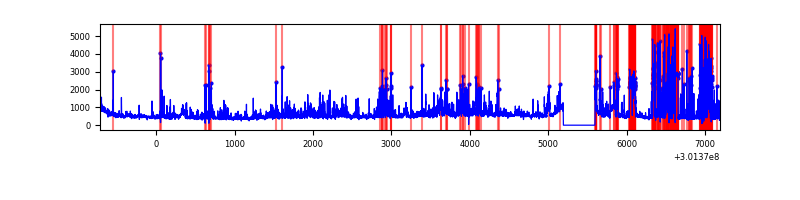 |
Top three noisy pixels from each quadrant. If the there are fewer than three noisy pixels in the level2.evt file, extra rows are filled as -1
| Pixel properties | Quadrant properties | ||||||
|---|---|---|---|---|---|---|---|
| Quadrant | DetID | PixID | Counts | Sigma | Mean | Median | Sigma |
| A | 8 | 31 | 69927 | 379.36 | 899 | 879 | 182.0 |
| A | 9 | 143 | 27633 | 146.99 | 899 | 879 | 182.0 |
| A | 12 | 16 | 26941 | 143.19 | 899 | 879 | 182.0 |
| B | 7 | 220 | 222293 | 1268.17 | 900 | 875 | 174.6 |
| B | 0 | 189 | 40722 | 228.22 | 900 | 875 | 174.6 |
| B | 0 | 197 | 39771 | 222.78 | 900 | 875 | 174.6 |
| C | 8 | 208 | 135601 | 658.89 | 865 | 871 | 204.5 |
| C | 14 | 238 | 134823 | 655.08 | 865 | 871 | 204.5 |
| C | 9 | 54 | 21993 | 103.3 | 865 | 871 | 204.5 |
| D | 5 | 222 | 1188363 | 5673.92 | 854 | 829 | 209.3 |
| D | 1 | 20 | 790647 | 3773.67 | 854 | 829 | 209.3 |
| D | 13 | 153 | 115905 | 549.82 | 854 | 829 | 209.3 |
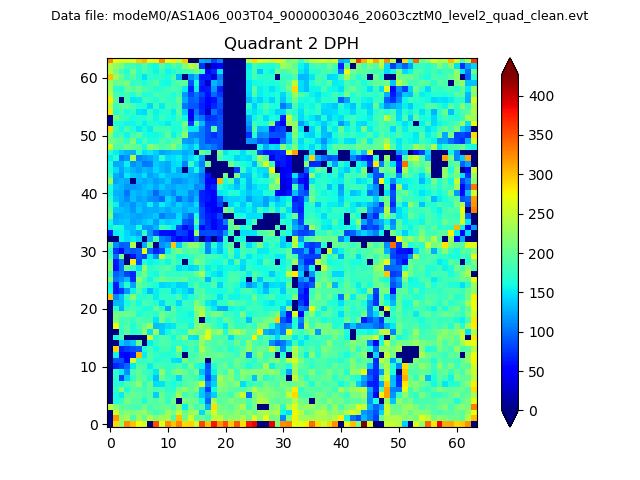
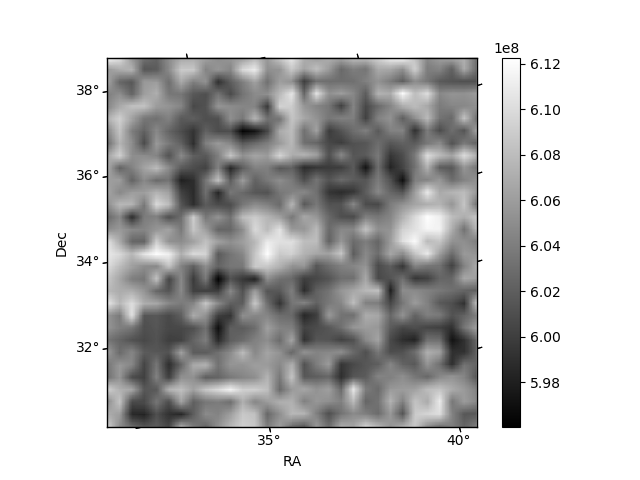
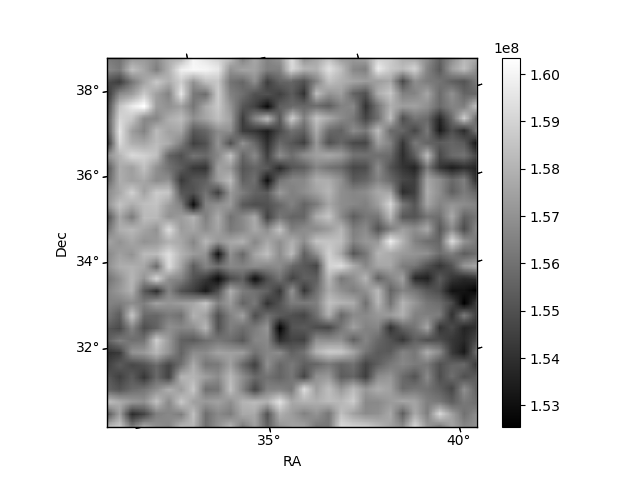
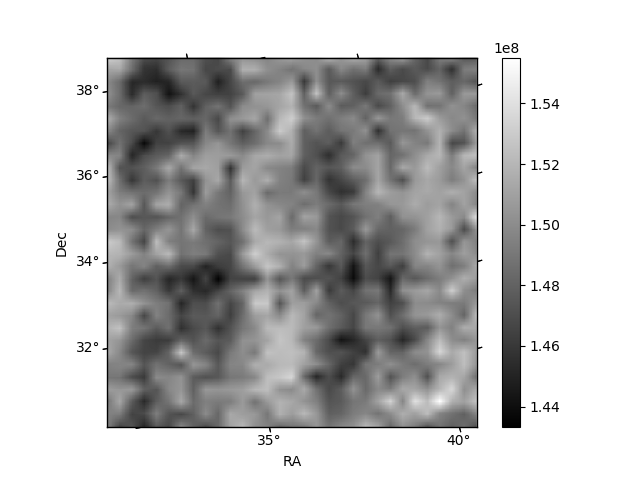
Histogram calculated using DETX and DETY for each event in the final _common_clean file
| Quadrant A | 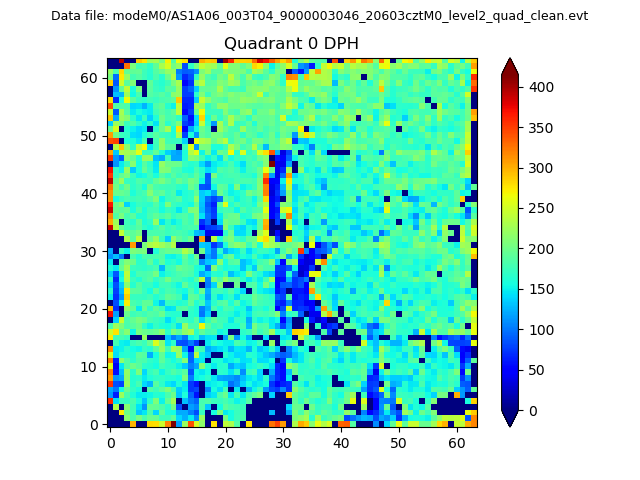 |
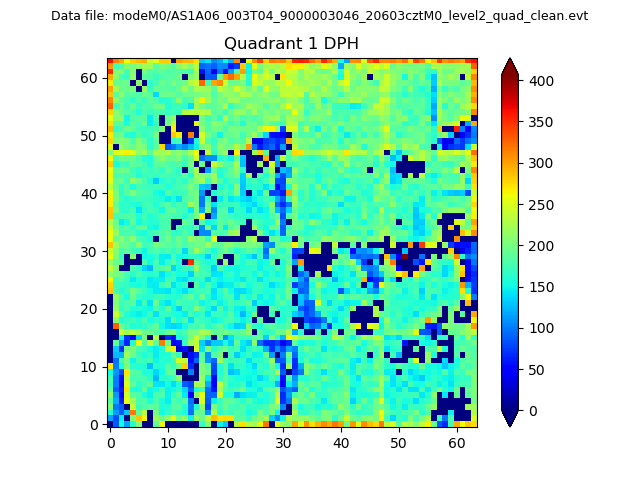 |
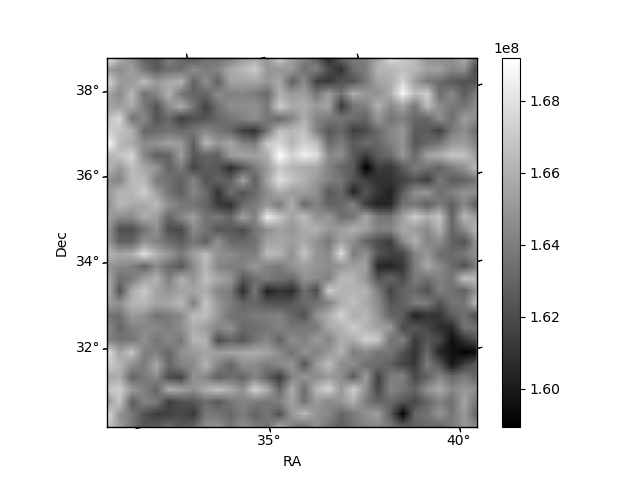
Quadrant B |
|---|---|---|---|
| Quadrant D | 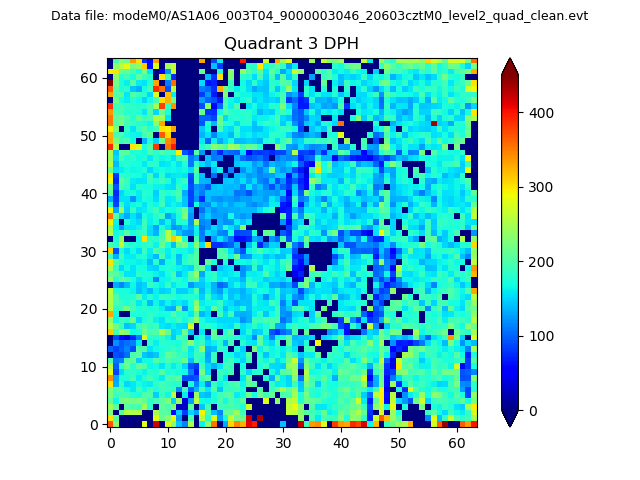 |
 |
Quadrant C |
| Plot type | Count rate plots | Images |
|---|---|---|
| Comparison with Poisson distribution Blue bars denote a histogram of data divided into 1 sec bins. Red curve is a Poisson curve with rate = median count rate of data. |
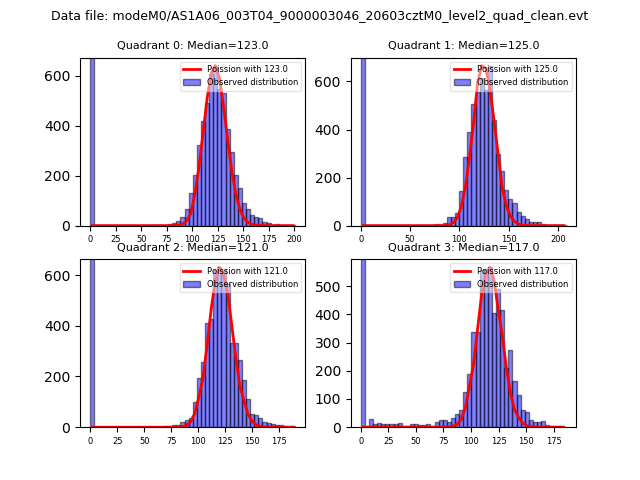 |
 |
| Quadrant-wise count rates Data is divided into 100 sec bins |
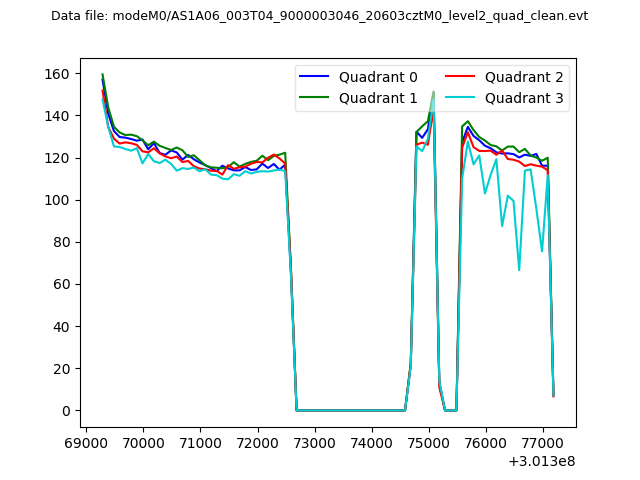 |
|
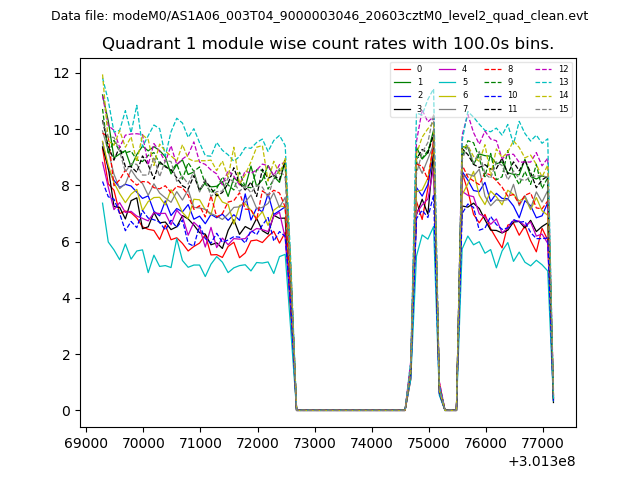
| Module-wise count rates for Quadrant A Data is divided into 100 sec bins |
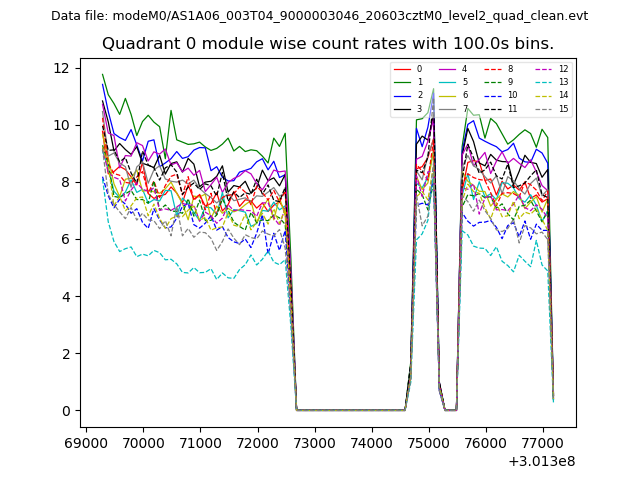 |
 |
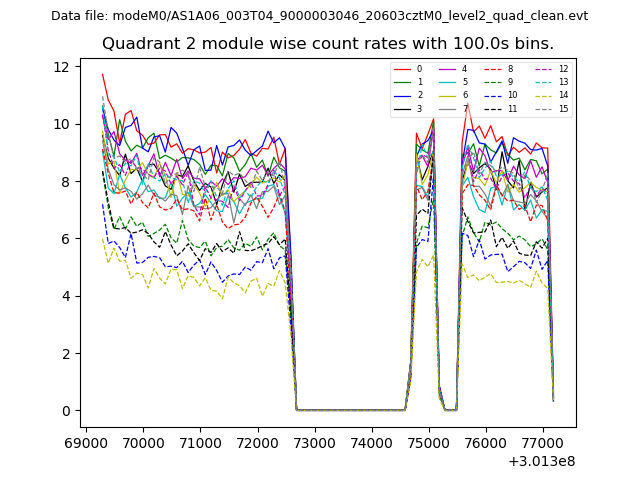
| Module-wise count rates for Quadrant B Data is divided into 100 sec bins |
 |
 |
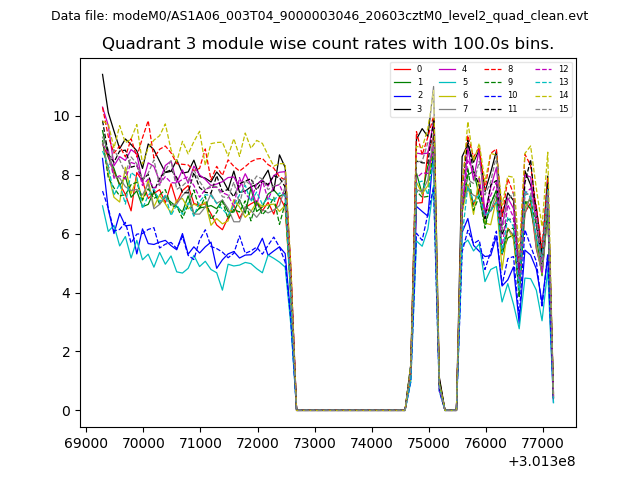
| Module-wise count rates for Quadrant C Data is divided into 100 sec bins |
 |
 |
| Module-wise count rates for Quadrant D Data is divided into 100 sec bins |
 |
 |
| Parameter | Plot |
|---|---|
| CZT HV Monitor | 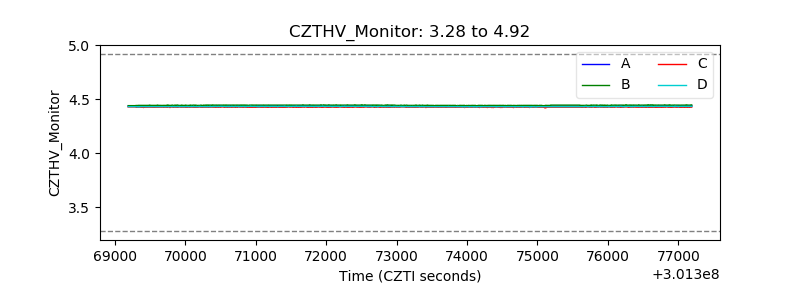 |
| D_VDD | 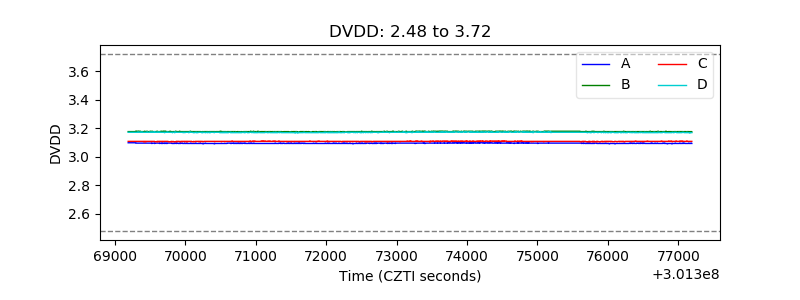 |
| Temperature 1 | 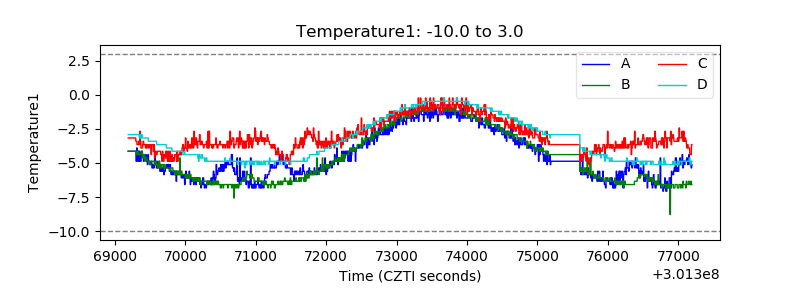 |
| Veto HV Monitor |  |
| Veto LLD | 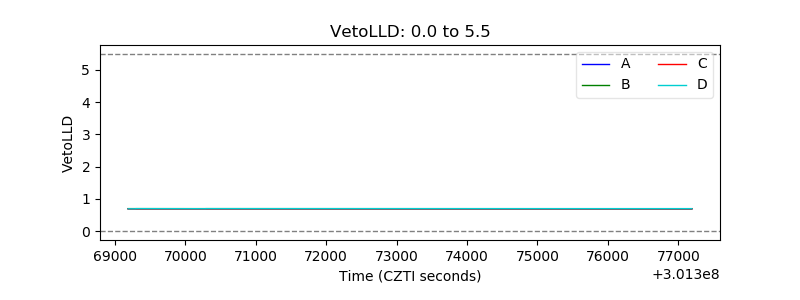 |
| Alpha Counter | 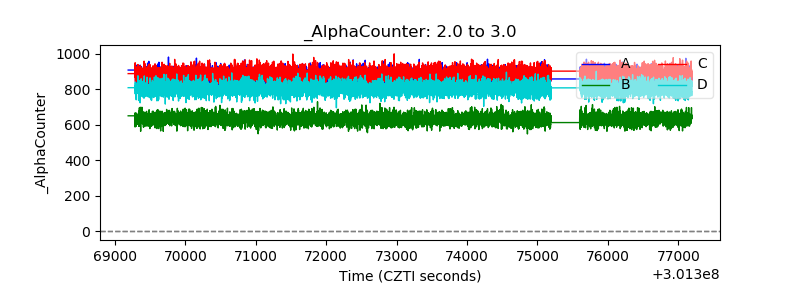 |
| _CPM_Rate | 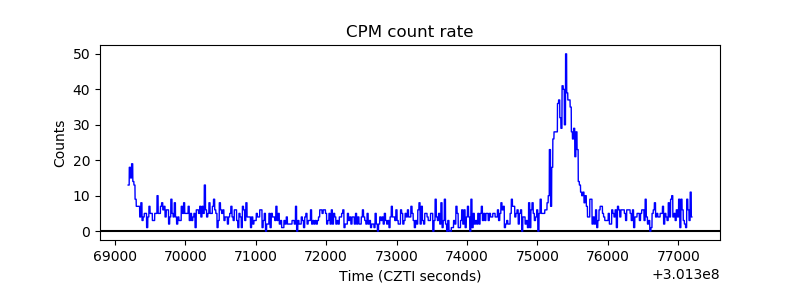 |
| CZT Counter | 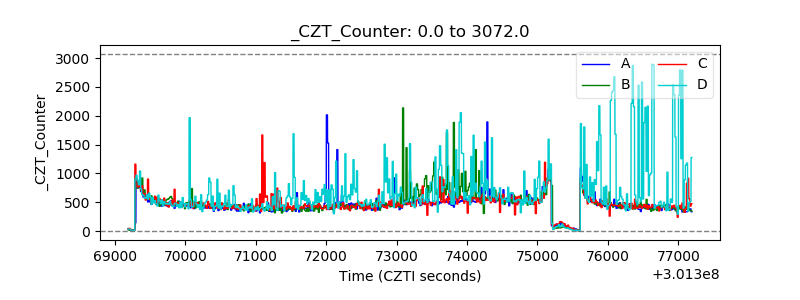 |
| +2.5 Volts monitor | 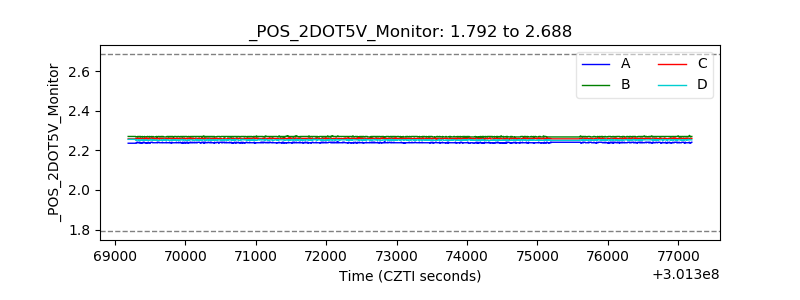 |
| +5 Volts monitor |  |
| _ROLL_ROT | 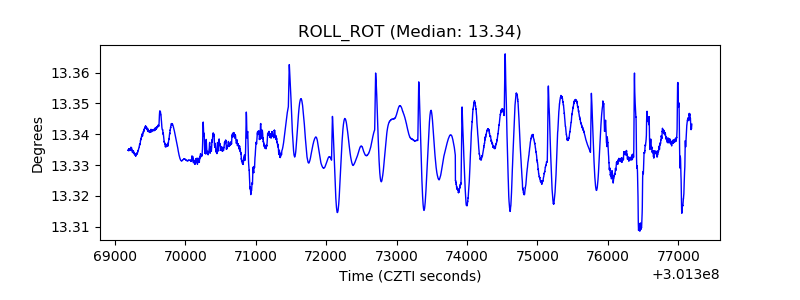 |
| _Roll_DEC | 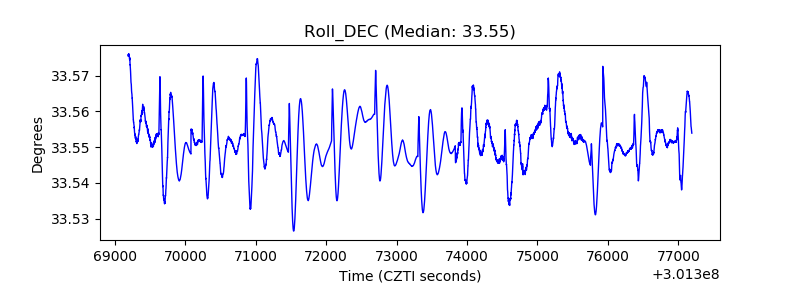 |
| _Roll_RA | 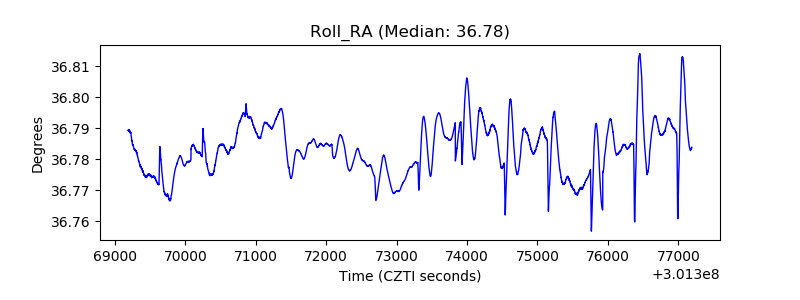 |
| Veto Counter | 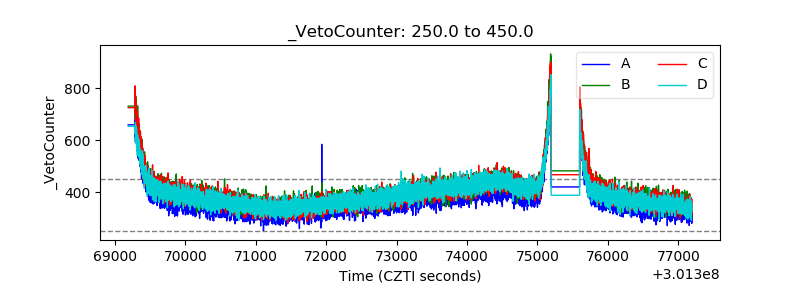 |