| Param | Original file | Final file |
|---|---|---|
| Filename | modeM0/AS1A06_003T04_9000003046_20605cztM0_level2.evt | modeM0/AS1A06_003T04_9000003046_20605cztM0_level2_quad_clean.evt |
| Size (bytes) | 972,239,040 | 159,785,280 |
| Size | 927.2 MB | 152.4 MB |
| Events in quadrant A | 5,787,631 | 1,014,536 |
| Events in quadrant B | 6,419,942 | 1,036,953 |
| Events in quadrant C | 6,120,252 | 999,373 |
| Events in quadrant D | 10,271,819 | 924,488 |
| Mode M0 | |||
|---|---|---|---|
| Quadrant | BADHDUFLAG | Total packets | Discarded packets |
| A | 0 | 25729 | 2 |
| B | 0 | 27668 | 2 |
| C | 0 | 26559 | 2 |
| D | 0 | 39115 | 2 |
| Mode SS | |||
|---|---|---|---|
| Quadrant | BADHDUFLAG | Total packets | Discarded packets |
| A | 0 | 252 | 0 |
| B | 0 | 252 | 0 |
| C | 0 | 252 | 0 |
| D | 0 | 252 | 0 |
| Mode M9 | |||
|---|---|---|---|
| Quadrant | BADHDUFLAG | Total packets | Discarded packets |
| A | 0 | 14 | 0 |
| B | 0 | 14 | 0 |
| C | 0 | 14 | 0 |
| D | 0 | 14 | 0 |
| Quadrant | Total seconds | Saturated seconds | Saturation percentage |
|---|---|---|---|
| A | 12498 | 92 | 0.736118% |
| B | 12499 | 161 | 1.288103% |
| C | 12499 | 124 | 0.992079% |
| D | 12499 | 1185 | 9.480758% |
Noise dominated data is calculated using 1-second bins in cleaned event files. If a bin has >2000 counts, and if more than 50% of those come from <1% of pixels, then it is considered to be noise-dominated and hence unusable.
| Quadrant | # 1 sec bins | Bins with >0 counts | Bins with >2000 counts | High rate bins dominated by noise | Noise dominated (total time) | Noise dominated (detector-on time) | Marked lightcurve |
|---|---|---|---|---|---|---|---|
| A | 13778 | 12500 | 6 | 6 | 0.04% | 0.05% | 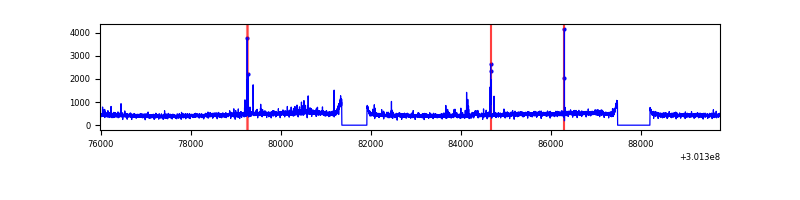 |
| B | 13779 | 12501 | 37 | 37 | 0.27% | 0.30% | 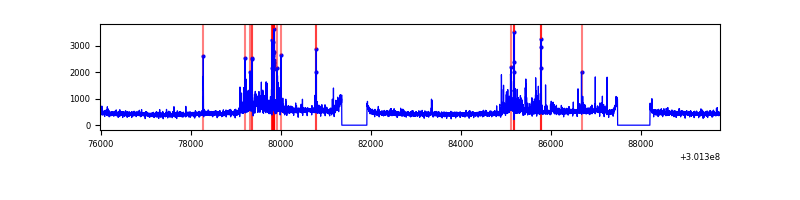 |
| C | 13779 | 12501 | 0 | 0 | 0.00% | 0.00% | 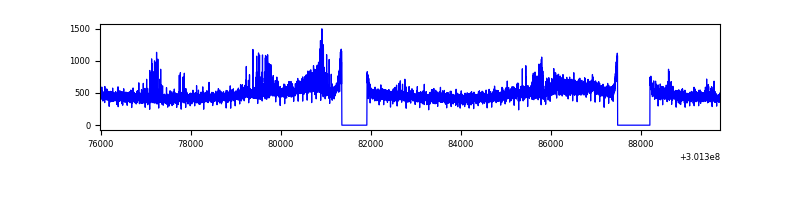 |
| D | 13779 | 12501 | 899 | 899 | 6.52% | 7.19% | 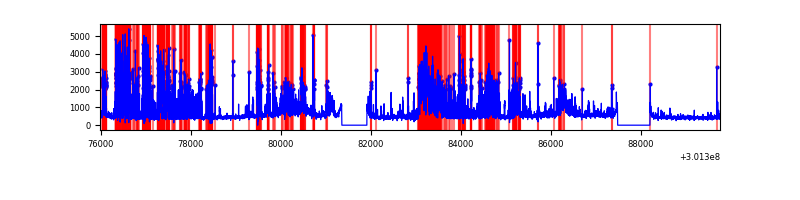 |
Top three noisy pixels from each quadrant. If the there are fewer than three noisy pixels in the level2.evt file, extra rows are filled as -1
| Pixel properties | Quadrant properties | ||||||
|---|---|---|---|---|---|---|---|
| Quadrant | DetID | PixID | Counts | Sigma | Mean | Median | Sigma |
| A | 5 | 16 | 80160 | 265.9 | 1472 | 1441 | 296.0 |
| A | 15 | 174 | 17515 | 54.3 | 1472 | 1441 | 296.0 |
| A | 12 | 16 | 16555 | 51.05 | 1472 | 1441 | 296.0 |
| B | 7 | 220 | 321291 | 1129.29 | 1471 | 1435 | 283.2 |
| B | 0 | 244 | 73646 | 254.95 | 1471 | 1435 | 283.2 |
| B | 0 | 190 | 70552 | 244.03 | 1471 | 1435 | 283.2 |
| C | 8 | 208 | 370292 | 1110.06 | 1412 | 1417 | 332.3 |
| C | 14 | 238 | 218531 | 653.36 | 1412 | 1417 | 332.3 |
| C | 3 | 233 | 28548 | 81.65 | 1412 | 1417 | 332.3 |
| D | 5 | 222 | 2977584 | 8846.58 | 1380 | 1340 | 336.4 |
| D | 1 | 52 | 712861 | 2114.92 | 1380 | 1340 | 336.4 |
| D | 1 | 20 | 631102 | 1871.9 | 1380 | 1340 | 336.4 |
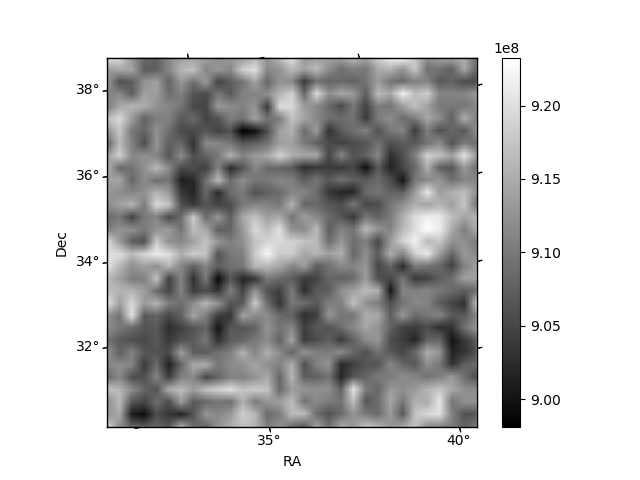
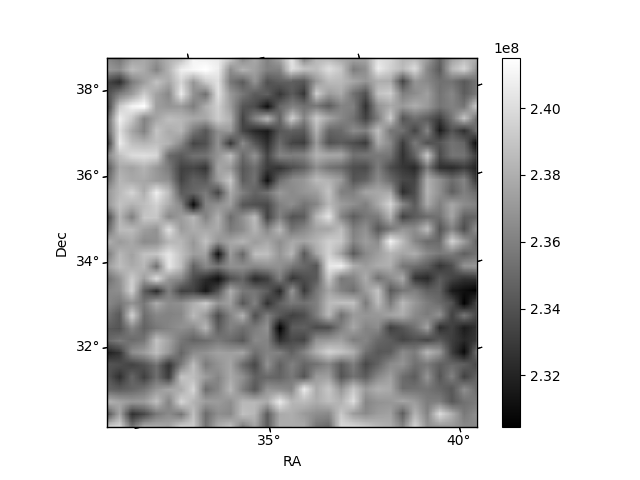
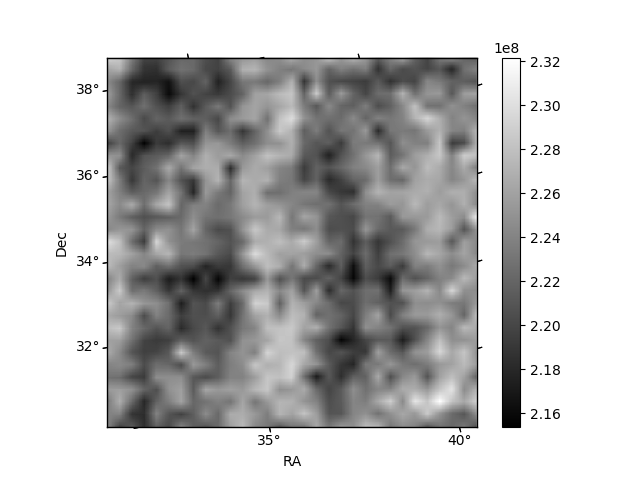
Histogram calculated using DETX and DETY for each event in the final _common_clean file
| Quadrant A | 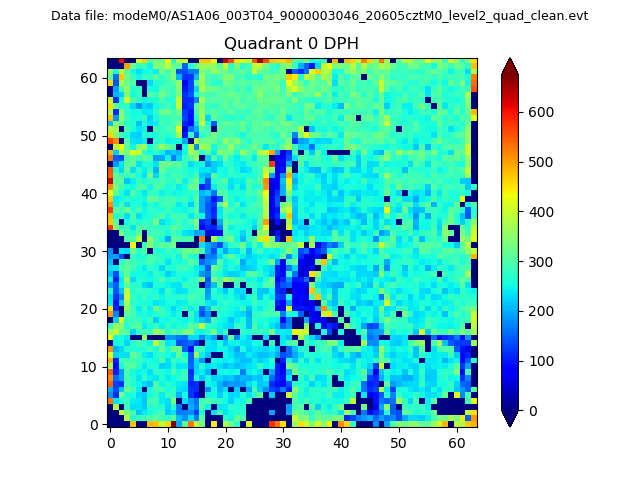 |
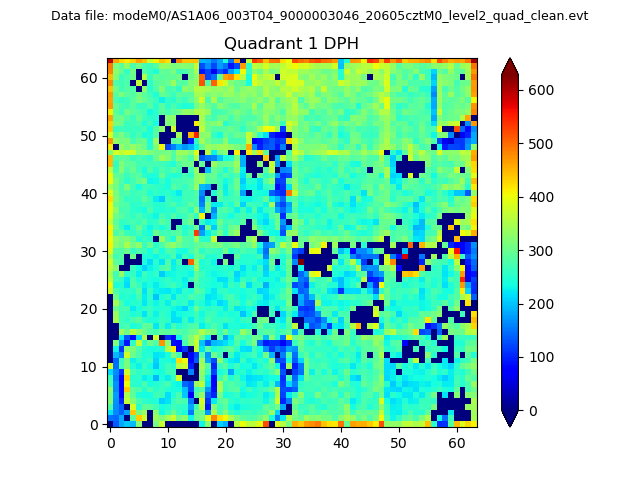 |
Quadrant B |
|---|---|---|---|
| Quadrant D | 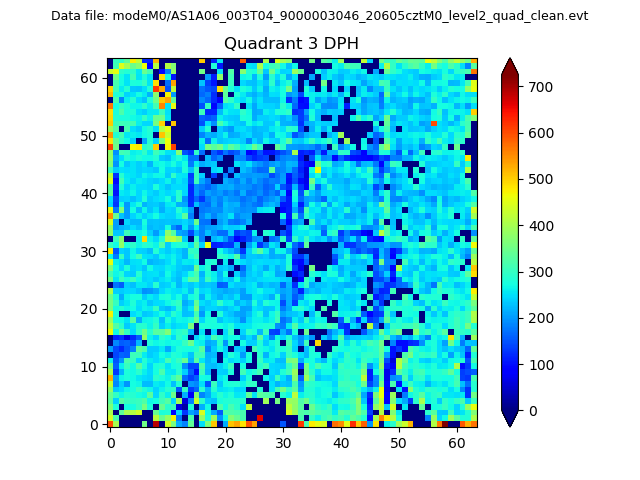 |
 |
Quadrant C |
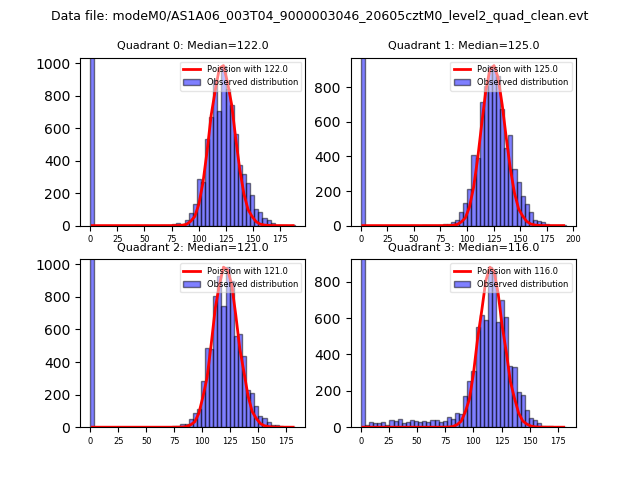
| Plot type | Count rate plots | Images |
|---|---|---|
| Comparison with Poisson distribution Blue bars denote a histogram of data divided into 1 sec bins. Red curve is a Poisson curve with rate = median count rate of data. |
 |
 |
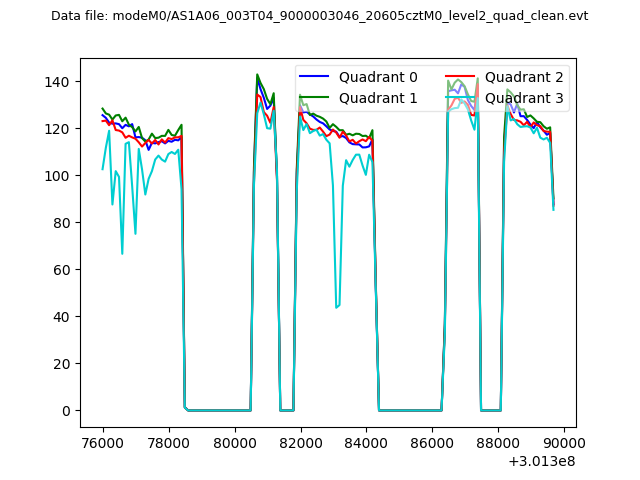
| Quadrant-wise count rates Data is divided into 100 sec bins |
 |
|
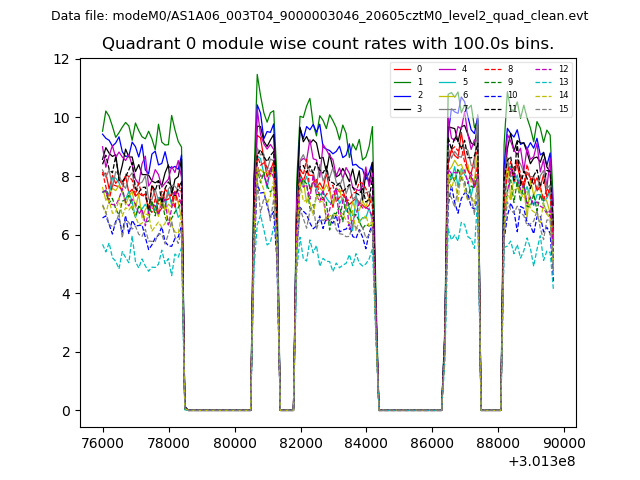
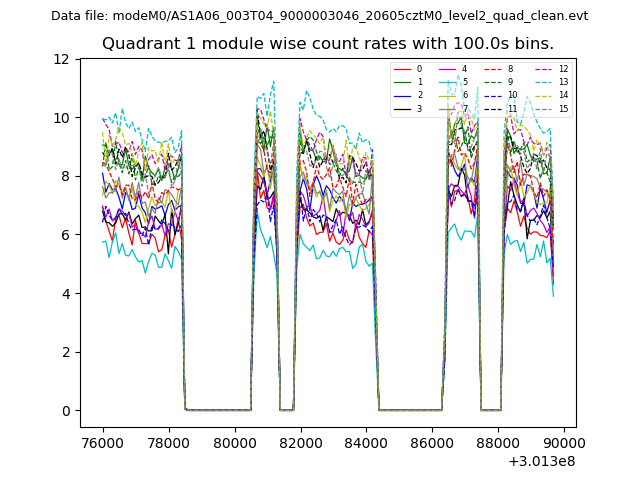
| Module-wise count rates for Quadrant A Data is divided into 100 sec bins |
 |
 |
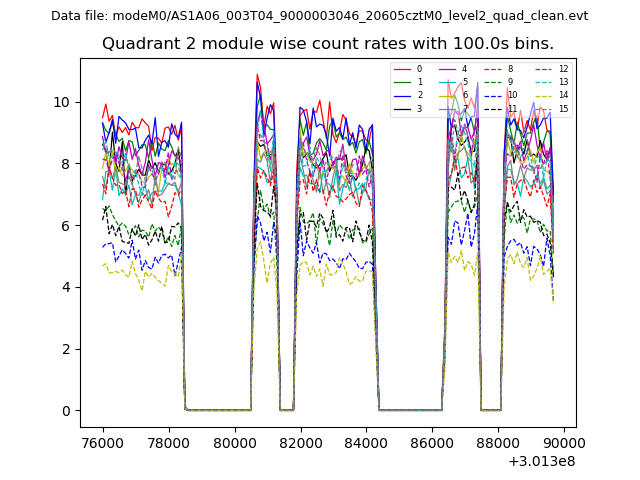
| Module-wise count rates for Quadrant B Data is divided into 100 sec bins |
 |
 |
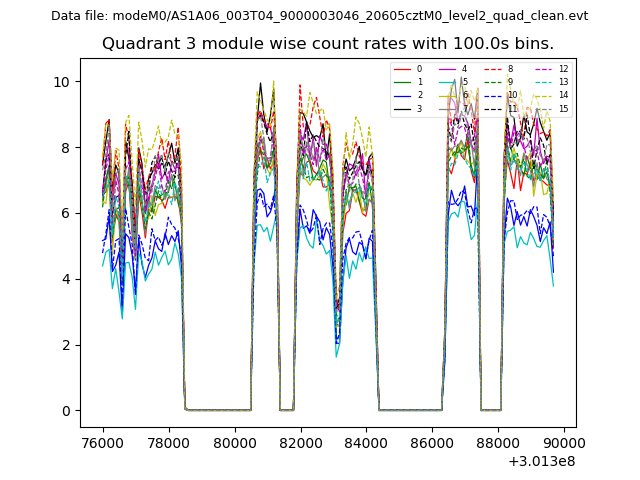
| Module-wise count rates for Quadrant C Data is divided into 100 sec bins |
 |
 |
| Module-wise count rates for Quadrant D Data is divided into 100 sec bins |
 |
 |
| Parameter | Plot |
|---|---|
| CZT HV Monitor | 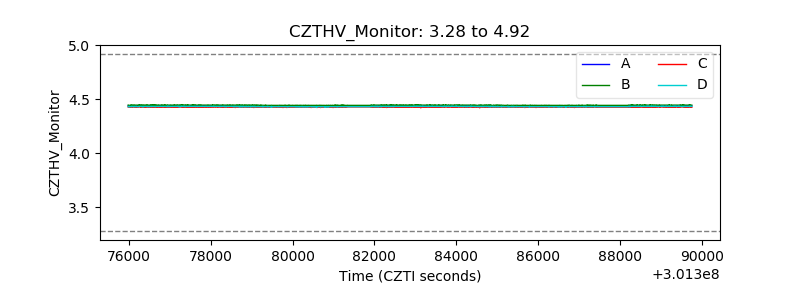 |
| D_VDD | 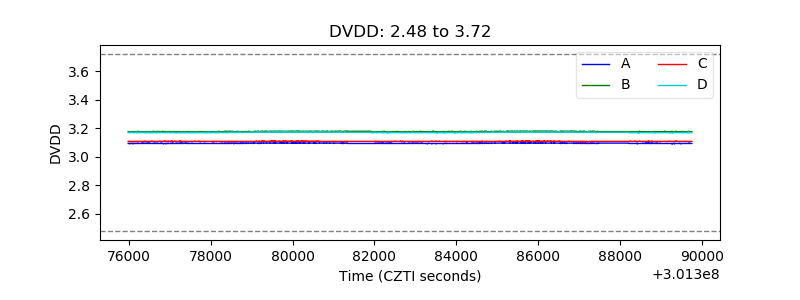 |
| Temperature 1 | 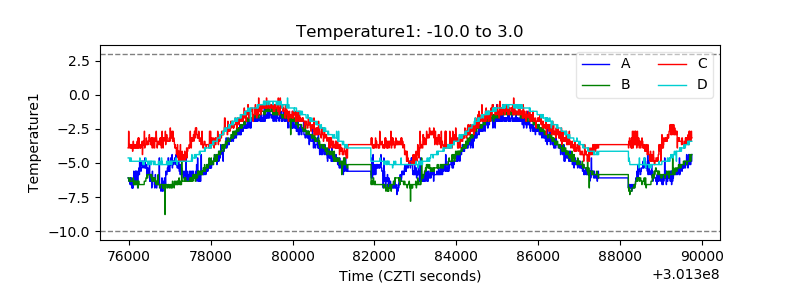 |
| Veto HV Monitor | 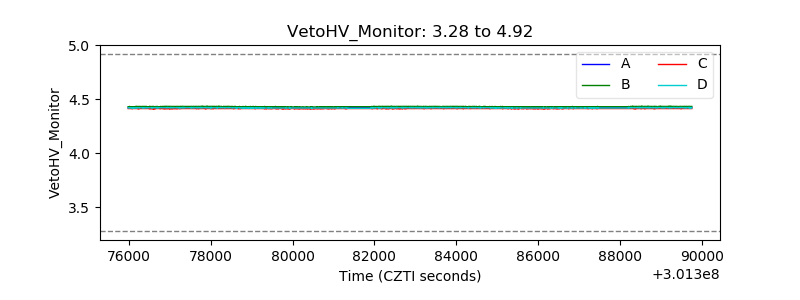 |
| Veto LLD | 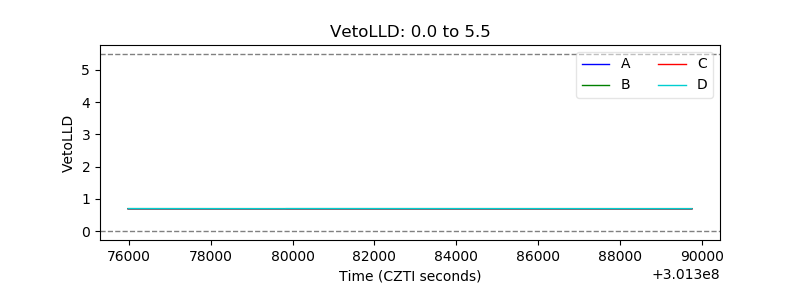 |
| Alpha Counter | 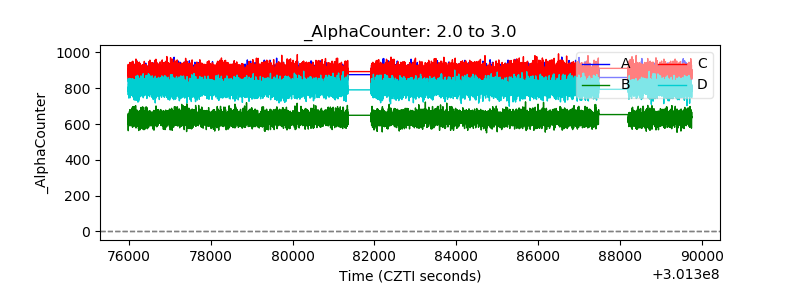 |
| _CPM_Rate | 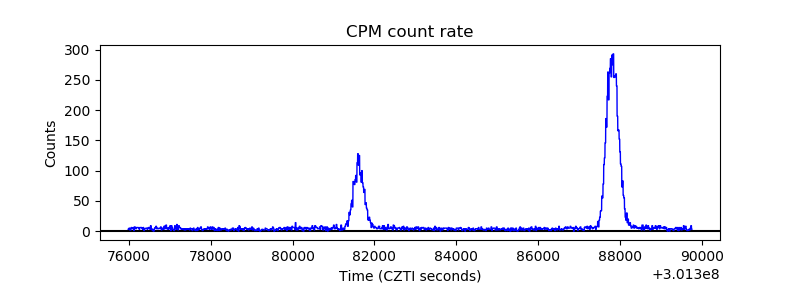 |
| CZT Counter | 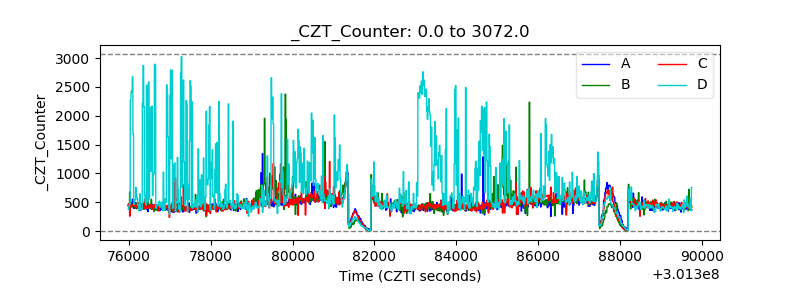 |
| +2.5 Volts monitor |  |
| +5 Volts monitor |  |
| _ROLL_ROT | 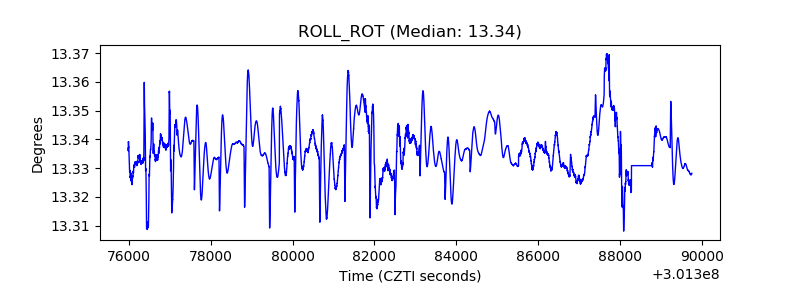 |
| _Roll_DEC |  |
| _Roll_RA | 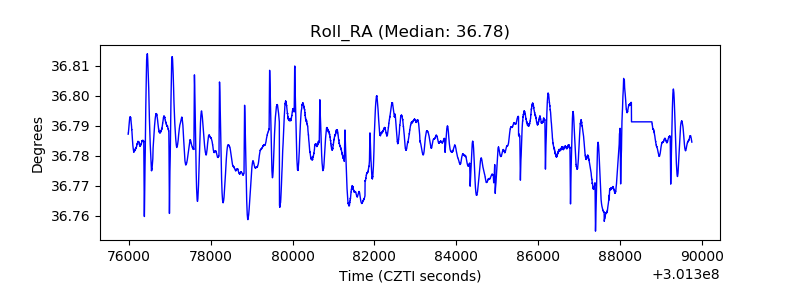 |
| Veto Counter | 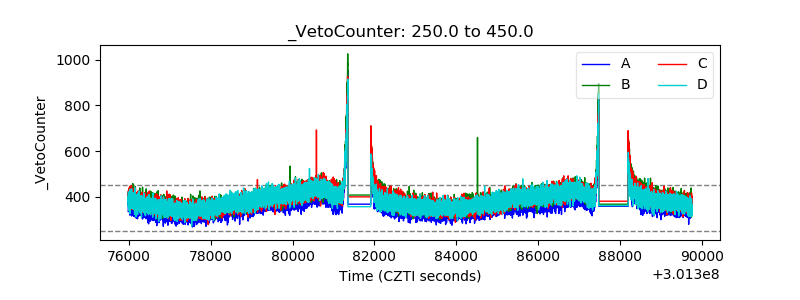 |