| Param | Original file | Final file |
|---|---|---|
| Filename | modeM0/AS1A06_003T04_9000003046_20607cztM0_level2.evt | modeM0/AS1A06_003T04_9000003046_20607cztM0_level2_quad_clean.evt |
| Size (bytes) | 440,277,120 | 80,501,760 |
| Size | 419.9 MB | 76.8 MB |
| Events in quadrant A | 2,903,352 | 510,850 |
| Events in quadrant B | 3,359,780 | 517,905 |
| Events in quadrant C | 3,117,482 | 497,994 |
| Events in quadrant D | 3,537,762 | 483,994 |
| Mode M0 | |||
|---|---|---|---|
| Quadrant | BADHDUFLAG | Total packets | Discarded packets |
| A | 0 | 12409 | 1 |
| B | 0 | 13681 | 1 |
| C | 0 | 12918 | 1 |
| D | 0 | 14429 | 1 |
| Mode SS | |||
|---|---|---|---|
| Quadrant | BADHDUFLAG | Total packets | Discarded packets |
| A | 0 | 124 | 0 |
| B | 0 | 124 | 0 |
| C | 0 | 124 | 0 |
| D | 0 | 124 | 0 |
| Mode M9 | |||
|---|---|---|---|
| Quadrant | BADHDUFLAG | Total packets | Discarded packets |
| A | 0 | 11 | 0 |
| B | 0 | 11 | 0 |
| C | 0 | 11 | 0 |
| D | 0 | 11 | 0 |
| Quadrant | Total seconds | Saturated seconds | Saturation percentage |
|---|---|---|---|
| A | 6115 | 33 | 0.539657% |
| B | 6116 | 98 | 1.602354% |
| C | 6115 | 51 | 0.834015% |
| D | 6115 | 120 | 1.962388% |
Noise dominated data is calculated using 1-second bins in cleaned event files. If a bin has >2000 counts, and if more than 50% of those come from <1% of pixels, then it is considered to be noise-dominated and hence unusable.
| Quadrant | # 1 sec bins | Bins with >0 counts | Bins with >2000 counts | High rate bins dominated by noise | Noise dominated (total time) | Noise dominated (detector-on time) | Marked lightcurve |
|---|---|---|---|---|---|---|---|
| A | 7175 | 6116 | 0 | 0 | 0.00% | 0.00% | 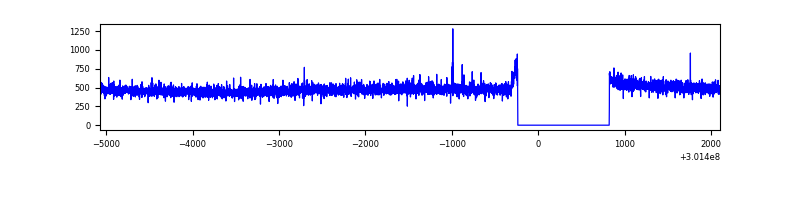 |
| B | 7176 | 6117 | 35 | 35 | 0.49% | 0.57% | 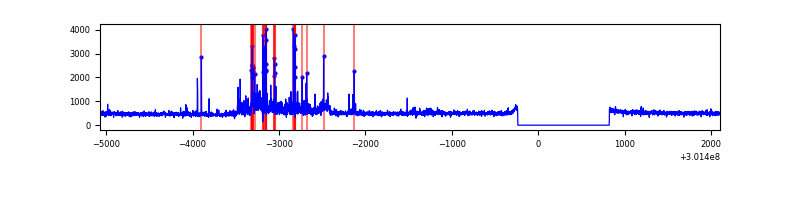 |
| C | 7175 | 6116 | 0 | 0 | 0.00% | 0.00% | 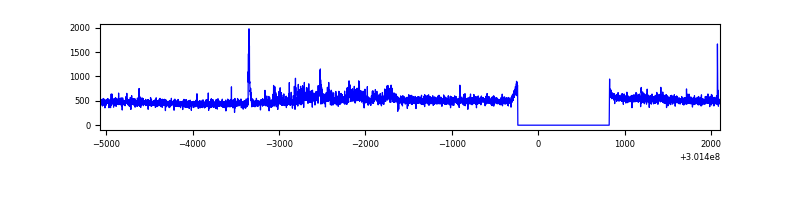 |
| D | 7175 | 6116 | 84 | 84 | 1.17% | 1.37% | 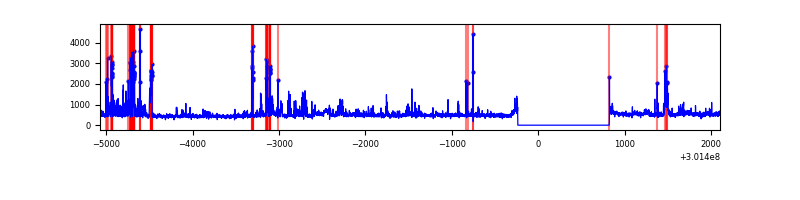 |
Top three noisy pixels from each quadrant. If the there are fewer than three noisy pixels in the level2.evt file, extra rows are filled as -1
| Pixel properties | Quadrant properties | ||||||
|---|---|---|---|---|---|---|---|
| Quadrant | DetID | PixID | Counts | Sigma | Mean | Median | Sigma |
| A | 8 | 205 | 10646 | 64.97 | 750 | 733 | 152.6 |
| A | 5 | 16 | 7762 | 46.07 | 750 | 733 | 152.6 |
| A | 0 | 226 | 6414 | 37.23 | 750 | 733 | 152.6 |
| B | 7 | 220 | 249625 | 1753.29 | 744 | 725 | 142.0 |
| B | 0 | 189 | 42457 | 293.97 | 744 | 725 | 142.0 |
| B | 4 | 216 | 32867 | 226.41 | 744 | 725 | 142.0 |
| C | 3 | 233 | 115251 | 690.2 | 712 | 717 | 165.9 |
| C | 8 | 208 | 113027 | 676.8 | 712 | 717 | 165.9 |
| C | 14 | 238 | 111715 | 668.89 | 712 | 717 | 165.9 |
| D | 5 | 222 | 367633 | 2059.47 | 726 | 704 | 178.2 |
| D | 1 | 20 | 123737 | 690.55 | 726 | 704 | 178.2 |
| D | 1 | 52 | 109432 | 610.26 | 726 | 704 | 178.2 |
Histogram calculated using DETX and DETY for each event in the final _common_clean file
| Quadrant A |  |
 |
Quadrant B |
|---|---|---|---|
| Quadrant D |  |
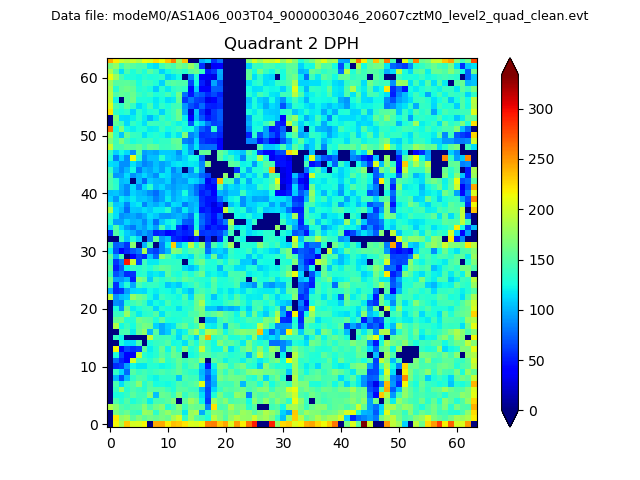 |
Quadrant C |
| Plot type | Count rate plots | Images |
|---|---|---|
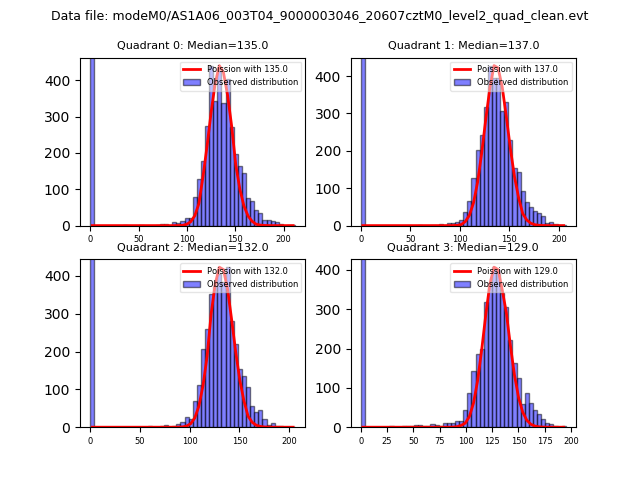
| Comparison with Poisson distribution Blue bars denote a histogram of data divided into 1 sec bins. Red curve is a Poisson curve with rate = median count rate of data. |
 |
 |
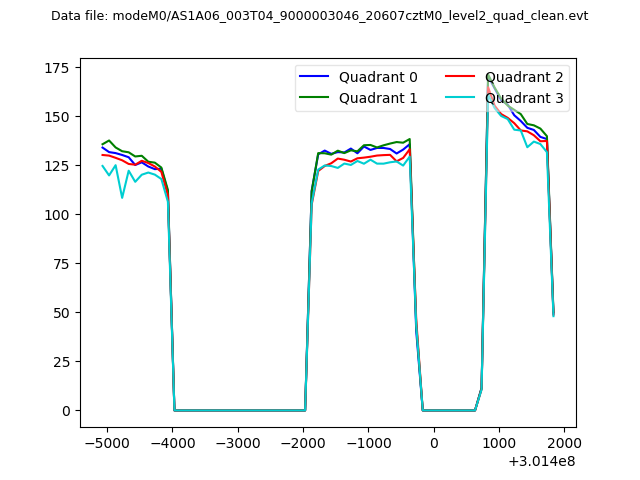
| Quadrant-wise count rates Data is divided into 100 sec bins |
 |
|
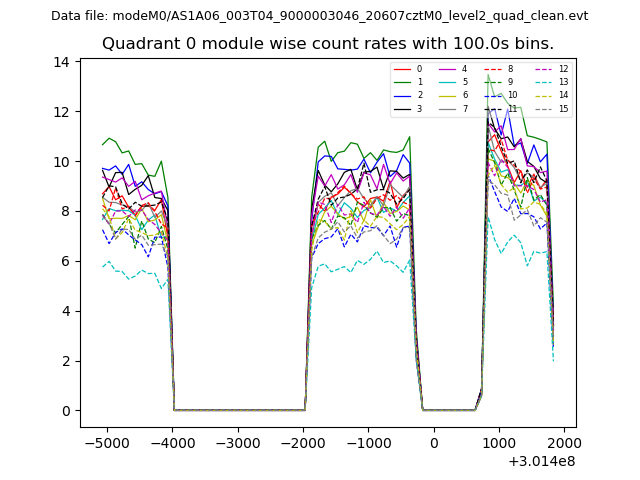
| Module-wise count rates for Quadrant A Data is divided into 100 sec bins |
 |
 |
| Module-wise count rates for Quadrant B Data is divided into 100 sec bins |
 |
 |
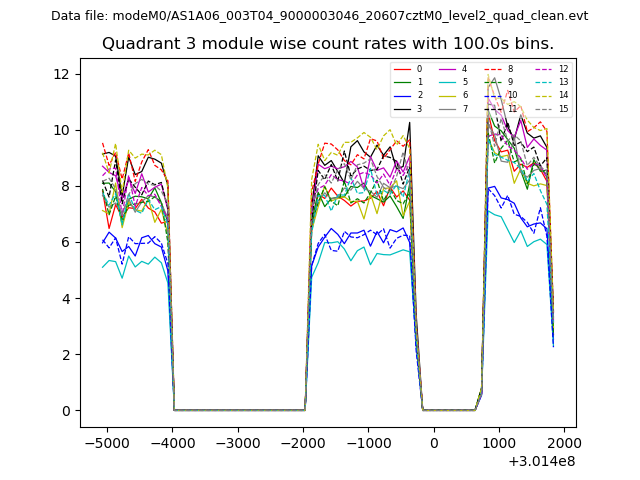
| Module-wise count rates for Quadrant C Data is divided into 100 sec bins |
 |
 |
| Module-wise count rates for Quadrant D Data is divided into 100 sec bins |
 |
 |
| Parameter | Plot |
|---|---|
| CZT HV Monitor |  |
| D_VDD | 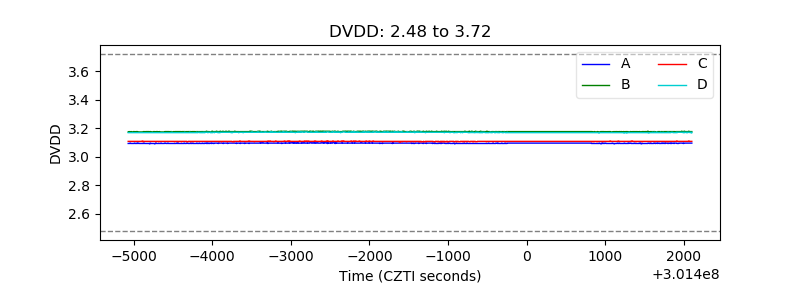 |
| Temperature 1 | 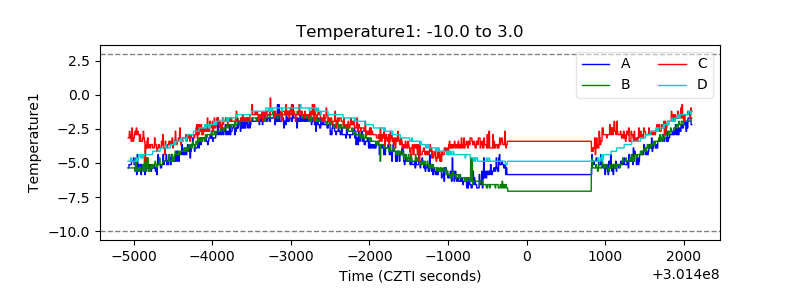 |
| Veto HV Monitor | 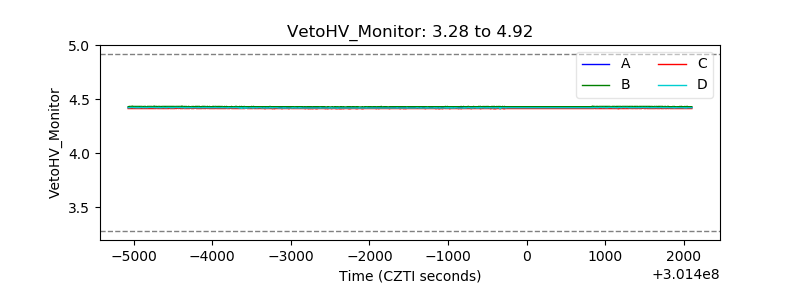 |
| Veto LLD | 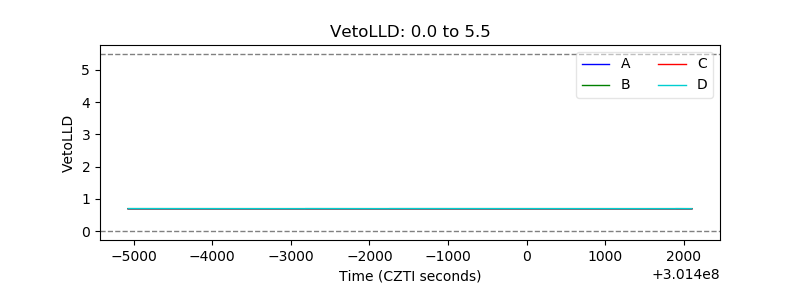 |
| Alpha Counter | 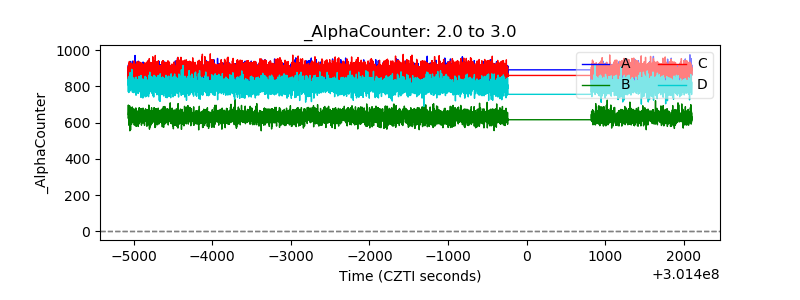 |
| _CPM_Rate | 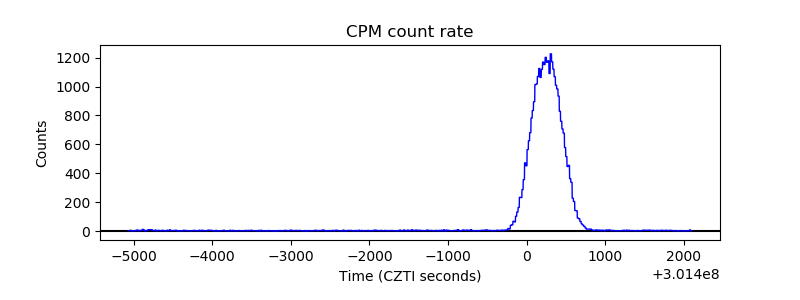 |
| CZT Counter | 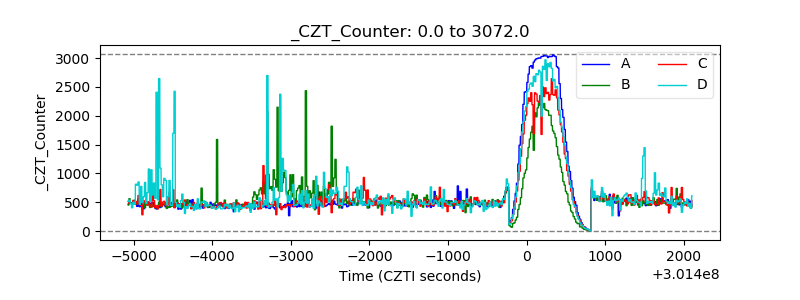 |
| +2.5 Volts monitor |  |
| +5 Volts monitor | 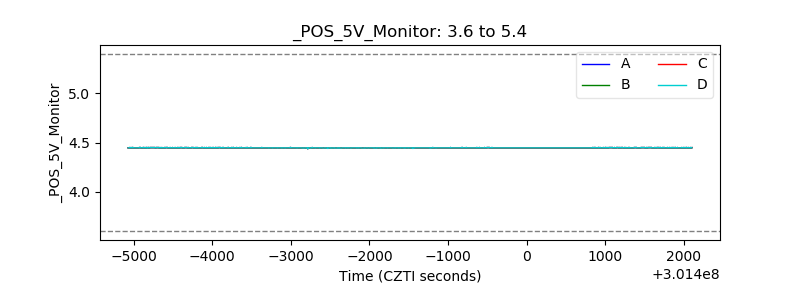 |
| _ROLL_ROT | 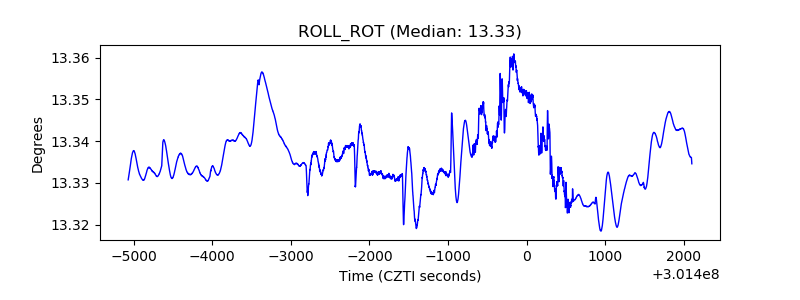 |
| _Roll_DEC | 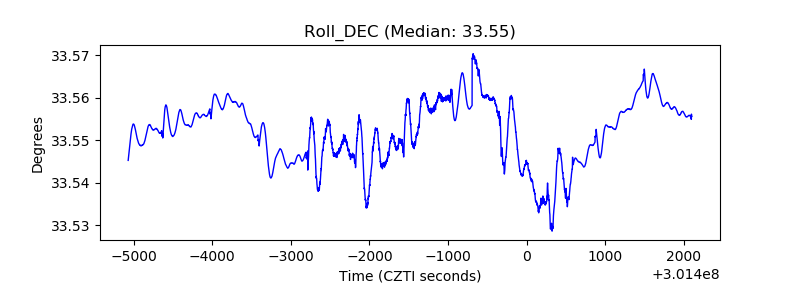 |
| _Roll_RA | 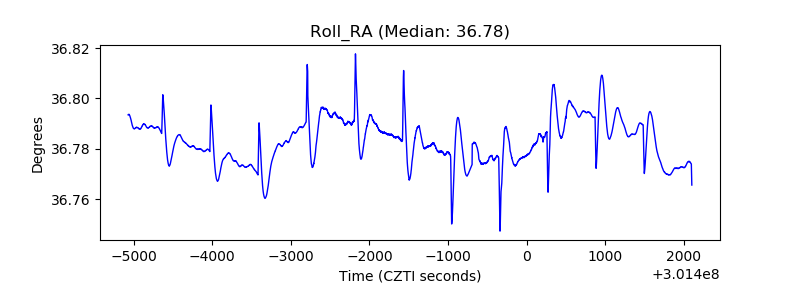 |
| Veto Counter | 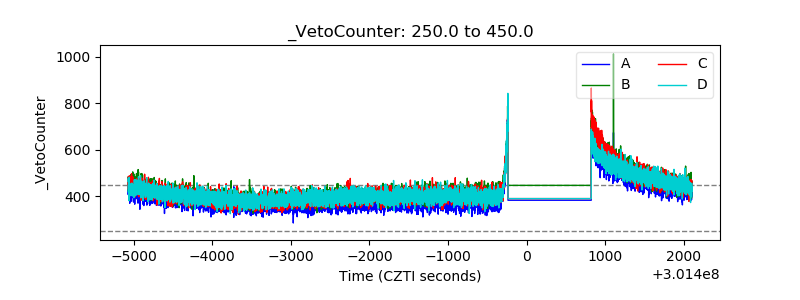 |