| Param | Original file | Final file |
|---|---|---|
| Filename | modeM0/AS1A06_003T04_9000003046_20611cztM0_level2.evt | modeM0/AS1A06_003T04_9000003046_20611cztM0_level2_quad_clean.evt |
| Size (bytes) | 502,585,920 | 62,213,760 |
| Size | 479.3 MB | 59.3 MB |
| Events in quadrant A | 3,323,094 | 372,549 |
| Events in quadrant B | 3,662,708 | 375,999 |
| Events in quadrant C | 3,477,790 | 360,973 |
| Events in quadrant D | 4,350,489 | 354,929 |
| Mode M0 | |||
|---|---|---|---|
| Quadrant | BADHDUFLAG | Total packets | Discarded packets |
| A | 0 | 13649 | 1 |
| B | 0 | 14747 | 1 |
| C | 0 | 14206 | 1 |
| D | 0 | 16889 | 2 |
| Mode SS | |||
|---|---|---|---|
| Quadrant | BADHDUFLAG | Total packets | Discarded packets |
| A | 0 | 122 | 0 |
| B | 0 | 122 | 0 |
| C | 0 | 122 | 0 |
| D | 0 | 122 | 0 |
| Mode M9 | |||
|---|---|---|---|
| Quadrant | BADHDUFLAG | Total packets | Discarded packets |
| A | 0 | 13 | 0 |
| B | 0 | 13 | 0 |
| C | 0 | 13 | 0 |
| D | 0 | 13 | 0 |
| Quadrant | Total seconds | Saturated seconds | Saturation percentage |
|---|---|---|---|
| A | 6000 | 100 | 1.666667% |
| B | 6001 | 138 | 2.299617% |
| C | 6001 | 119 | 1.983003% |
| D | 6000 | 173 | 2.883333% |
Noise dominated data is calculated using 1-second bins in cleaned event files. If a bin has >2000 counts, and if more than 50% of those come from <1% of pixels, then it is considered to be noise-dominated and hence unusable.
| Quadrant | # 1 sec bins | Bins with >0 counts | Bins with >2000 counts | High rate bins dominated by noise | Noise dominated (total time) | Noise dominated (detector-on time) | Marked lightcurve |
|---|---|---|---|---|---|---|---|
| A | 7310 | 6001 | 4 | 4 | 0.05% | 0.07% | 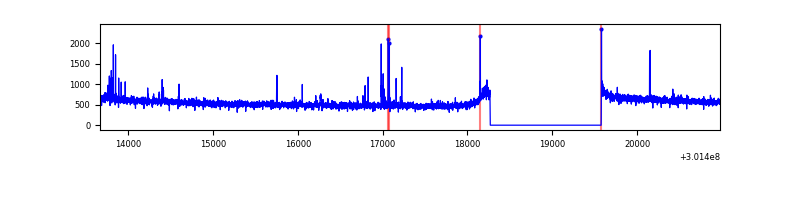 |
| B | 7311 | 6002 | 14 | 14 | 0.19% | 0.23% |  |
| C | 7311 | 6002 | 0 | 0 | 0.00% | 0.00% | 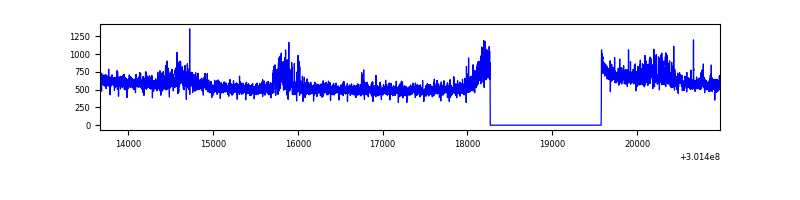 |
| D | 7310 | 6001 | 68 | 68 | 0.93% | 1.13% | 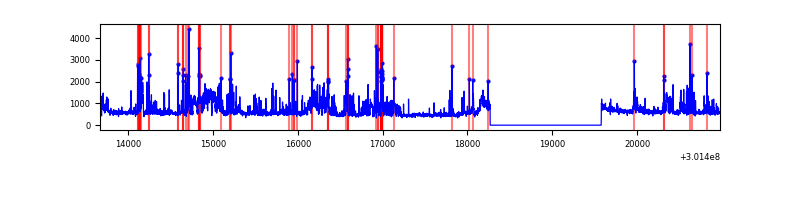 |
Top three noisy pixels from each quadrant. If the there are fewer than three noisy pixels in the level2.evt file, extra rows are filled as -1
| Pixel properties | Quadrant properties | ||||||
|---|---|---|---|---|---|---|---|
| Quadrant | DetID | PixID | Counts | Sigma | Mean | Median | Sigma |
| A | 5 | 16 | 61649 | 362.47 | 845 | 830 | 167.8 |
| A | 0 | 226 | 7419 | 39.27 | 845 | 830 | 167.8 |
| A | 12 | 194 | 6184 | 31.91 | 845 | 830 | 167.8 |
| B | 7 | 220 | 175775 | 1142.32 | 834 | 817 | 153.2 |
| B | 15 | 33 | 52884 | 339.95 | 834 | 817 | 153.2 |
| B | 0 | 190 | 39458 | 252.29 | 834 | 817 | 153.2 |
| C | 8 | 208 | 180154 | 969.75 | 804 | 811 | 184.9 |
| C | 14 | 238 | 128151 | 688.55 | 804 | 811 | 184.9 |
| C | 3 | 233 | 22745 | 118.6 | 804 | 811 | 184.9 |
| D | 1 | 20 | 370524 | 1905.67 | 820 | 798 | 194.0 |
| D | 2 | 165 | 315048 | 1619.74 | 820 | 798 | 194.0 |
| D | 5 | 222 | 235655 | 1210.52 | 820 | 798 | 194.0 |
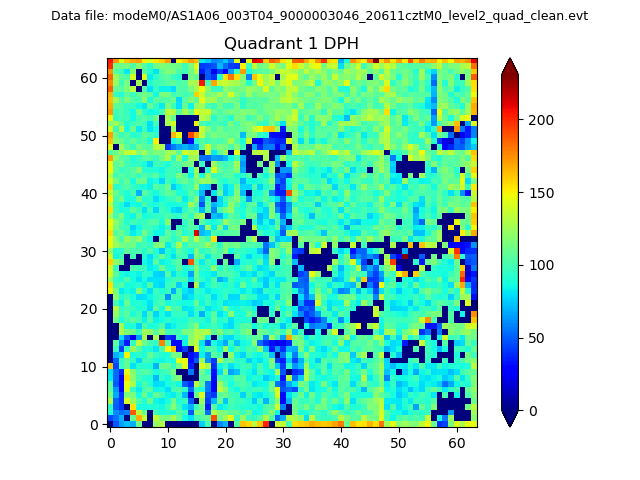
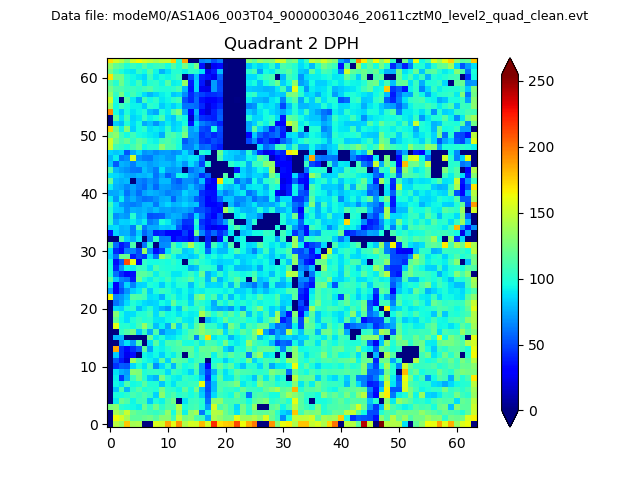
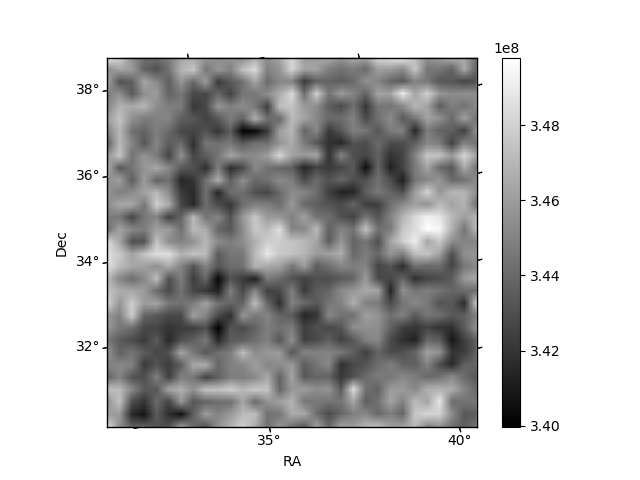
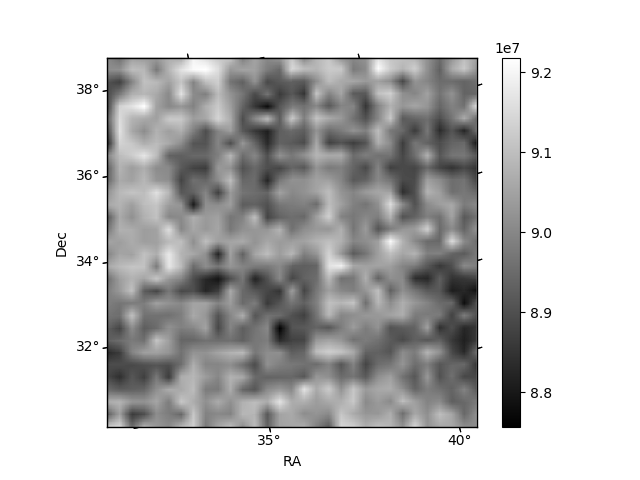
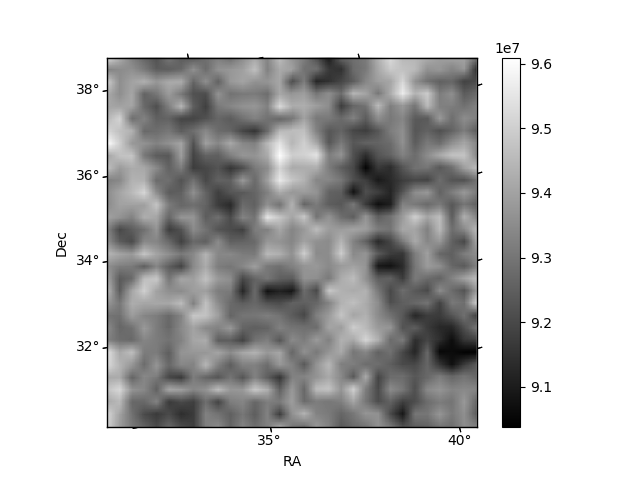
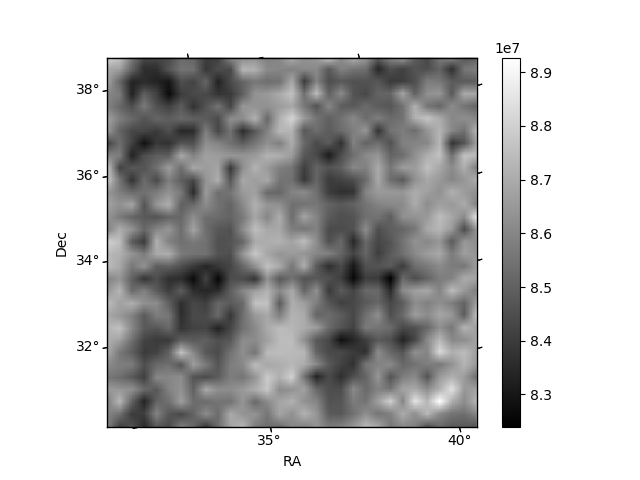
Histogram calculated using DETX and DETY for each event in the final _common_clean file
| Quadrant A | 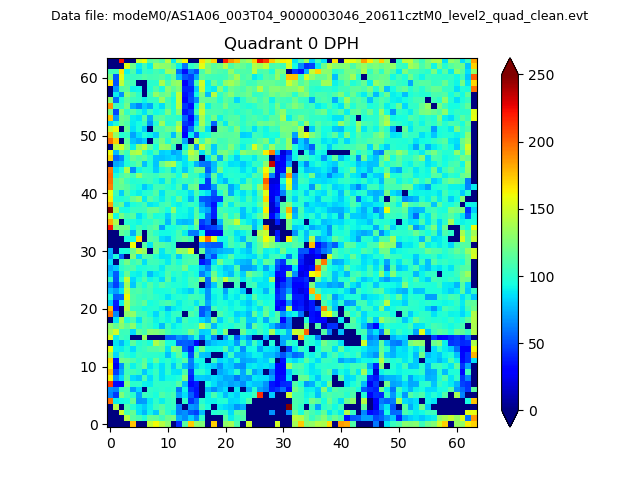 |
 |
Quadrant B |
|---|---|---|---|
| Quadrant D | 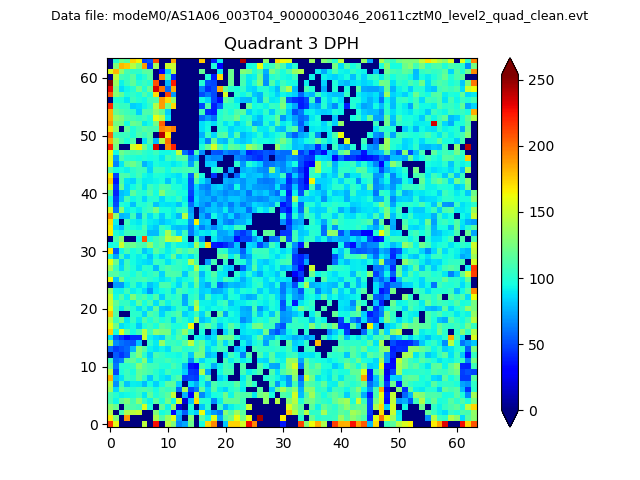 |
 |
Quadrant C |
| Plot type | Count rate plots | Images |
|---|---|---|
| Comparison with Poisson distribution Blue bars denote a histogram of data divided into 1 sec bins. Red curve is a Poisson curve with rate = median count rate of data. |
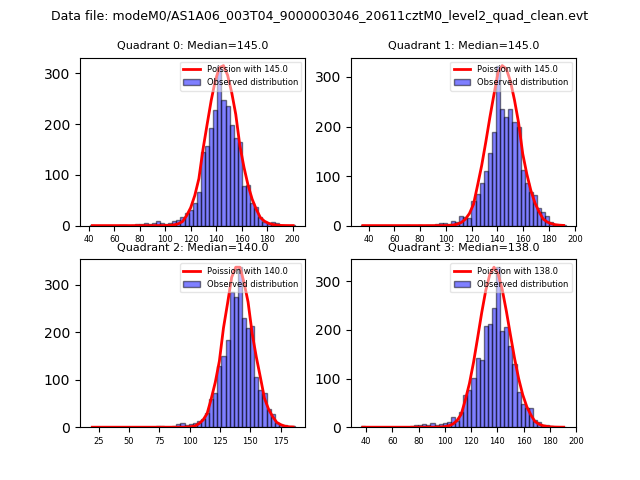 |
 |
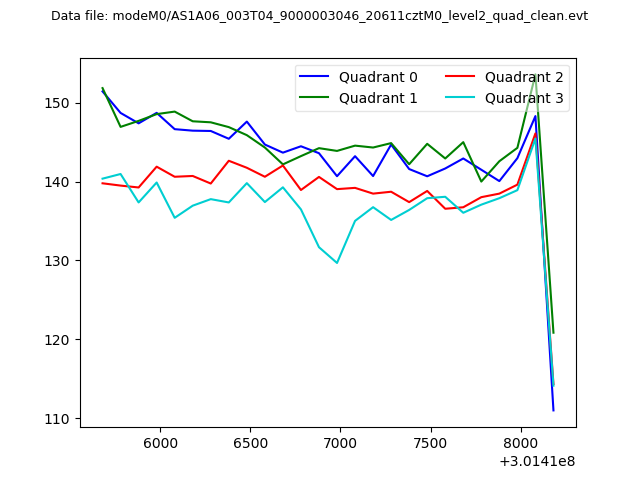
| Quadrant-wise count rates Data is divided into 100 sec bins |
 |
|
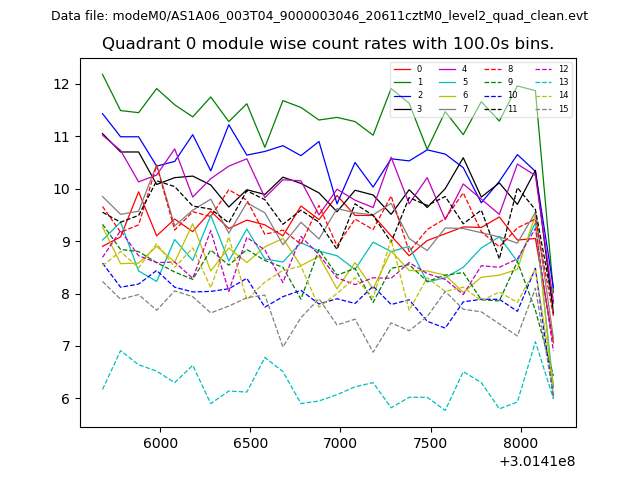
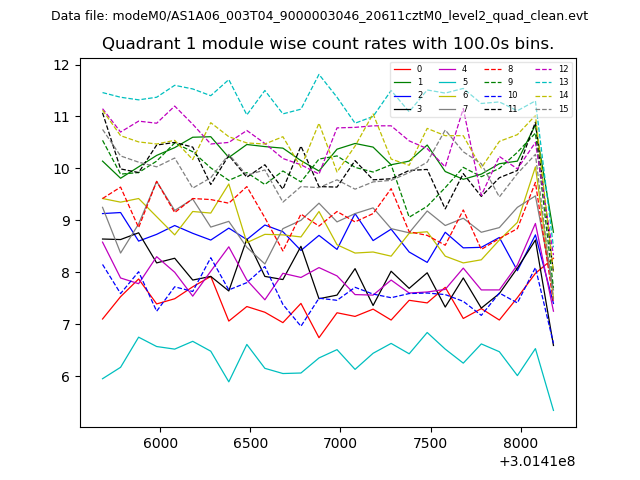
| Module-wise count rates for Quadrant A Data is divided into 100 sec bins |
 |
 |
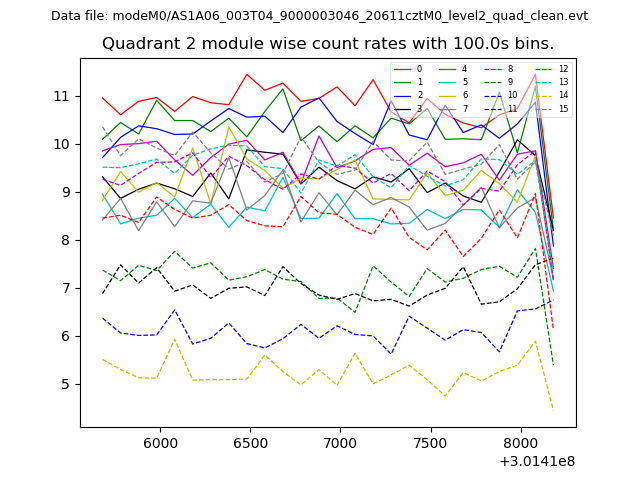
| Module-wise count rates for Quadrant B Data is divided into 100 sec bins |
 |
 |
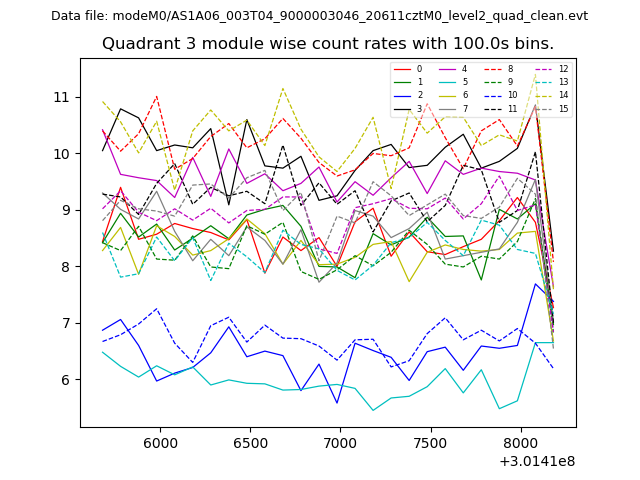
| Module-wise count rates for Quadrant C Data is divided into 100 sec bins |
 |
 |
| Module-wise count rates for Quadrant D Data is divided into 100 sec bins |
 |
 |
| Parameter | Plot |
|---|---|
| CZT HV Monitor | 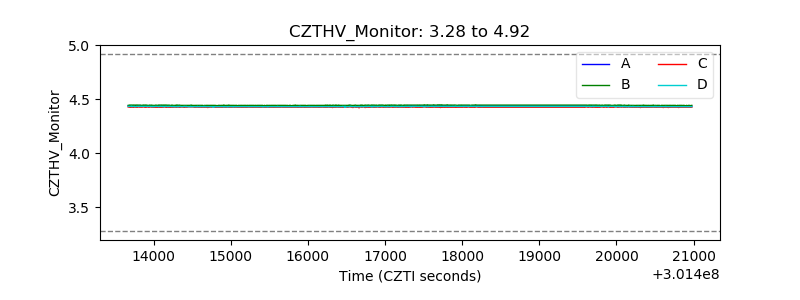 |
| D_VDD | 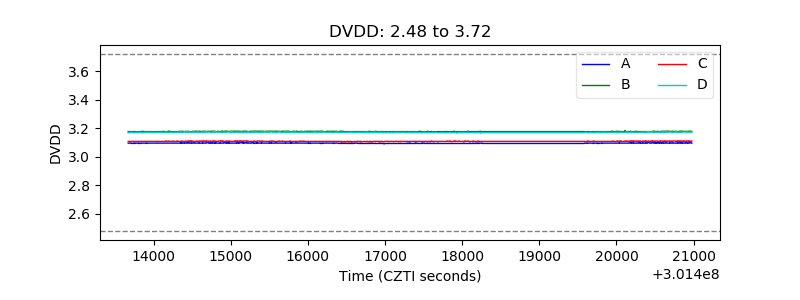 |
| Temperature 1 |  |
| Veto HV Monitor | 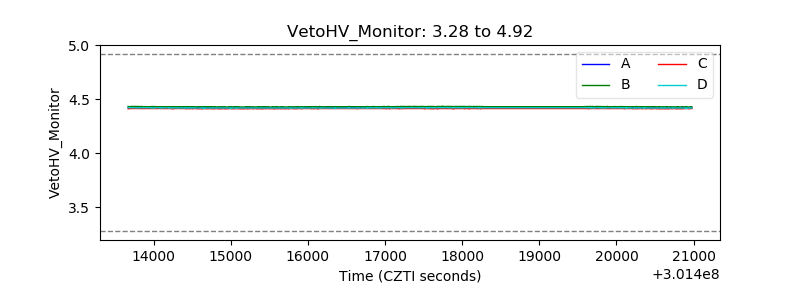 |
| Veto LLD | 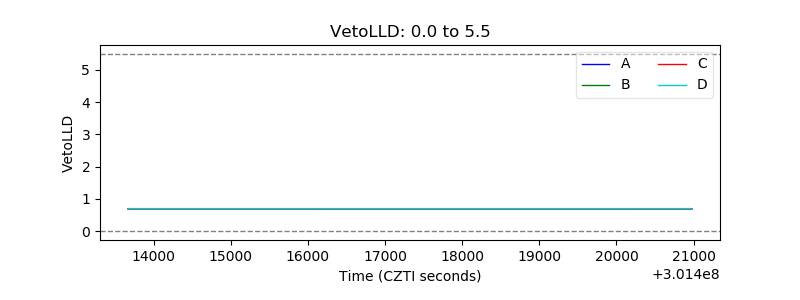 |
| Alpha Counter | 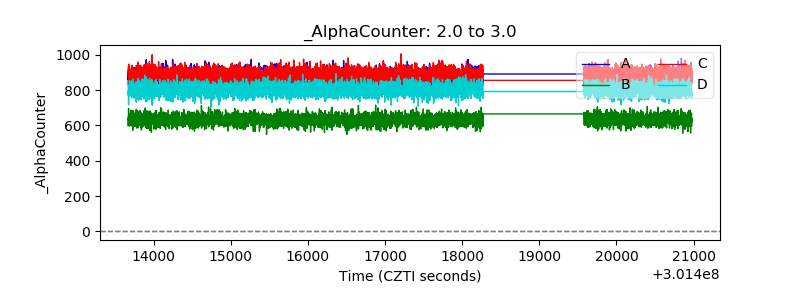 |
| _CPM_Rate | 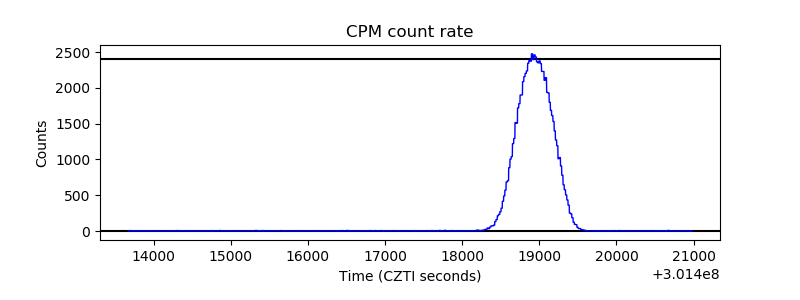 |
| CZT Counter | 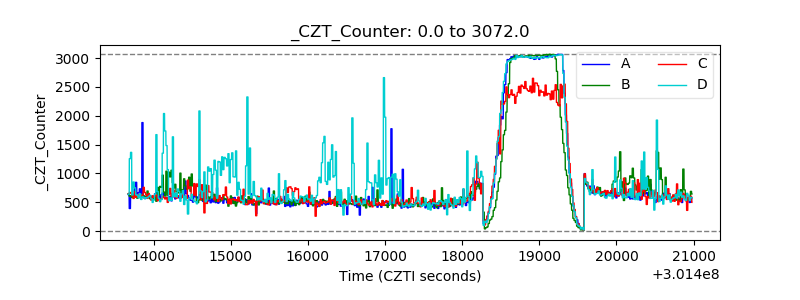 |
| +2.5 Volts monitor |  |
| +5 Volts monitor |  |
| _ROLL_ROT | 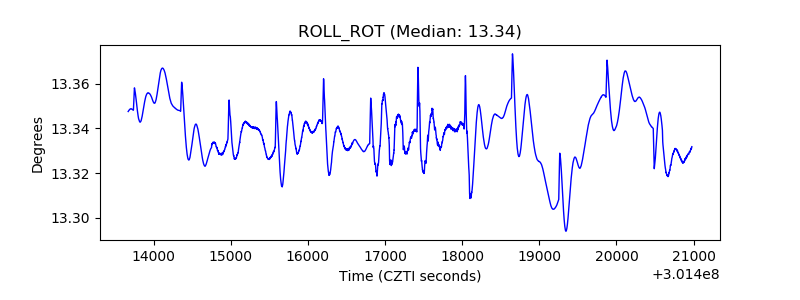 |
| _Roll_DEC | 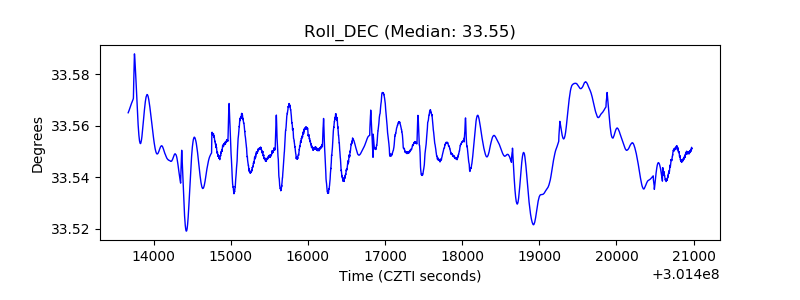 |
| _Roll_RA | 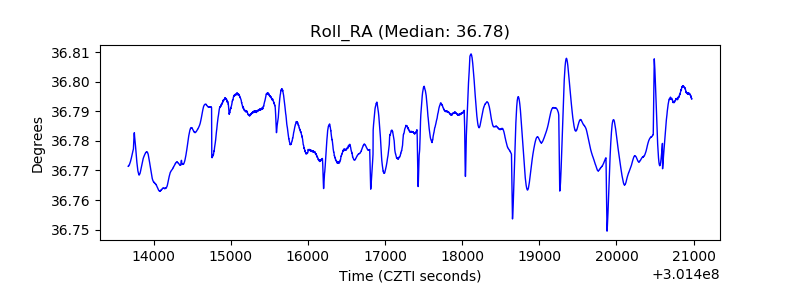 |
| Veto Counter | 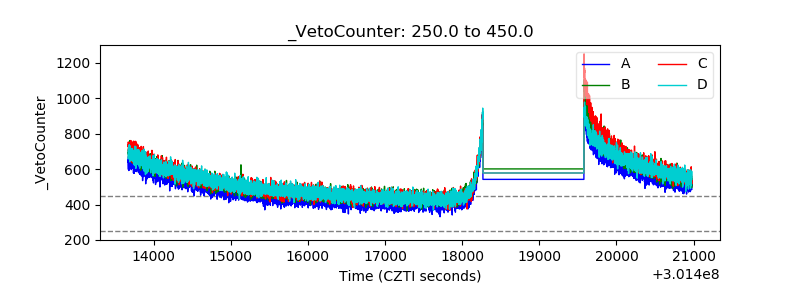 |