| Param | Original file | Final file |
|---|---|---|
| Filename | modeM0/AS1A06_003T04_9000003046_20612cztM0_level2.evt | modeM0/AS1A06_003T04_9000003046_20612cztM0_level2_quad_clean.evt |
| Size (bytes) | 532,365,120 | 71,055,360 |
| Size | 507.7 MB | 67.8 MB |
| Events in quadrant A | 3,552,280 | 435,521 |
| Events in quadrant B | 3,825,052 | 439,449 |
| Events in quadrant C | 4,143,530 | 418,385 |
| Events in quadrant D | 4,172,583 | 416,074 |
| Mode M0 | |||
|---|---|---|---|
| Quadrant | BADHDUFLAG | Total packets | Discarded packets |
| A | 0 | 14660 | 2 |
| B | 0 | 15496 | 2 |
| C | 0 | 16611 | 2 |
| D | 0 | 16666 | 2 |
| Mode SS | |||
|---|---|---|---|
| Quadrant | BADHDUFLAG | Total packets | Discarded packets |
| A | 0 | 130 | 0 |
| B | 0 | 130 | 0 |
| C | 0 | 130 | 0 |
| D | 0 | 130 | 0 |
| Mode M9 | |||
|---|---|---|---|
| Quadrant | BADHDUFLAG | Total packets | Discarded packets |
| A | 0 | 15 | 0 |
| B | 0 | 16 | 0 |
| C | 0 | 16 | 0 |
| D | 0 | 16 | 0 |
| Quadrant | Total seconds | Saturated seconds | Saturation percentage |
|---|---|---|---|
| A | 6329 | 128 | 2.022436% |
| B | 6329 | 147 | 2.322642% |
| C | 6329 | 166 | 2.622847% |
| D | 6329 | 183 | 2.891452% |
Noise dominated data is calculated using 1-second bins in cleaned event files. If a bin has >2000 counts, and if more than 50% of those come from <1% of pixels, then it is considered to be noise-dominated and hence unusable.
| Quadrant | # 1 sec bins | Bins with >0 counts | Bins with >2000 counts | High rate bins dominated by noise | Noise dominated (total time) | Noise dominated (detector-on time) | Marked lightcurve |
|---|---|---|---|---|---|---|---|
| A | 7669 | 6330 | 13 | 13 | 0.17% | 0.21% | 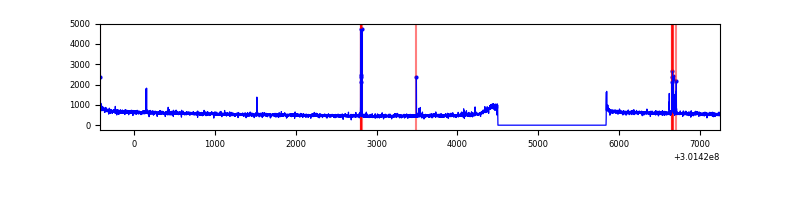 |
| B | 7669 | 6330 | 10 | 10 | 0.13% | 0.16% | 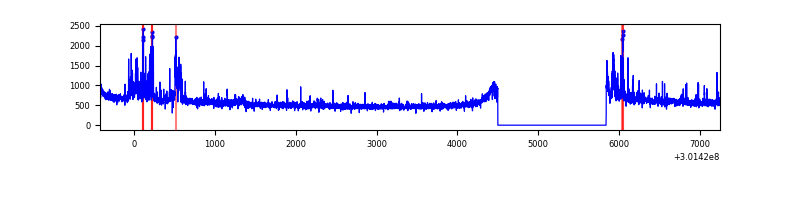 |
| C | 7669 | 6330 | 11 | 11 | 0.14% | 0.17% | 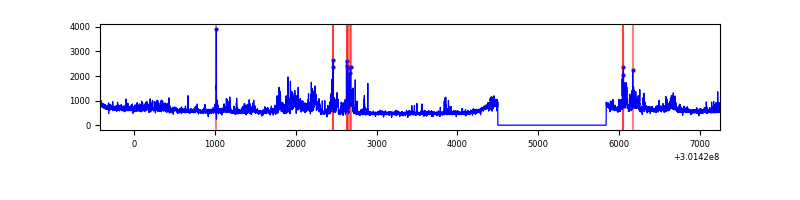 |
| D | 7669 | 6330 | 75 | 75 | 0.98% | 1.18% | 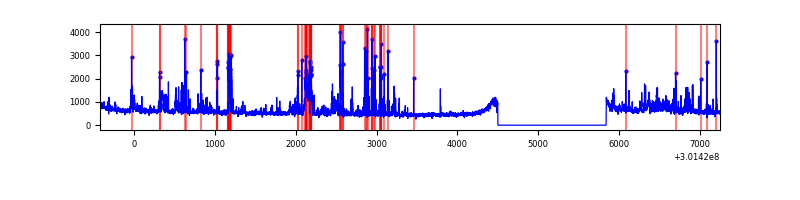 |
Top three noisy pixels from each quadrant. If the there are fewer than three noisy pixels in the level2.evt file, extra rows are filled as -1
| Pixel properties | Quadrant properties | ||||||
|---|---|---|---|---|---|---|---|
| Quadrant | DetID | PixID | Counts | Sigma | Mean | Median | Sigma |
| A | 5 | 16 | 84279 | 466.25 | 899 | 882 | 178.9 |
| A | 8 | 205 | 8416 | 42.12 | 899 | 882 | 178.9 |
| A | 0 | 226 | 7913 | 39.31 | 899 | 882 | 178.9 |
| B | 0 | 189 | 91759 | 548.37 | 890 | 871 | 165.7 |
| B | 7 | 220 | 79174 | 472.44 | 890 | 871 | 165.7 |
| B | 15 | 33 | 57772 | 343.31 | 890 | 871 | 165.7 |
| C | 3 | 9 | 210230 | 1050.73 | 862 | 871 | 199.3 |
| C | 9 | 54 | 159494 | 796.09 | 862 | 871 | 199.3 |
| C | 8 | 208 | 149442 | 745.64 | 862 | 871 | 199.3 |
| D | 2 | 165 | 267634 | 1272.97 | 879 | 857 | 209.6 |
| D | 5 | 222 | 165535 | 785.79 | 879 | 857 | 209.6 |
| D | 1 | 20 | 142423 | 675.51 | 879 | 857 | 209.6 |
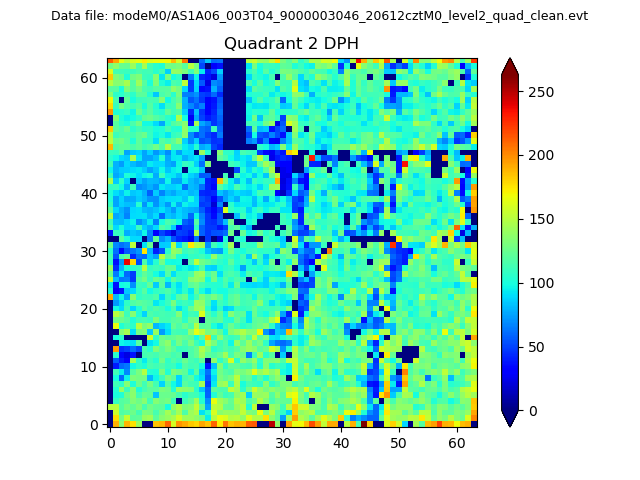
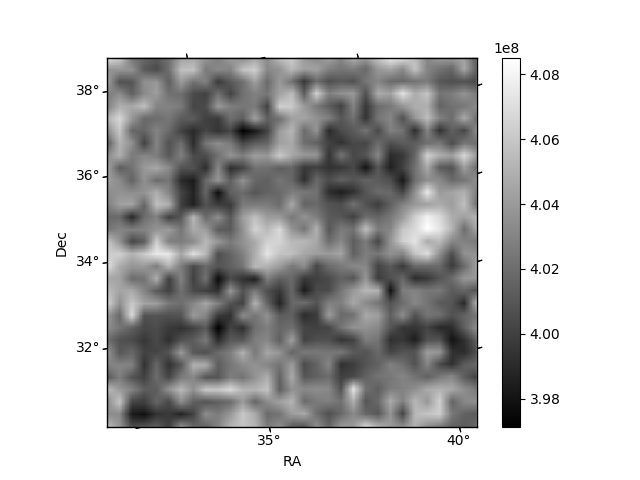
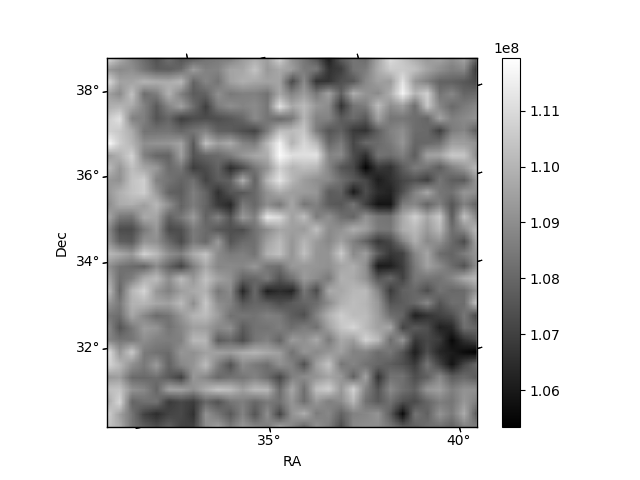
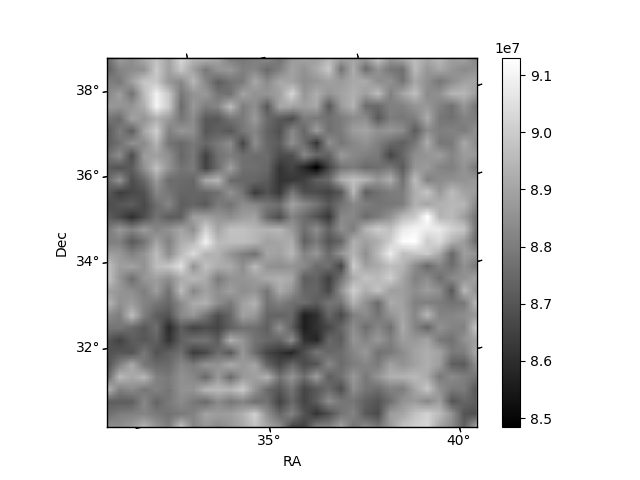
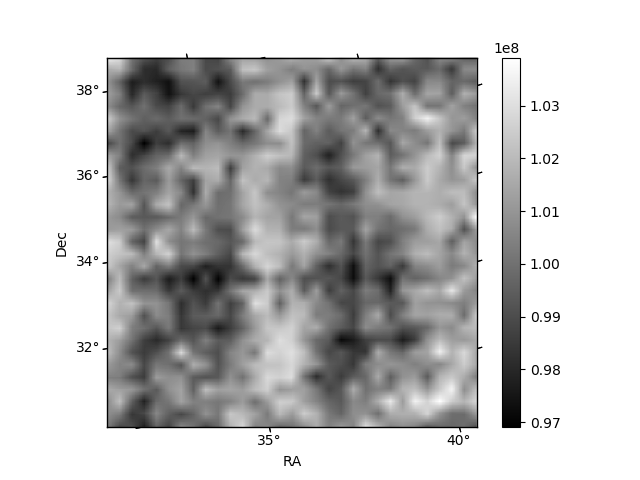
Histogram calculated using DETX and DETY for each event in the final _common_clean file
| Quadrant A | 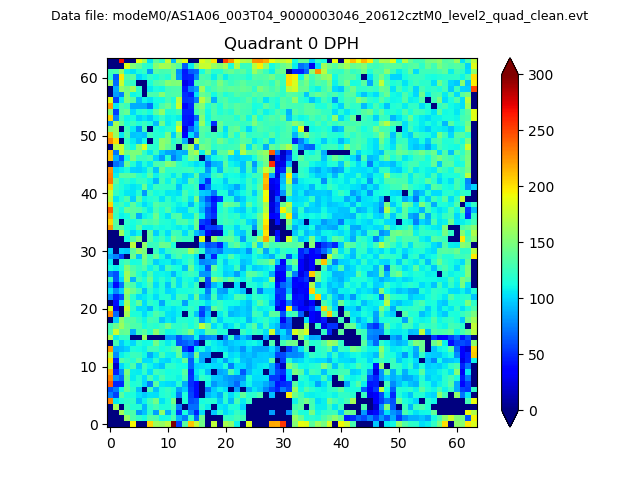 |
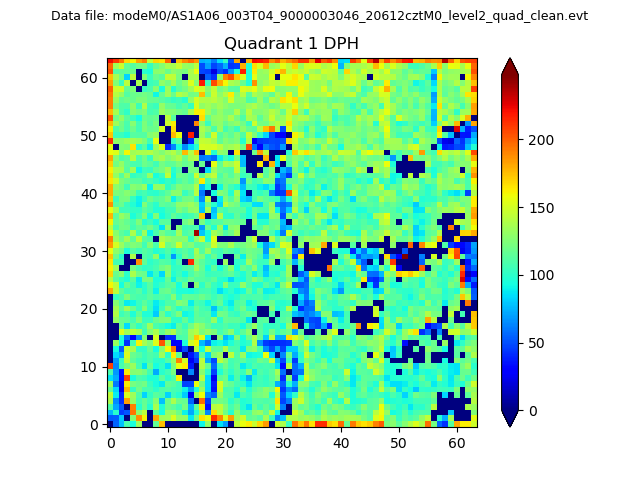 |
Quadrant B |
|---|---|---|---|
| Quadrant D | 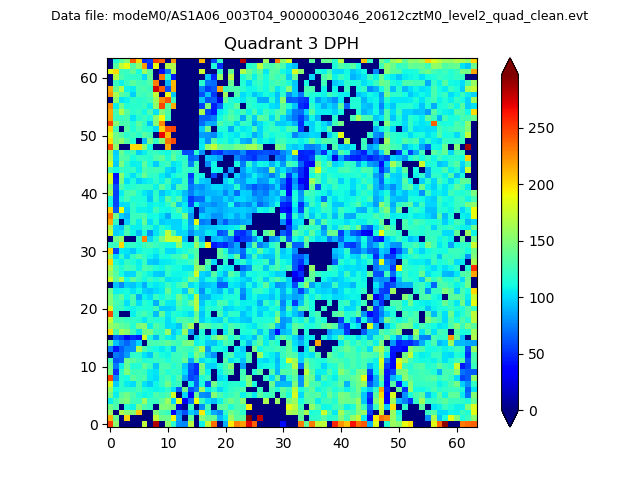 |
 |
Quadrant C |
| Plot type | Count rate plots | Images |
|---|---|---|
| Comparison with Poisson distribution Blue bars denote a histogram of data divided into 1 sec bins. Red curve is a Poisson curve with rate = median count rate of data. |
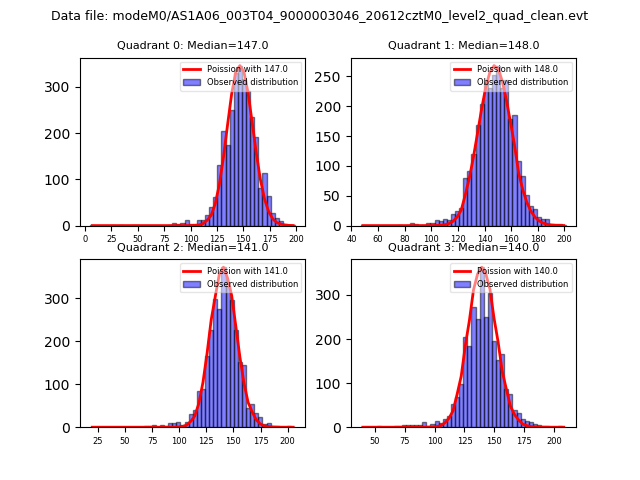 |
 |
| Quadrant-wise count rates Data is divided into 100 sec bins |
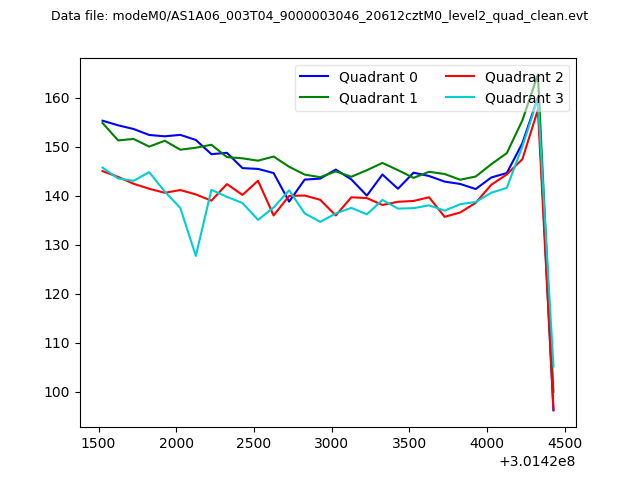 |
|
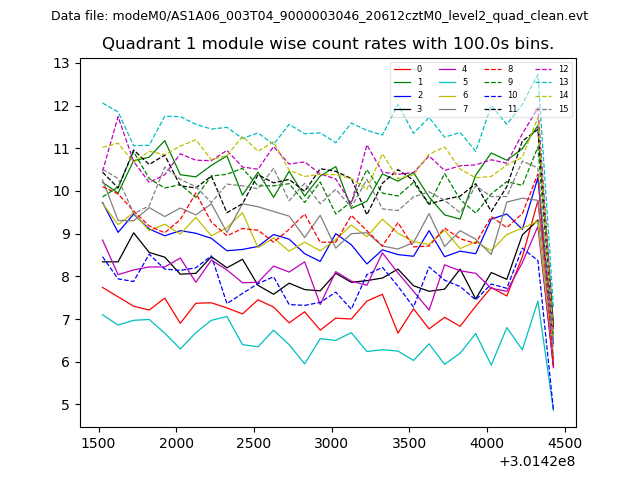
| Module-wise count rates for Quadrant A Data is divided into 100 sec bins |
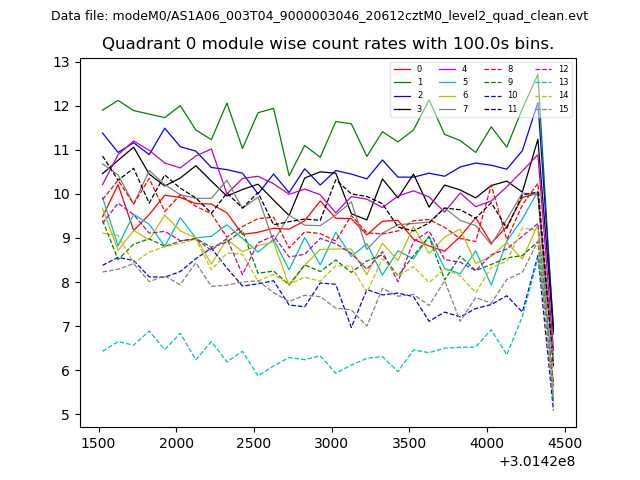 |
 |
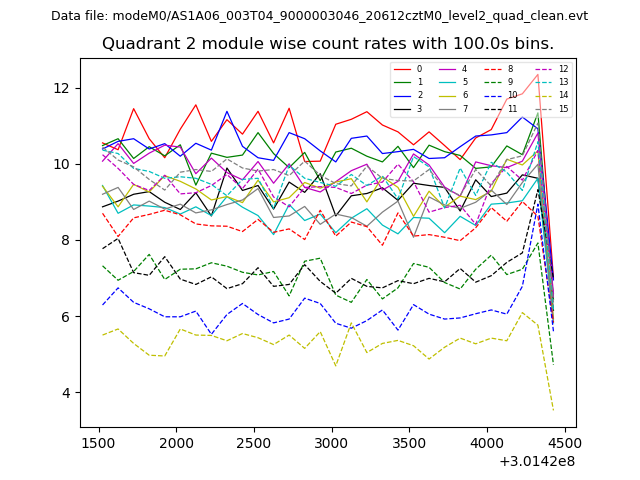
| Module-wise count rates for Quadrant B Data is divided into 100 sec bins |
 |
 |
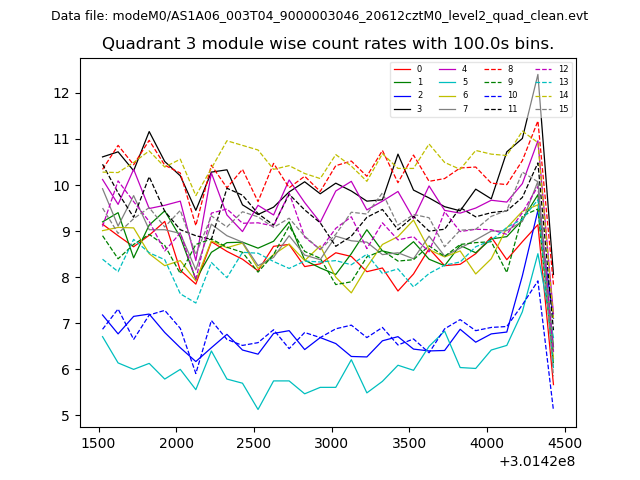
| Module-wise count rates for Quadrant C Data is divided into 100 sec bins |
 |
 |
| Module-wise count rates for Quadrant D Data is divided into 100 sec bins |
 |
 |
| Parameter | Plot |
|---|---|
| CZT HV Monitor | 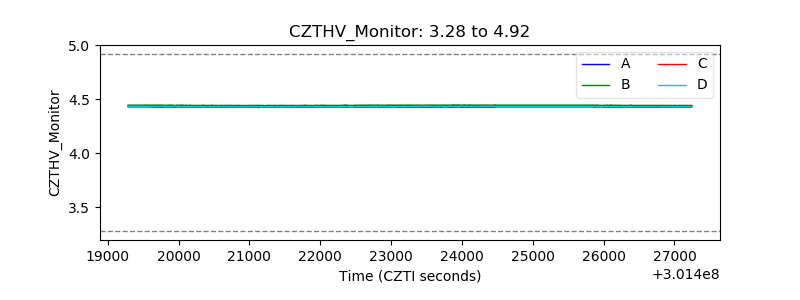 |
| D_VDD |  |
| Temperature 1 |  |
| Veto HV Monitor | 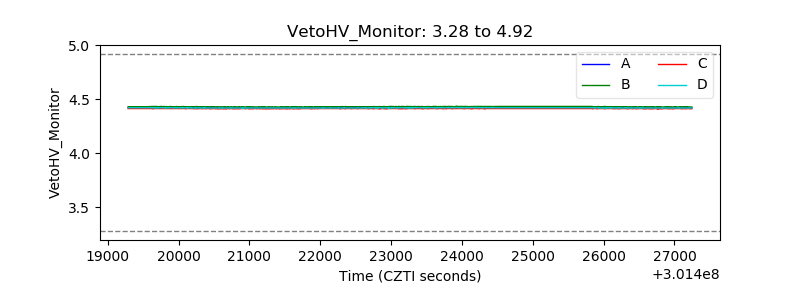 |
| Veto LLD | 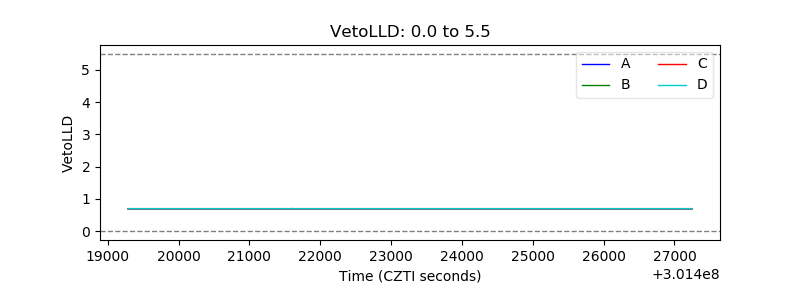 |
| Alpha Counter | 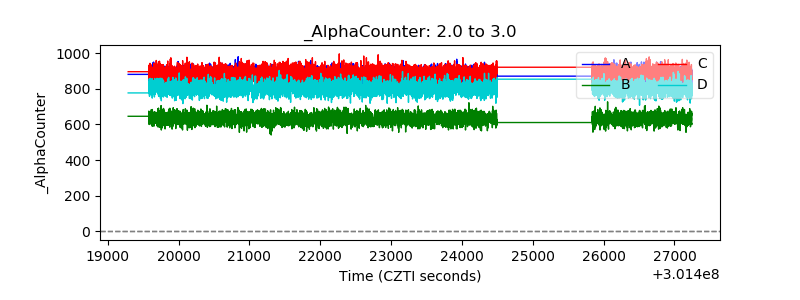 |
| _CPM_Rate | 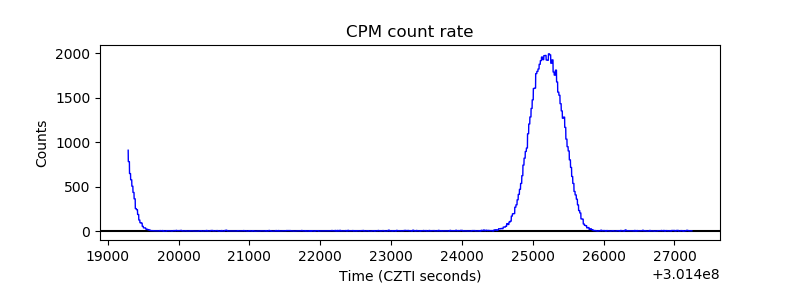 |
| CZT Counter | 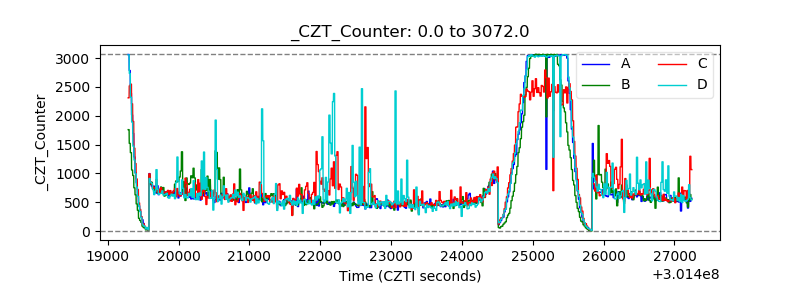 |
| +2.5 Volts monitor |  |
| +5 Volts monitor |  |
| _ROLL_ROT | 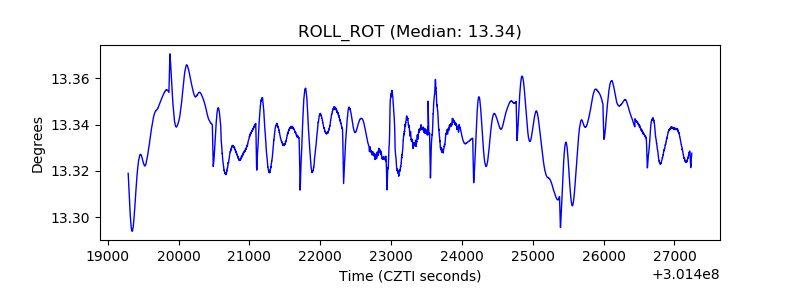 |
| _Roll_DEC |  |
| _Roll_RA | 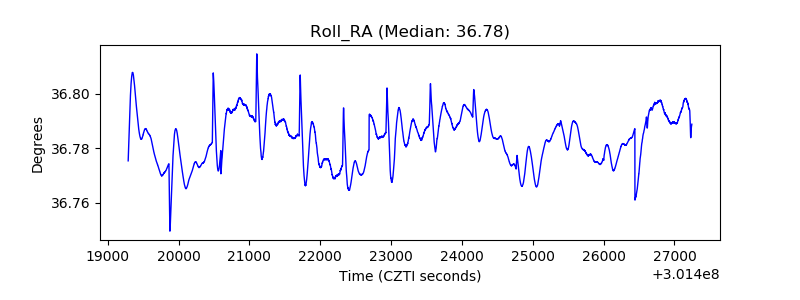 |
| Veto Counter | 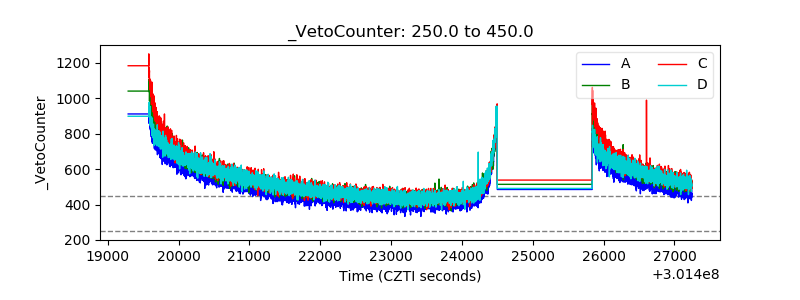 |