| Param | Original file | Final file |
|---|---|---|
| Filename | modeM0/AS1A06_003T04_9000003046_20613cztM0_level2.evt | modeM0/AS1A06_003T04_9000003046_20613cztM0_level2_quad_clean.evt |
| Size (bytes) | 479,093,760 | 79,470,720 |
| Size | 456.9 MB | 75.8 MB |
| Events in quadrant A | 3,261,927 | 508,787 |
| Events in quadrant B | 3,179,557 | 515,504 |
| Events in quadrant C | 3,342,798 | 498,197 |
| Events in quadrant D | 4,329,295 | 476,563 |
| Mode M0 | |||
|---|---|---|---|
| Quadrant | BADHDUFLAG | Total packets | Discarded packets |
| A | 0 | 13412 | 1 |
| B | 0 | 13145 | 1 |
| C | 0 | 13643 | 1 |
| D | 0 | 16790 | 1 |
| Mode SS | |||
|---|---|---|---|
| Quadrant | BADHDUFLAG | Total packets | Discarded packets |
| A | 0 | 120 | 0 |
| B | 0 | 120 | 0 |
| C | 0 | 120 | 0 |
| D | 0 | 120 | 0 |
| Mode M9 | |||
|---|---|---|---|
| Quadrant | BADHDUFLAG | Total packets | Discarded packets |
| A | 0 | 12 | 0 |
| B | 0 | 12 | 0 |
| C | 0 | 12 | 0 |
| D | 0 | 12 | 0 |
| Quadrant | Total seconds | Saturated seconds | Saturation percentage |
|---|---|---|---|
| A | 5823 | 174 | 2.988150% |
| B | 5824 | 138 | 2.369505% |
| C | 5824 | 185 | 3.176511% |
| D | 5824 | 503 | 8.636676% |
Noise dominated data is calculated using 1-second bins in cleaned event files. If a bin has >2000 counts, and if more than 50% of those come from <1% of pixels, then it is considered to be noise-dominated and hence unusable.
| Quadrant | # 1 sec bins | Bins with >0 counts | Bins with >2000 counts | High rate bins dominated by noise | Noise dominated (total time) | Noise dominated (detector-on time) | Marked lightcurve |
|---|---|---|---|---|---|---|---|
| A | 7038 | 5825 | 25 | 25 | 0.36% | 0.43% | 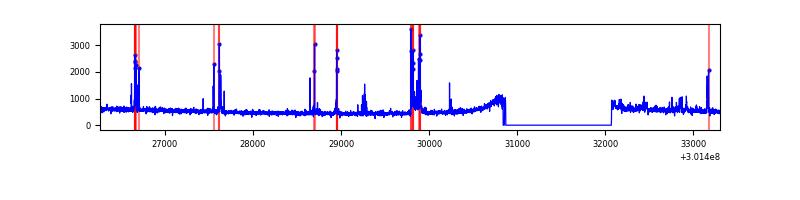 |
| B | 7039 | 5826 | 1 | 1 | 0.01% | 0.02% | 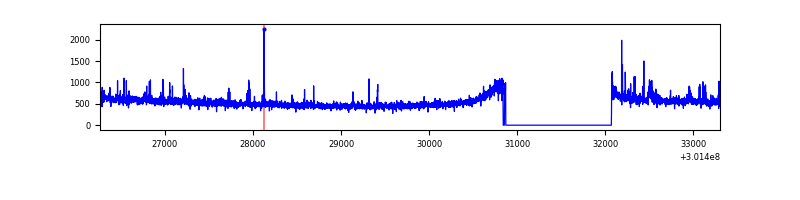 |
| C | 7039 | 5826 | 4 | 4 | 0.06% | 0.07% | 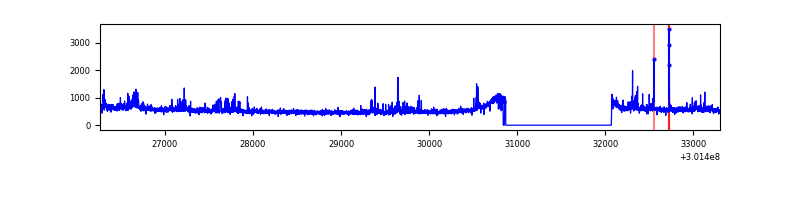 |
| D | 7039 | 5825 | 263 | 263 | 3.74% | 4.52% | 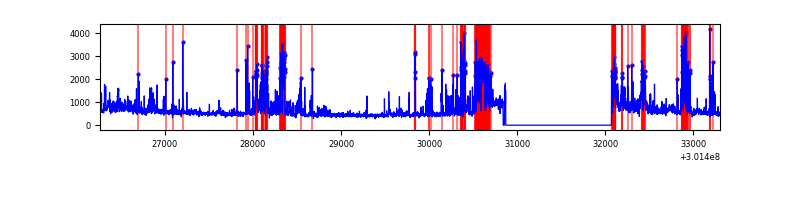 |
Top three noisy pixels from each quadrant. If the there are fewer than three noisy pixels in the level2.evt file, extra rows are filled as -1
| Pixel properties | Quadrant properties | ||||||
|---|---|---|---|---|---|---|---|
| Quadrant | DetID | PixID | Counts | Sigma | Mean | Median | Sigma |
| A | 5 | 16 | 117769 | 748.34 | 782 | 769 | 156.3 |
| A | 15 | 174 | 75859 | 480.28 | 782 | 769 | 156.3 |
| A | 12 | 16 | 45788 | 287.94 | 782 | 769 | 156.3 |
| B | 0 | 190 | 41114 | 274.19 | 782 | 765 | 147.2 |
| B | 0 | 189 | 27660 | 182.76 | 782 | 765 | 147.2 |
| B | 12 | 111 | 16433 | 106.47 | 782 | 765 | 147.2 |
| C | 3 | 233 | 132982 | 747.43 | 758 | 765 | 176.9 |
| C | 14 | 238 | 117012 | 657.15 | 758 | 765 | 176.9 |
| C | 8 | 208 | 115614 | 649.25 | 758 | 765 | 176.9 |
| D | 2 | 165 | 886028 | 4837.82 | 754 | 734 | 183.0 |
| D | 13 | 153 | 277004 | 1509.72 | 754 | 734 | 183.0 |
| D | 1 | 52 | 139791 | 759.9 | 754 | 734 | 183.0 |
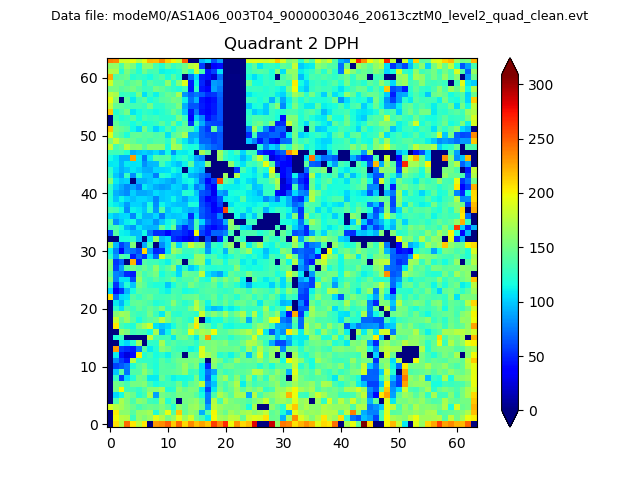
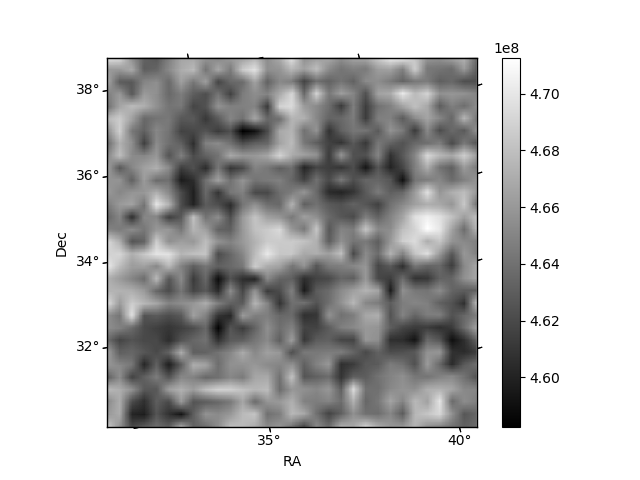
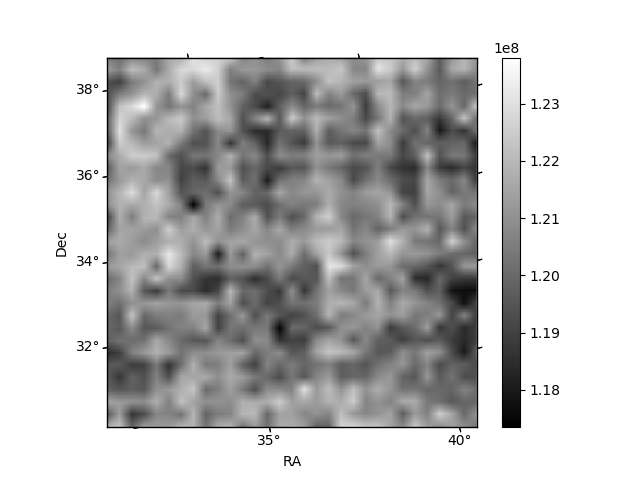
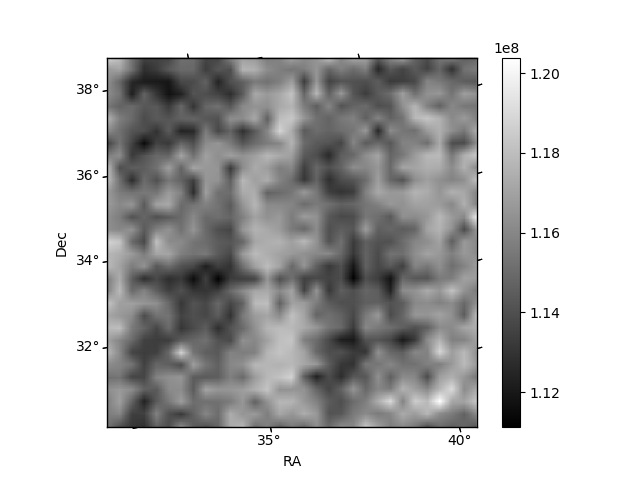
Histogram calculated using DETX and DETY for each event in the final _common_clean file
| Quadrant A | 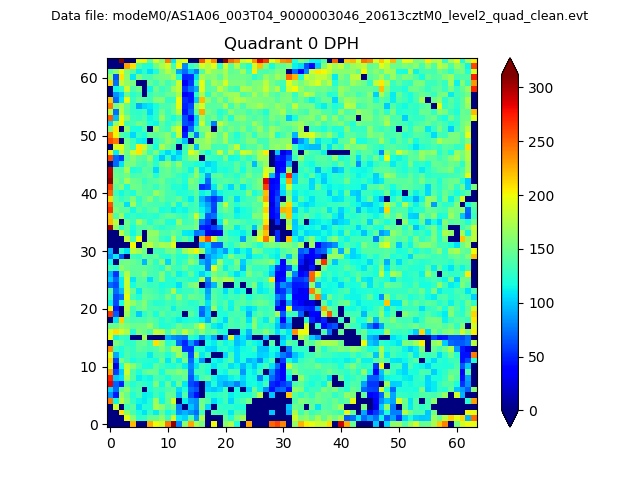 |
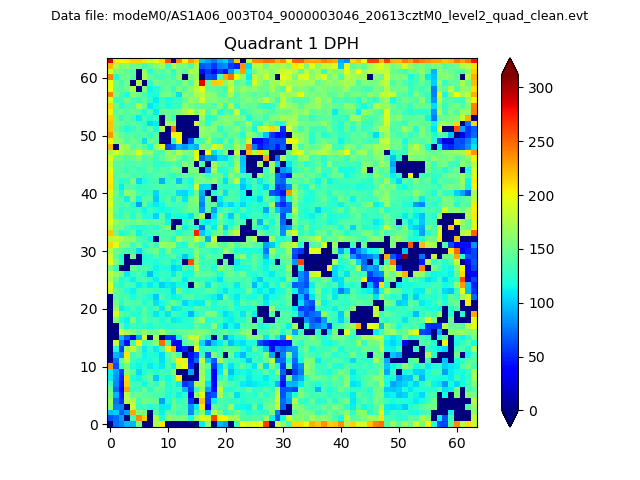 |
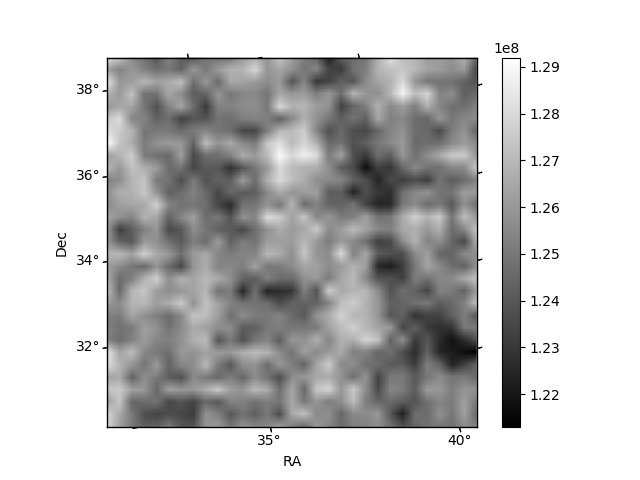
Quadrant B |
|---|---|---|---|
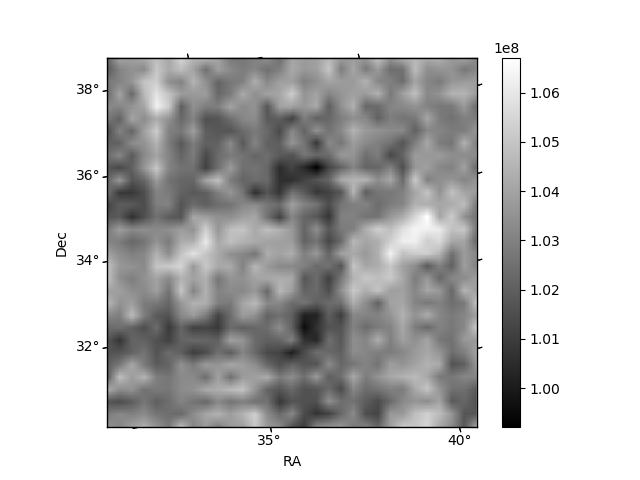
| Quadrant D | 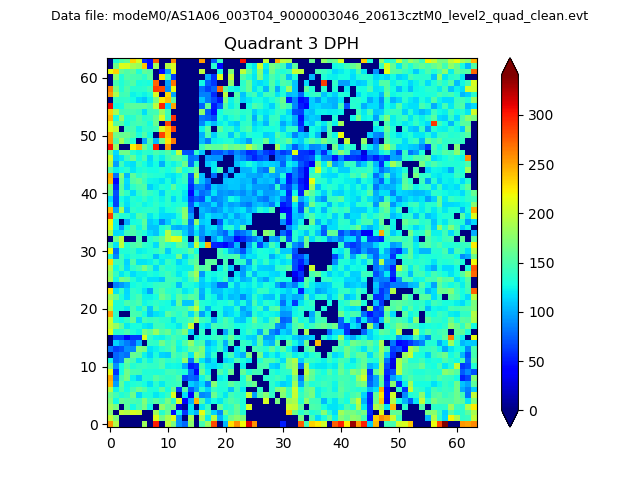 |
 |
Quadrant C |
| Plot type | Count rate plots | Images |
|---|---|---|
| Comparison with Poisson distribution Blue bars denote a histogram of data divided into 1 sec bins. Red curve is a Poisson curve with rate = median count rate of data. |
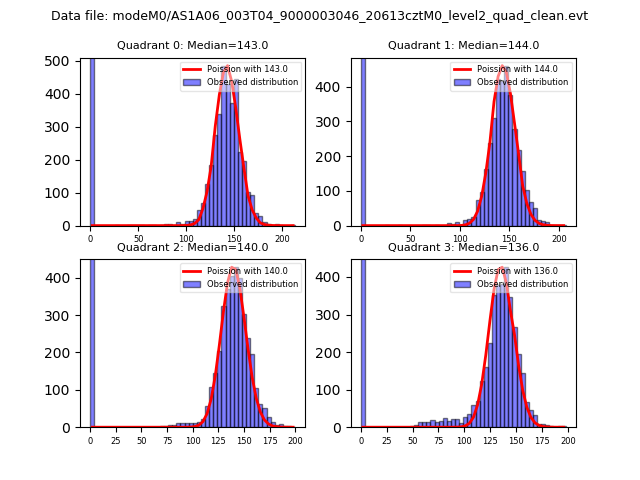 |
 |
| Quadrant-wise count rates Data is divided into 100 sec bins |
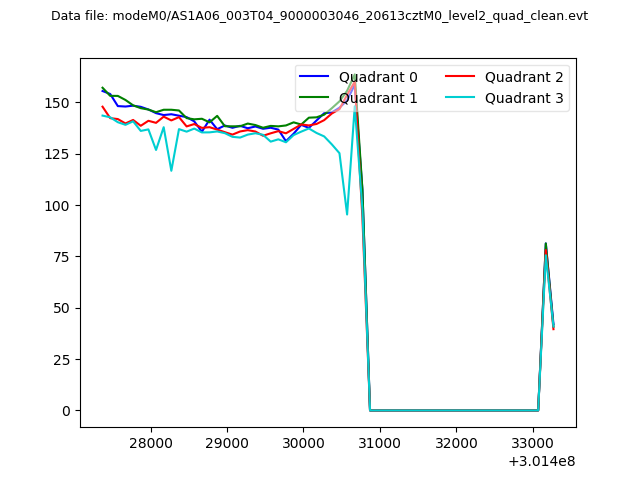 |
|
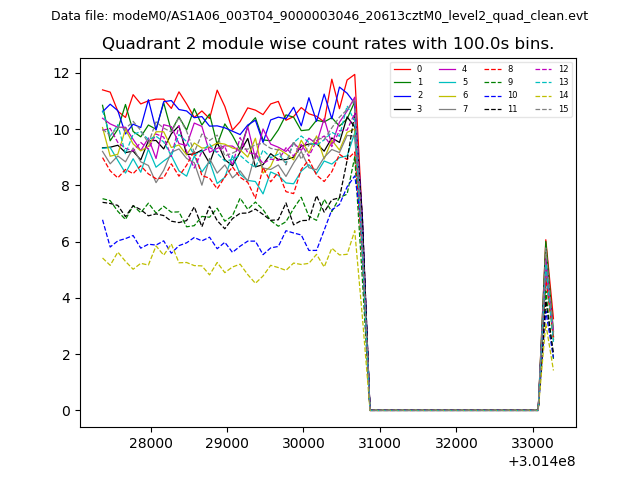
| Module-wise count rates for Quadrant A Data is divided into 100 sec bins |
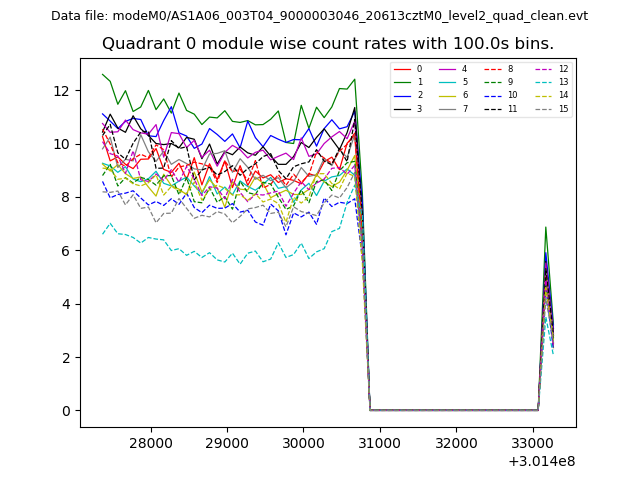 |
 |
| Module-wise count rates for Quadrant B Data is divided into 100 sec bins |
 |
 |
| Module-wise count rates for Quadrant C Data is divided into 100 sec bins |
 |
 |
| Module-wise count rates for Quadrant D Data is divided into 100 sec bins |
 |
 |
| Parameter | Plot |
|---|---|
| CZT HV Monitor | 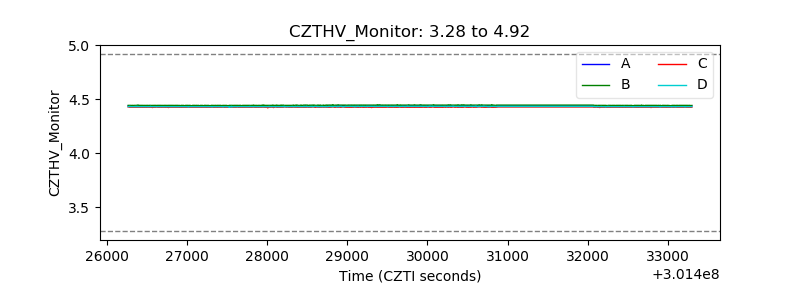 |
| D_VDD |  |
| Temperature 1 | 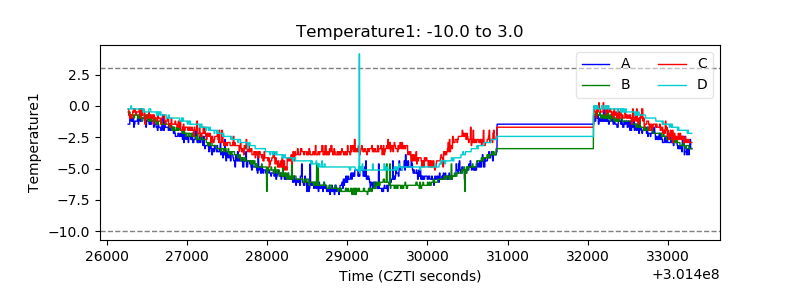 |
| Veto HV Monitor | 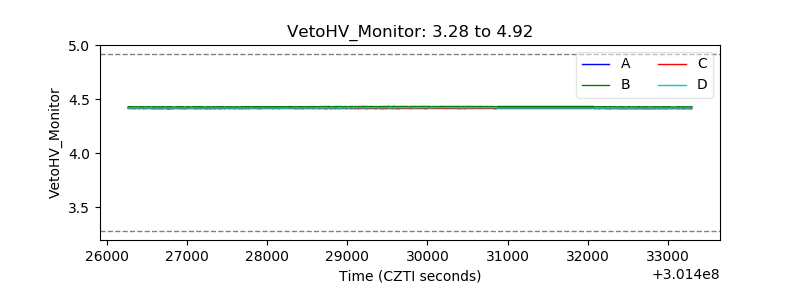 |
| Veto LLD |  |
| Alpha Counter | 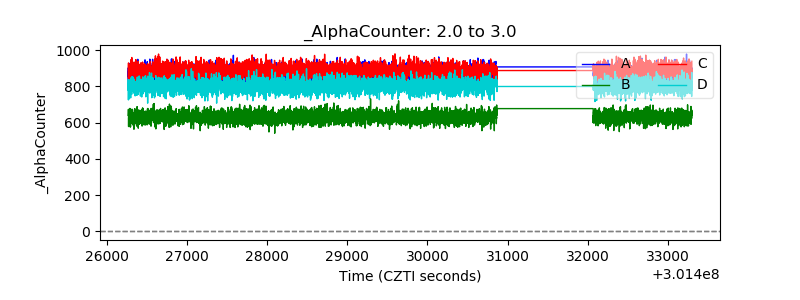 |
| _CPM_Rate | 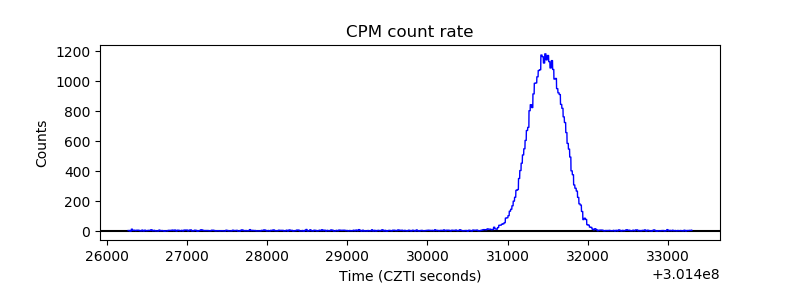 |
| CZT Counter | 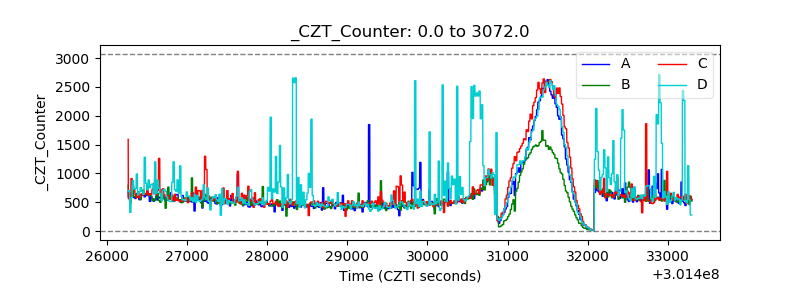 |
| +2.5 Volts monitor |  |
| +5 Volts monitor |  |
| _ROLL_ROT | 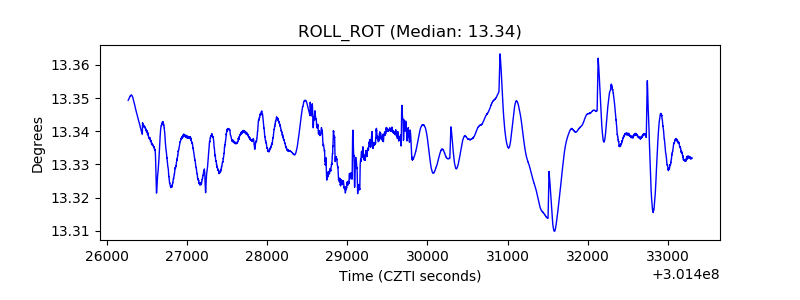 |
| _Roll_DEC | 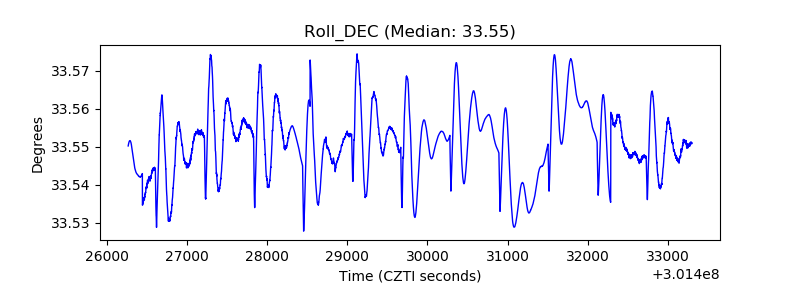 |
| _Roll_RA | 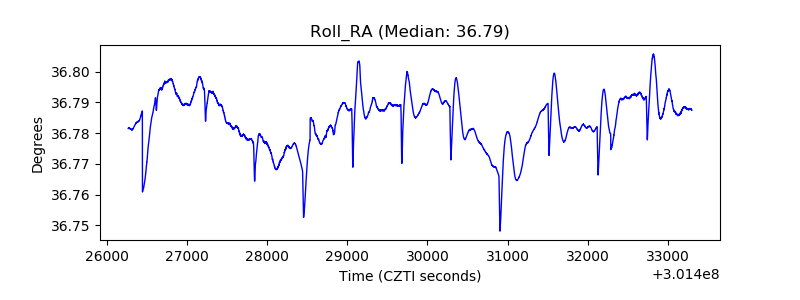 |
| Veto Counter |  |