| Param | Original file | Final file |
|---|---|---|
| Filename | modeM0/AS1A06_003T04_9000003046_20614cztM0_level2.evt | modeM0/AS1A06_003T04_9000003046_20614cztM0_level2_quad_clean.evt |
| Size (bytes) | 511,133,760 | 89,680,320 |
| Size | 487.5 MB | 85.5 MB |
| Events in quadrant A | 3,495,586 | 572,211 |
| Events in quadrant B | 3,410,422 | 581,120 |
| Events in quadrant C | 3,757,384 | 559,338 |
| Events in quadrant D | 4,373,745 | 548,272 |
| Mode M0 | |||
|---|---|---|---|
| Quadrant | BADHDUFLAG | Total packets | Discarded packets |
| A | 0 | 14649 | 2 |
| B | 0 | 14263 | 2 |
| C | 0 | 15271 | 2 |
| D | 0 | 17254 | 2 |
| Mode SS | |||
|---|---|---|---|
| Quadrant | BADHDUFLAG | Total packets | Discarded packets |
| A | 0 | 132 | 0 |
| B | 0 | 132 | 0 |
| C | 0 | 132 | 0 |
| D | 0 | 132 | 0 |
| Mode M9 | |||
|---|---|---|---|
| Quadrant | BADHDUFLAG | Total packets | Discarded packets |
| A | 0 | 16 | 0 |
| B | 0 | 17 | 0 |
| C | 0 | 17 | 0 |
| D | 0 | 17 | 0 |
| Quadrant | Total seconds | Saturated seconds | Saturation percentage |
|---|---|---|---|
| A | 6524 | 105 | 1.609442% |
| B | 6524 | 118 | 1.808706% |
| C | 6523 | 164 | 2.514181% |
| D | 6523 | 344 | 5.273647% |
Noise dominated data is calculated using 1-second bins in cleaned event files. If a bin has >2000 counts, and if more than 50% of those come from <1% of pixels, then it is considered to be noise-dominated and hence unusable.
| Quadrant | # 1 sec bins | Bins with >0 counts | Bins with >2000 counts | High rate bins dominated by noise | Noise dominated (total time) | Noise dominated (detector-on time) | Marked lightcurve |
|---|---|---|---|---|---|---|---|
| A | 7509 | 6525 | 5 | 5 | 0.07% | 0.08% | 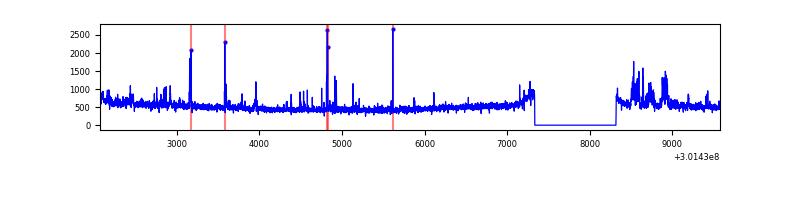 |
| B | 7509 | 6525 | 2 | 2 | 0.03% | 0.03% | 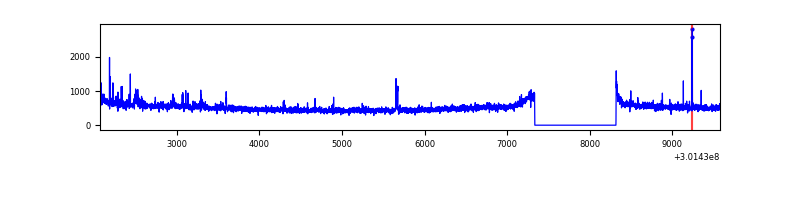 |
| C | 7508 | 6524 | 4 | 4 | 0.05% | 0.06% | 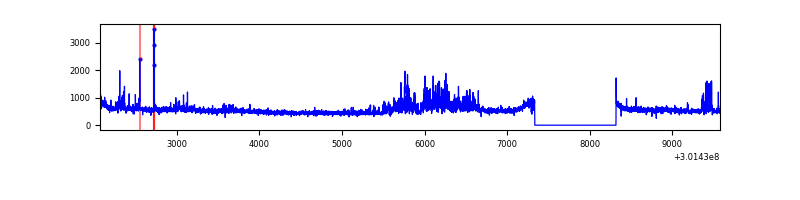 |
| D | 7508 | 6524 | 165 | 165 | 2.20% | 2.53% | 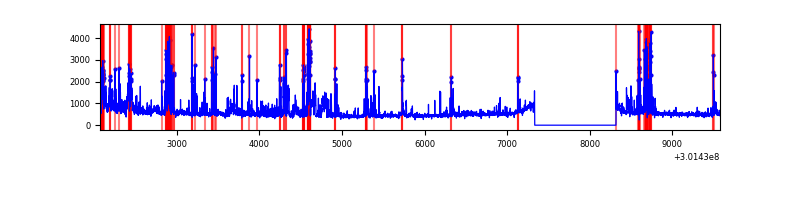 |
Top three noisy pixels from each quadrant. If the there are fewer than three noisy pixels in the level2.evt file, extra rows are filled as -1
| Pixel properties | Quadrant properties | ||||||
|---|---|---|---|---|---|---|---|
| Quadrant | DetID | PixID | Counts | Sigma | Mean | Median | Sigma |
| A | 12 | 16 | 145486 | 853.36 | 839 | 821 | 169.5 |
| A | 5 | 16 | 83884 | 489.98 | 839 | 821 | 169.5 |
| A | 12 | 194 | 31793 | 182.7 | 839 | 821 | 169.5 |
| B | 0 | 189 | 32714 | 199.91 | 839 | 820 | 159.5 |
| B | 0 | 190 | 29572 | 180.22 | 839 | 820 | 159.5 |
| B | 0 | 219 | 23631 | 142.98 | 839 | 820 | 159.5 |
| C | 3 | 9 | 293771 | 1562.93 | 811 | 818 | 187.4 |
| C | 14 | 238 | 126050 | 668.13 | 811 | 818 | 187.4 |
| C | 8 | 208 | 92021 | 486.58 | 811 | 818 | 187.4 |
| D | 2 | 165 | 532528 | 2722.34 | 809 | 789 | 195.3 |
| D | 5 | 222 | 270779 | 1382.27 | 809 | 789 | 195.3 |
| D | 13 | 153 | 190599 | 971.77 | 809 | 789 | 195.3 |
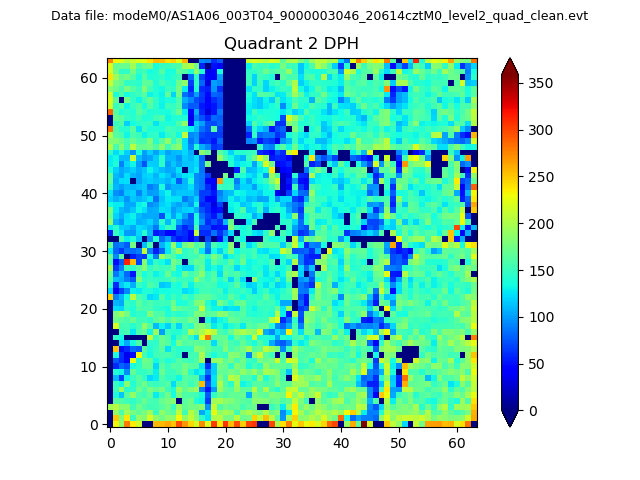
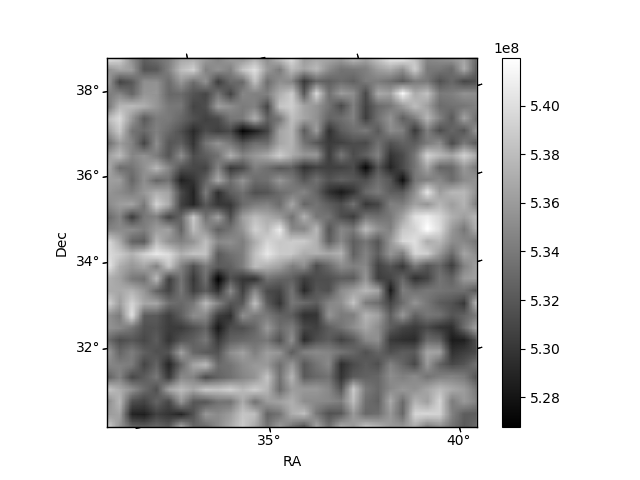
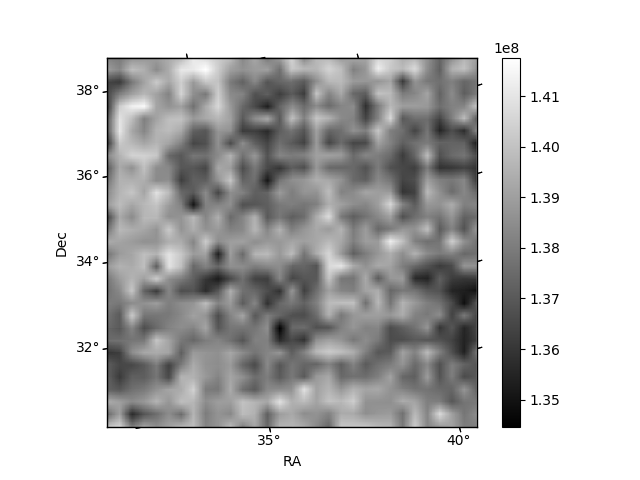
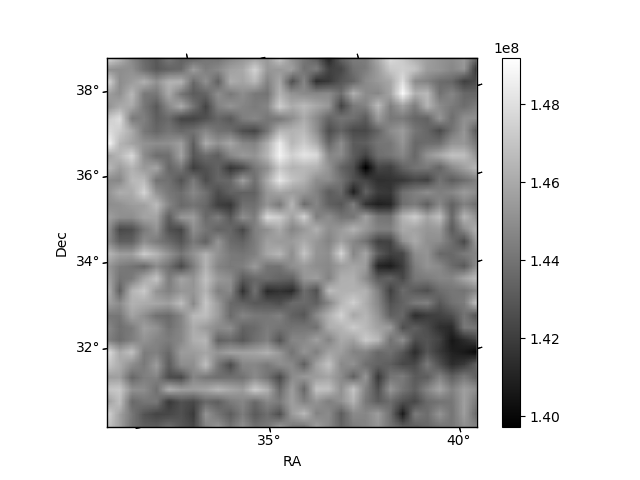
Histogram calculated using DETX and DETY for each event in the final _common_clean file
| Quadrant A | 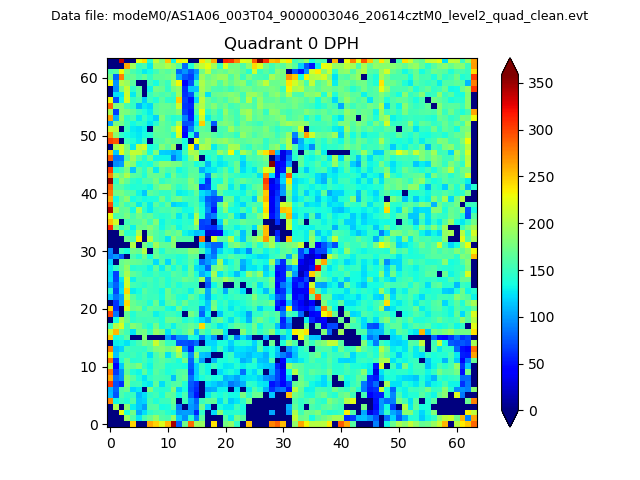 |
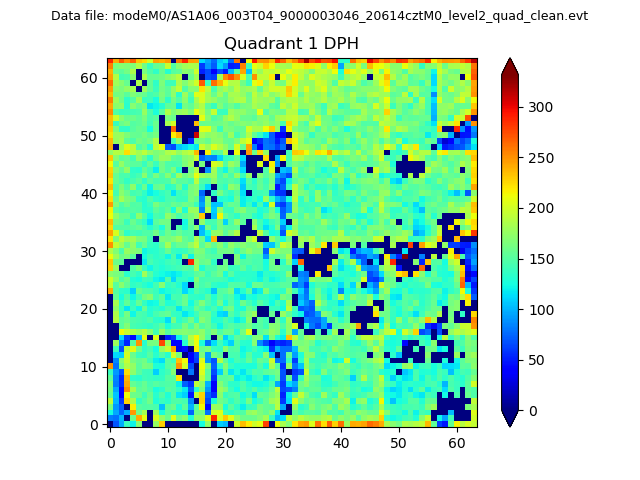 |
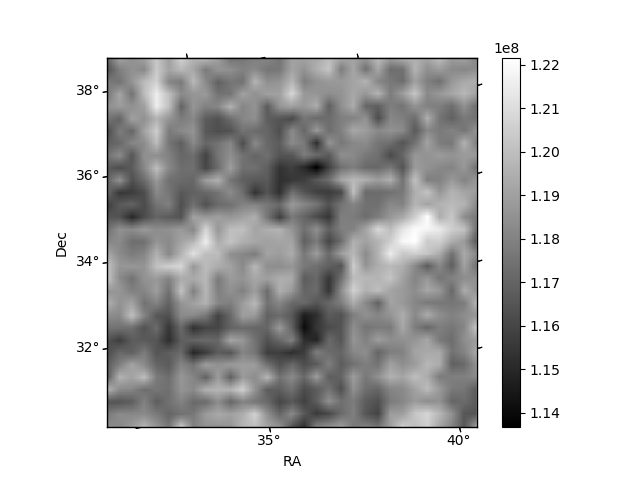
Quadrant B |
|---|---|---|---|
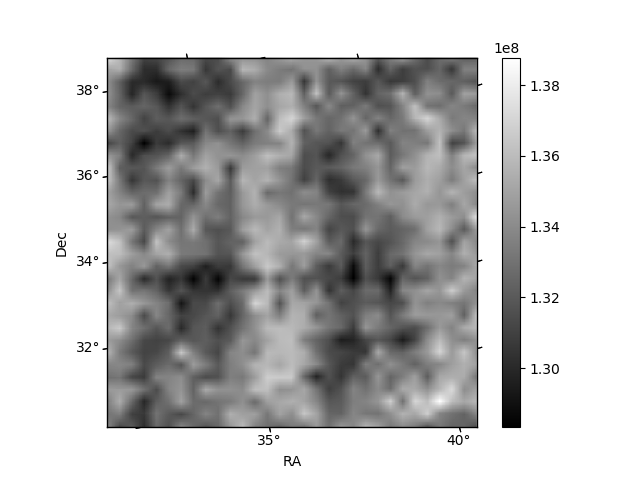
| Quadrant D | 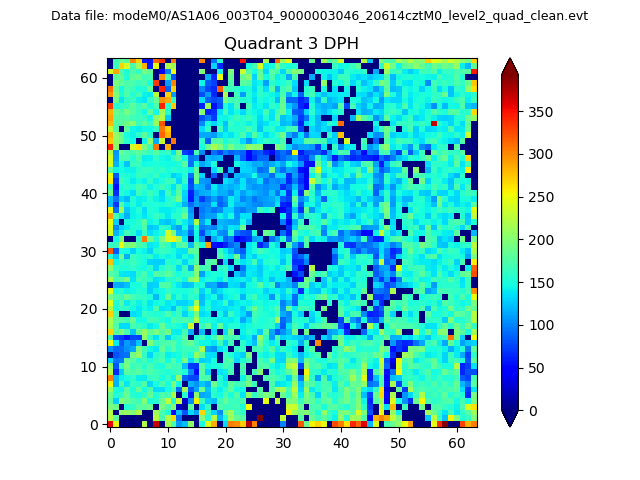 |
 |
Quadrant C |
| Plot type | Count rate plots | Images |
|---|---|---|
| Comparison with Poisson distribution Blue bars denote a histogram of data divided into 1 sec bins. Red curve is a Poisson curve with rate = median count rate of data. |
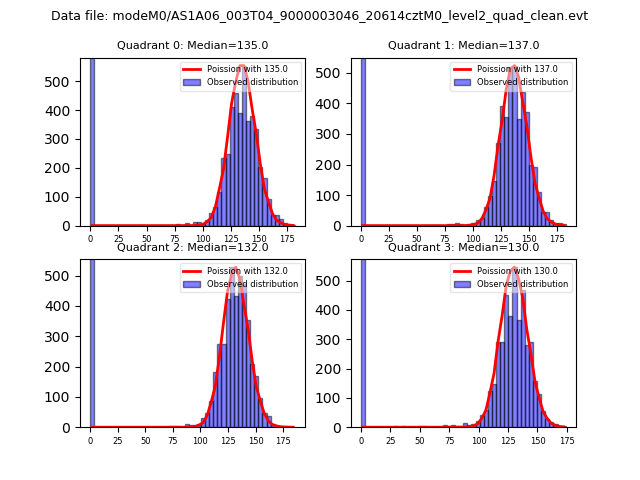 |
 |
| Quadrant-wise count rates Data is divided into 100 sec bins |
 |
|
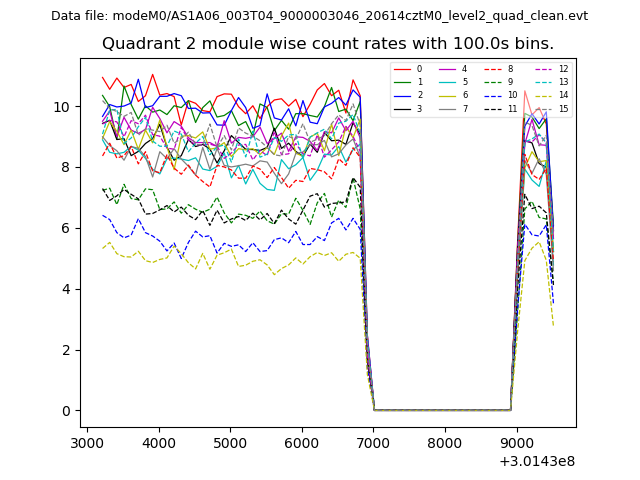
| Module-wise count rates for Quadrant A Data is divided into 100 sec bins |
 |
 |
| Module-wise count rates for Quadrant B Data is divided into 100 sec bins |
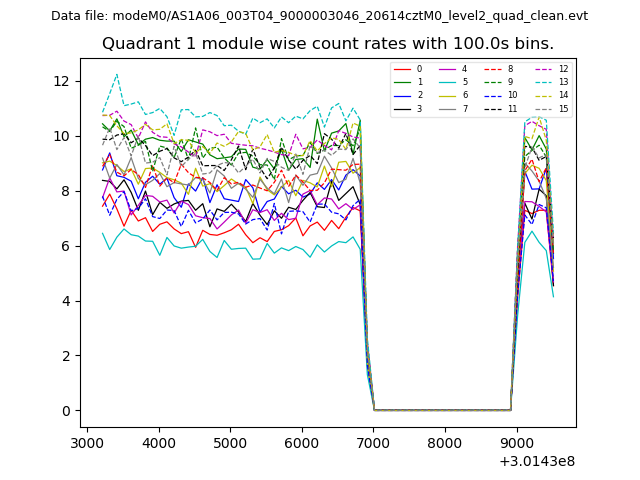 |
 |
| Module-wise count rates for Quadrant C Data is divided into 100 sec bins |
 |
 |
| Module-wise count rates for Quadrant D Data is divided into 100 sec bins |
 |
 |
| Parameter | Plot |
|---|---|
| CZT HV Monitor | 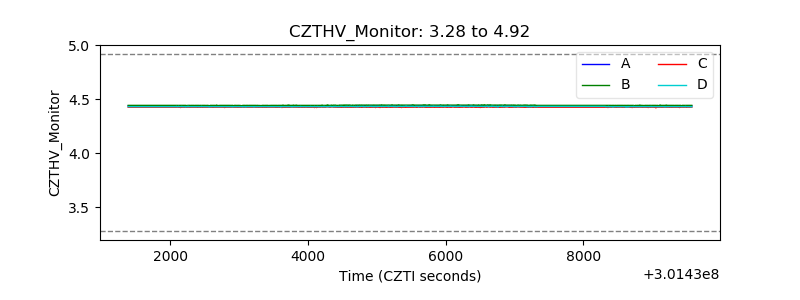 |
| D_VDD | 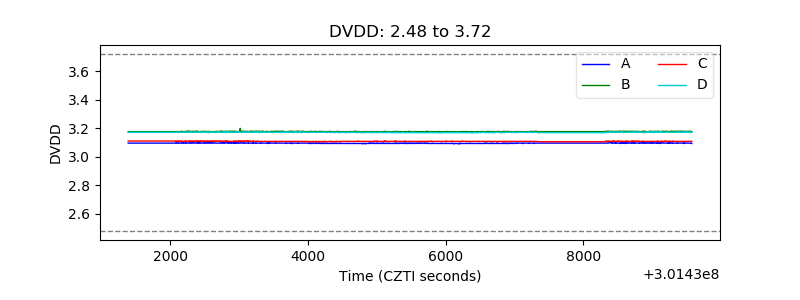 |
| Temperature 1 |  |
| Veto HV Monitor | 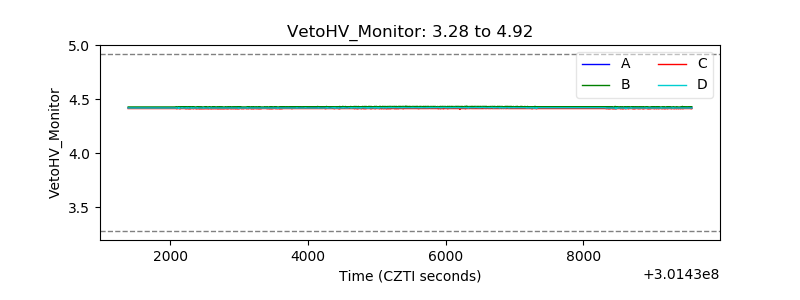 |
| Veto LLD |  |
| Alpha Counter | 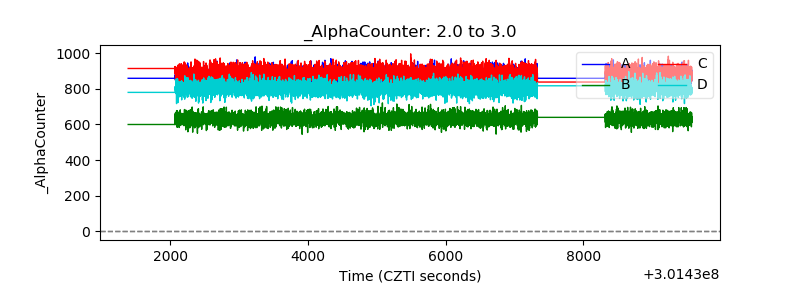 |
| _CPM_Rate | 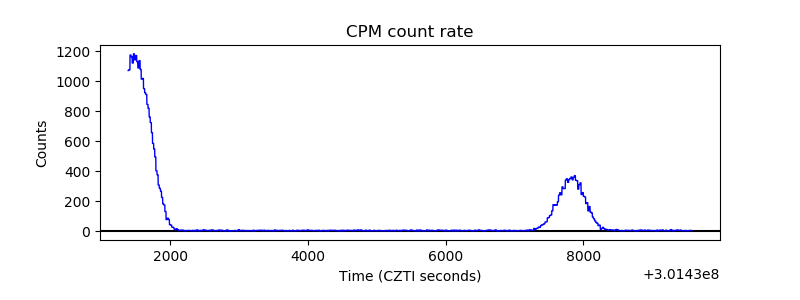 |
| CZT Counter | 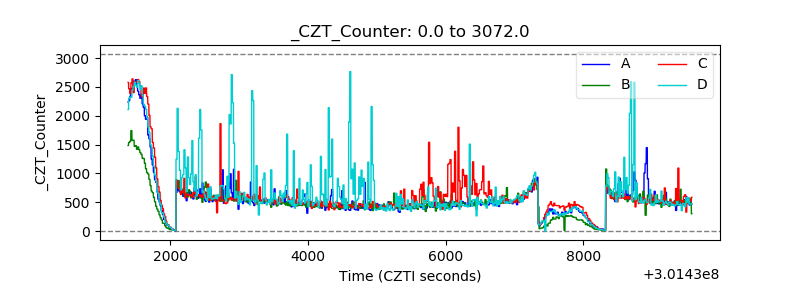 |
| +2.5 Volts monitor |  |
| +5 Volts monitor |  |
| _ROLL_ROT |  |
| _Roll_DEC | 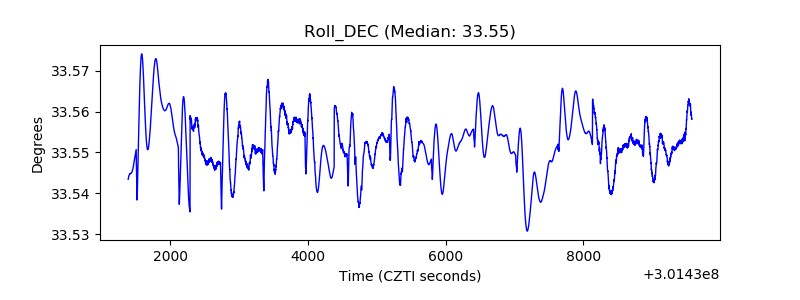 |
| _Roll_RA | 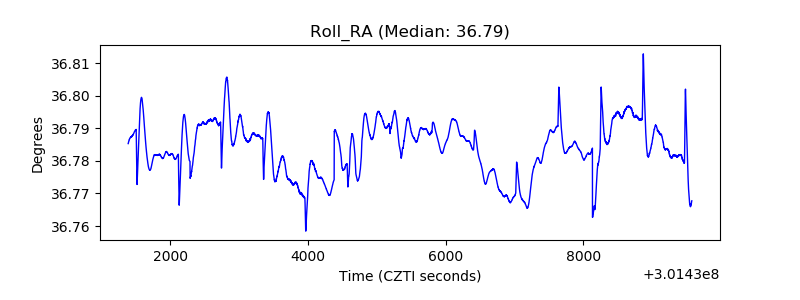 |
| Veto Counter |  |