| Param | Original file | Final file |
|---|---|---|
| Filename | modeM0/AS1A06_003T04_9000003046_20615cztM0_level2.evt | modeM0/AS1A06_003T04_9000003046_20615cztM0_level2_quad_clean.evt |
| Size (bytes) | 178,041,600 | 23,688,000 |
| Size | 169.8 MB | 22.6 MB |
| Events in quadrant A | 1,302,260 | 142,882 |
| Events in quadrant B | 1,234,884 | 144,161 |
| Events in quadrant C | 1,229,588 | 136,623 |
| Events in quadrant D | 1,474,615 | 134,989 |
| Mode M0 | |||
|---|---|---|---|
| Quadrant | BADHDUFLAG | Total packets | Discarded packets |
| A | 0 | 5211 | 1 |
| B | 0 | 4945 | 1 |
| C | 0 | 4893 | 1 |
| D | 0 | 5725 | 1 |
| Mode SS | |||
|---|---|---|---|
| Quadrant | BADHDUFLAG | Total packets | Discarded packets |
| A | 0 | 46 | 0 |
| B | 0 | 46 | 0 |
| C | 0 | 46 | 0 |
| D | 0 | 46 | 0 |
| Mode M9 | |||
|---|---|---|---|
| Quadrant | BADHDUFLAG | Total packets | Discarded packets |
| A | 0 | 10 | 0 |
| B | 0 | 10 | 0 |
| C | 0 | 10 | 0 |
| D | 0 | 10 | 0 |
| Quadrant | Total seconds | Saturated seconds | Saturation percentage |
|---|---|---|---|
| A | 2183 | 79 | 3.618873% |
| B | 2184 | 100 | 4.578755% |
| C | 2184 | 116 | 5.311355% |
| D | 2184 | 130 | 5.952381% |
Noise dominated data is calculated using 1-second bins in cleaned event files. If a bin has >2000 counts, and if more than 50% of those come from <1% of pixels, then it is considered to be noise-dominated and hence unusable.
| Quadrant | # 1 sec bins | Bins with >0 counts | Bins with >2000 counts | High rate bins dominated by noise | Noise dominated (total time) | Noise dominated (detector-on time) | Marked lightcurve |
|---|---|---|---|---|---|---|---|
| A | 3168 | 2184 | 0 | 0 | 0.00% | 0.00% | 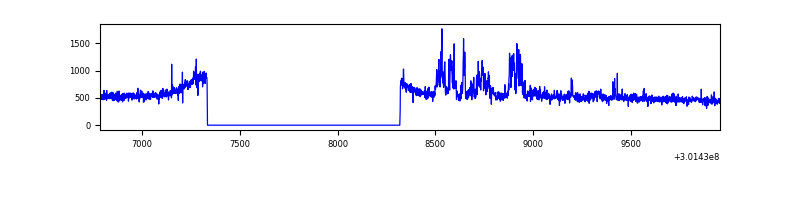 |
| B | 3169 | 2185 | 2 | 2 | 0.06% | 0.09% | 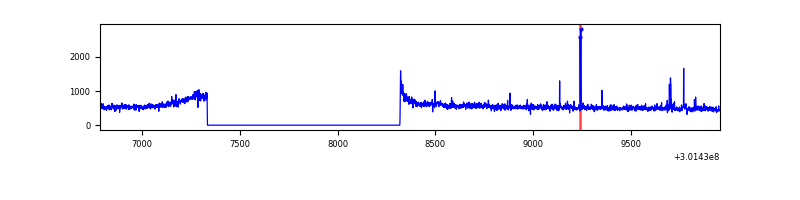 |
| C | 3169 | 2185 | 0 | 0 | 0.00% | 0.00% | 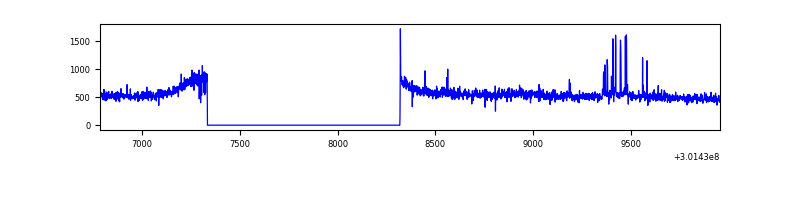 |
| D | 3169 | 2185 | 49 | 49 | 1.55% | 2.24% | 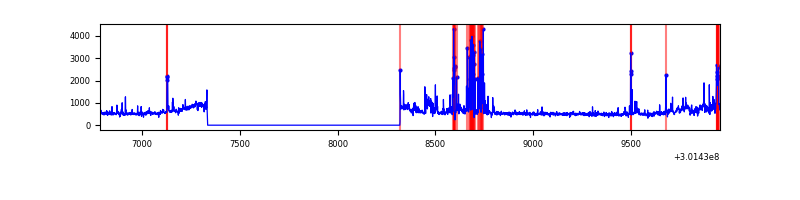 |
Top three noisy pixels from each quadrant. If the there are fewer than three noisy pixels in the level2.evt file, extra rows are filled as -1
| Pixel properties | Quadrant properties | ||||||
|---|---|---|---|---|---|---|---|
| Quadrant | DetID | PixID | Counts | Sigma | Mean | Median | Sigma |
| A | 12 | 16 | 98647 | 1540.1 | 302 | 295 | 63.9 |
| A | 12 | 194 | 20152 | 310.94 | 302 | 295 | 63.9 |
| A | 5 | 16 | 13257 | 202.97 | 302 | 295 | 63.9 |
| B | 0 | 189 | 13287 | 215.01 | 301 | 293 | 60.4 |
| B | 0 | 219 | 12228 | 197.49 | 301 | 293 | 60.4 |
| B | 0 | 228 | 9824 | 157.71 | 301 | 293 | 60.4 |
| C | 14 | 238 | 44819 | 639.55 | 290 | 291 | 69.6 |
| C | 8 | 208 | 39881 | 568.63 | 290 | 291 | 69.6 |
| C | 3 | 233 | 6256 | 85.67 | 290 | 291 | 69.6 |
| D | 5 | 222 | 161376 | 2181.77 | 294 | 285 | 73.8 |
| D | 1 | 52 | 100032 | 1350.95 | 294 | 285 | 73.8 |
| D | 13 | 153 | 46098 | 620.48 | 294 | 285 | 73.8 |
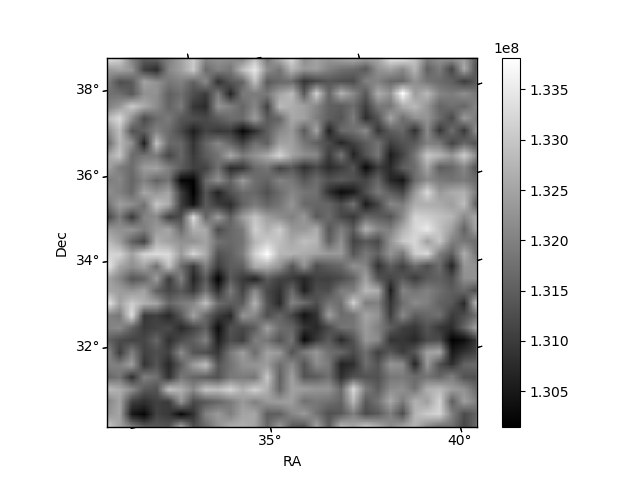
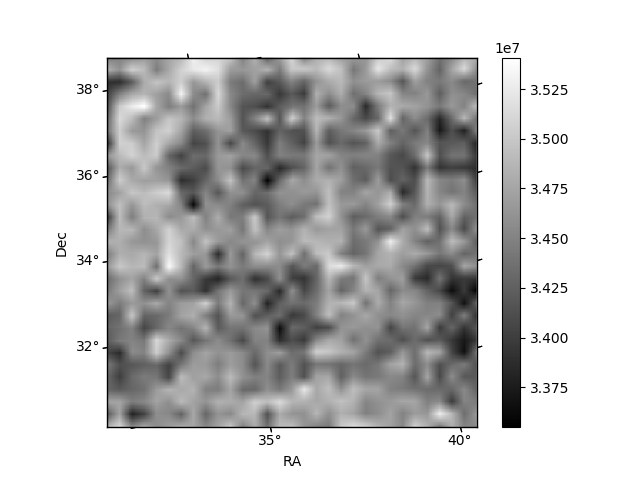
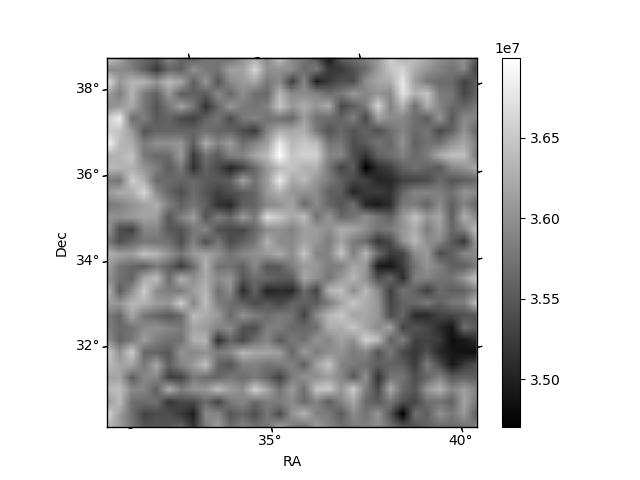
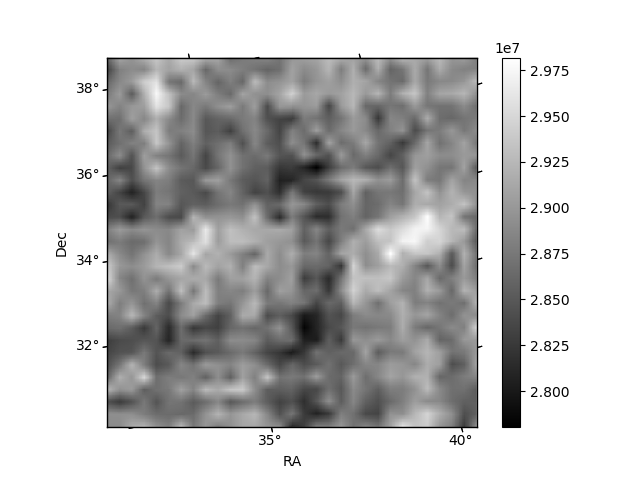
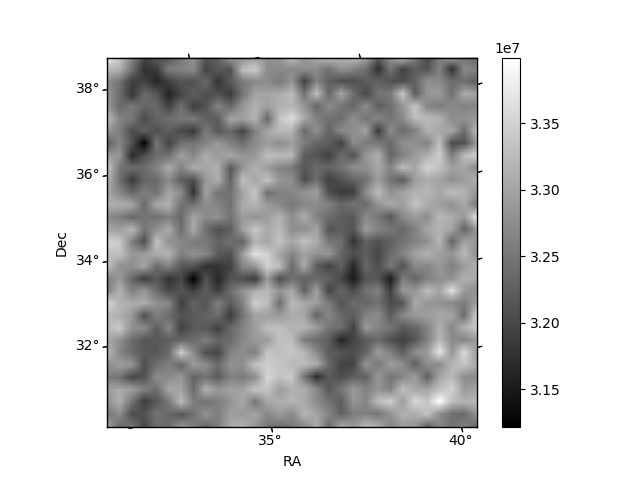
Histogram calculated using DETX and DETY for each event in the final _common_clean file
| Quadrant A | 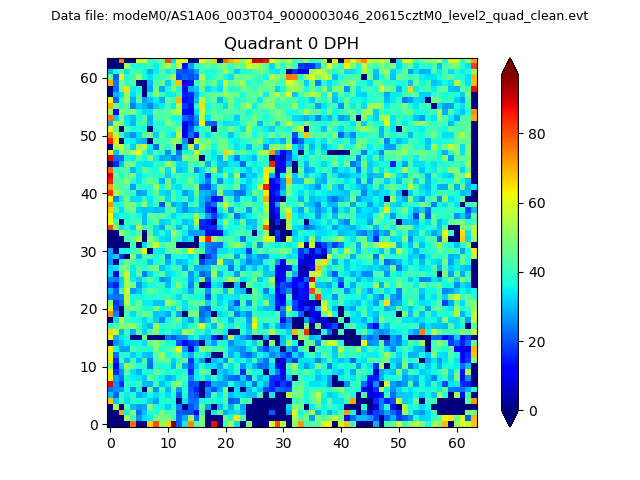 |
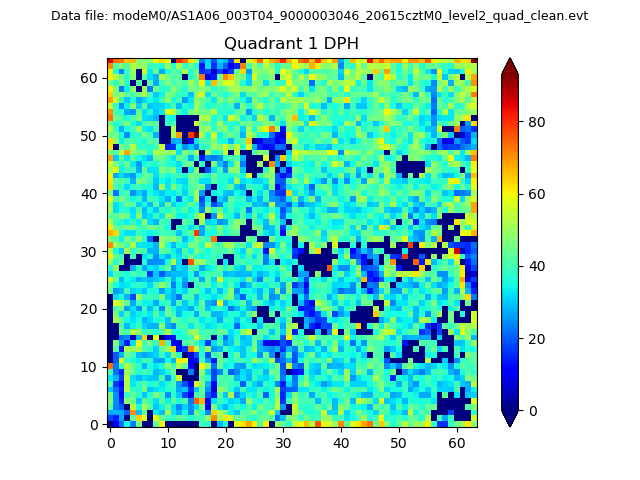 |
Quadrant B |
|---|---|---|---|
| Quadrant D | 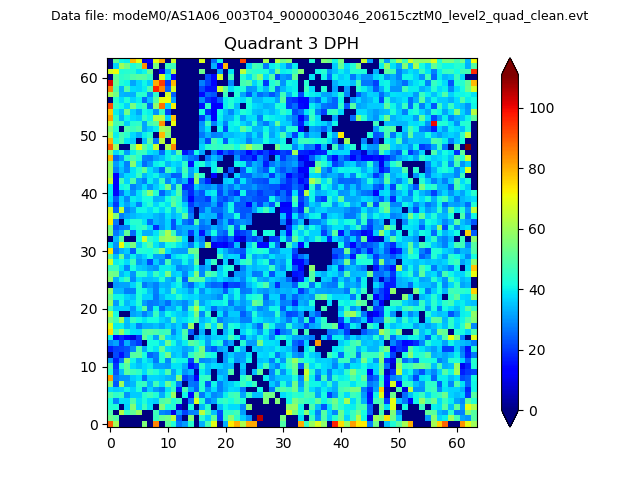 |
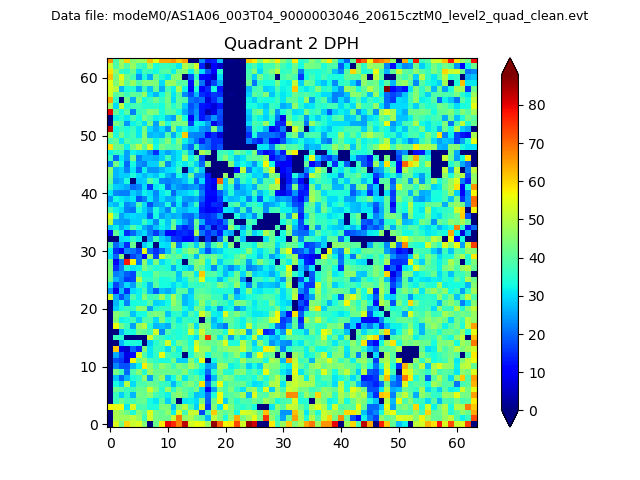 |
Quadrant C |
| Plot type | Count rate plots | Images |
|---|---|---|
| Comparison with Poisson distribution Blue bars denote a histogram of data divided into 1 sec bins. Red curve is a Poisson curve with rate = median count rate of data. |
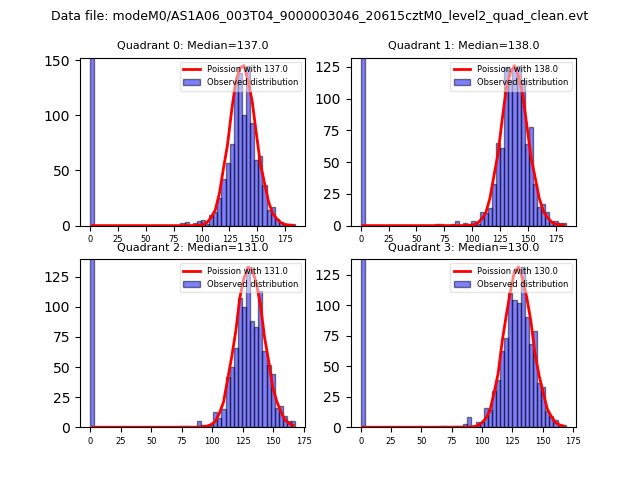 |
 |
| Quadrant-wise count rates Data is divided into 100 sec bins |
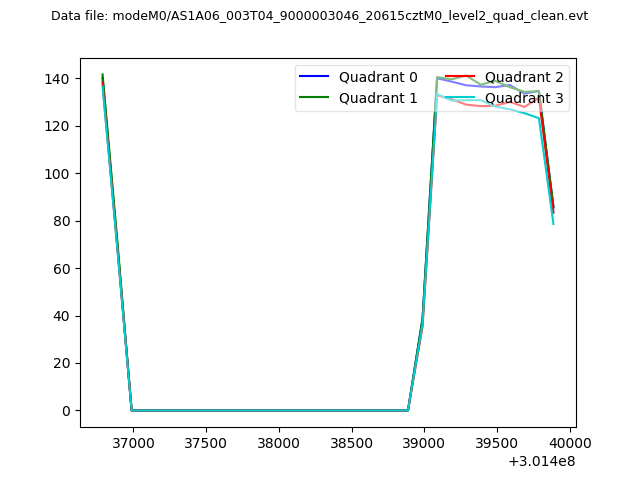 |
|
| Module-wise count rates for Quadrant A Data is divided into 100 sec bins |
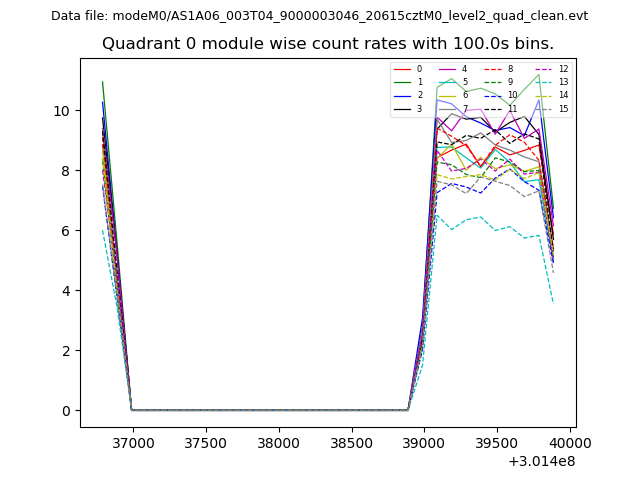 |
 |
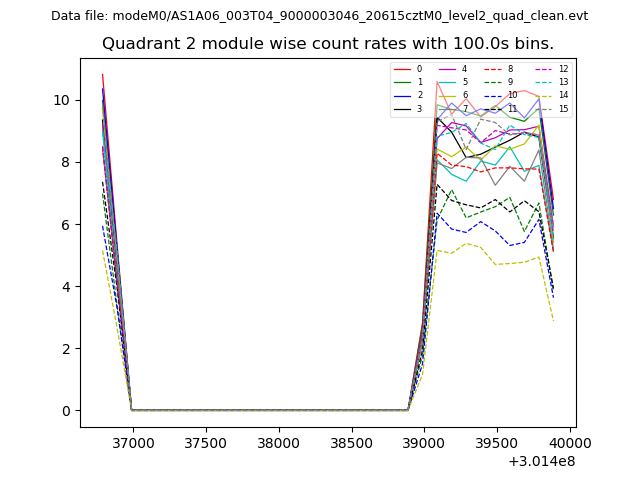
| Module-wise count rates for Quadrant B Data is divided into 100 sec bins |
 |
 |
| Module-wise count rates for Quadrant C Data is divided into 100 sec bins |
 |
 |
| Module-wise count rates for Quadrant D Data is divided into 100 sec bins |
 |
 |
| Parameter | Plot |
|---|---|
| CZT HV Monitor | 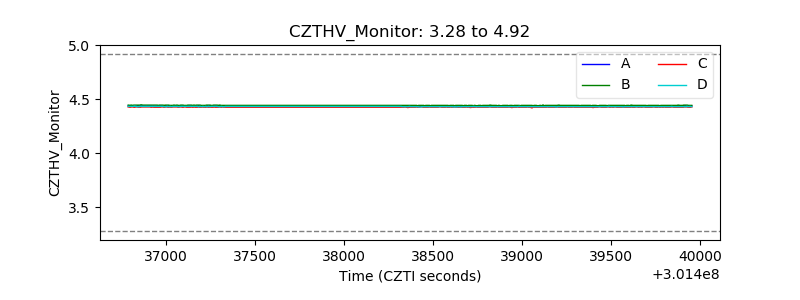 |
| D_VDD |  |
| Temperature 1 | 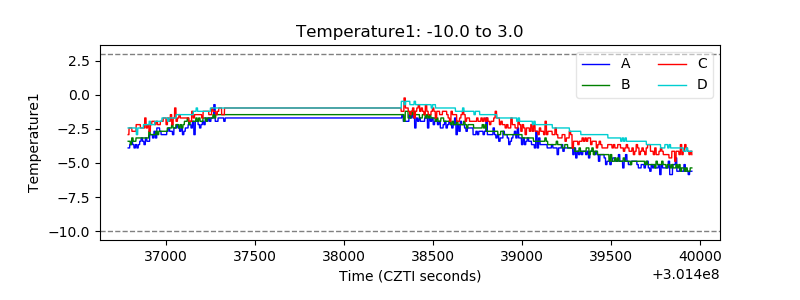 |
| Veto HV Monitor | 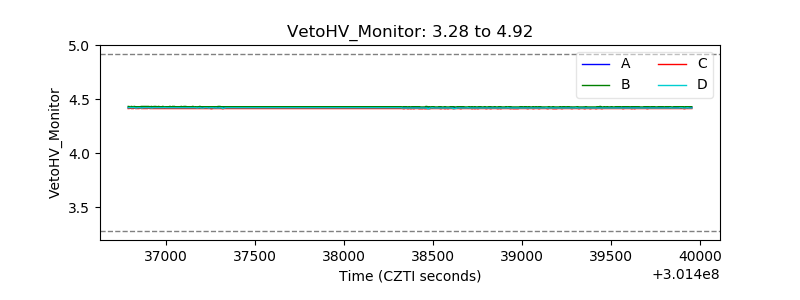 |
| Veto LLD |  |
| Alpha Counter | 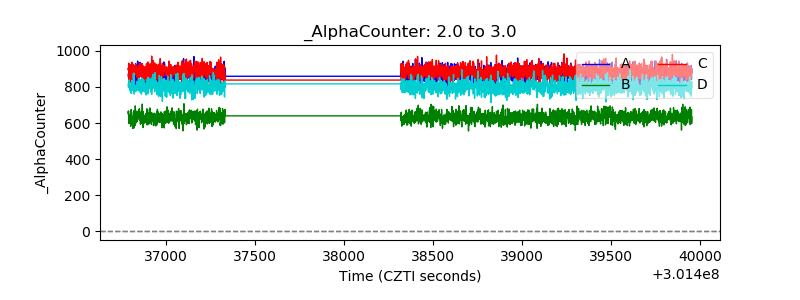 |
| _CPM_Rate | 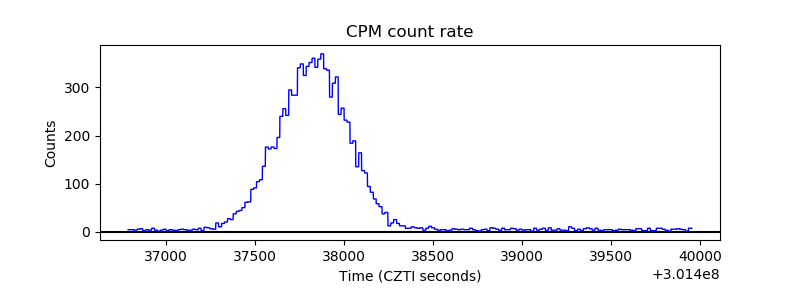 |
| CZT Counter | 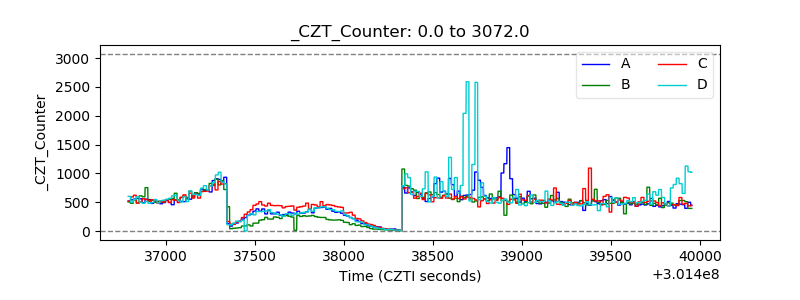 |
| +2.5 Volts monitor |  |
| +5 Volts monitor |  |
| _ROLL_ROT | 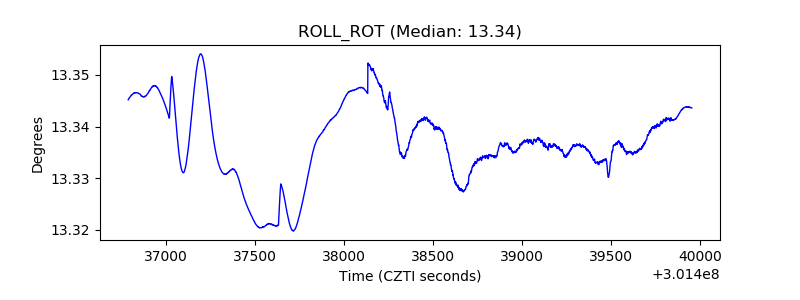 |
| _Roll_DEC | 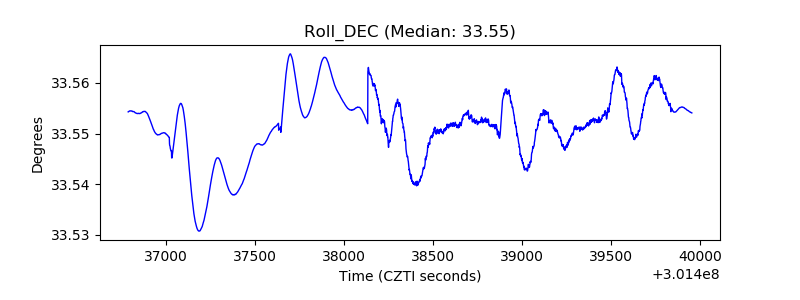 |
| _Roll_RA | 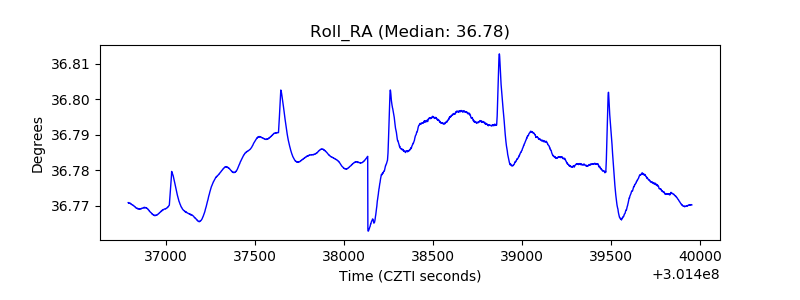 |
| Veto Counter |  |