| Param | Original file | Final file |
|---|---|---|
| Filename | modeM0/AS1A06_009T02_9000003044cztM0_level2.fits | modeM0/AS1A06_009T02_9000003044cztM0_level2_quad_clean.evt |
| Size (bytes) | 88,176,960 | 82,290,240 |
| Size | 84.1 MB | 78.5 MB |
| Events in quadrant A | 535,116 | 486,088 |
| Events in quadrant B | 510,704 | 482,991 |
| Events in quadrant C | 521,176 | 464,916 |
| Events in quadrant D | 434,102 | 388,029 |
| Mode M9 | |||
|---|---|---|---|
| Quadrant | BADHDUFLAG | Total packets | Discarded packets |
| A | 0 | 5 | 0 |
| B | 0 | 5 | 0 |
| C | 0 | 5 | 0 |
| D | 0 | 5 | 0 |
| Mode SS | |||
|---|---|---|---|
| Quadrant | BADHDUFLAG | Total packets | Discarded packets |
| A | 0 | 196 | 0 |
| B | 0 | 196 | 0 |
| C | 0 | 196 | 0 |
| D | 0 | 196 | 0 |
| Mode M0 | |||
|---|---|---|---|
| Quadrant | BADHDUFLAG | Total packets | Discarded packets |
| A | 0 | 19500 | 0 |
| B | 0 | 20866 | 0 |
| C | 0 | 19493 | 0 |
| D | 0 | 30385 | 0 |
| Quadrant | Total seconds | Saturated seconds | Saturation percentage |
|---|---|---|---|
| A | 9650 | 32 | 0.331606% |
| B | 9650 | 103 | 1.067358% |
| C | 9650 | 75 | 0.777202% |
| D | 9650 | 857 | 8.880829% |
Noise dominated data is calculated using 1-second bins in cleaned event files. If a bin has >2000 counts, and if more than 50% of those come from <1% of pixels, then it is considered to be noise-dominated and hence unusable.
| Quadrant | # 1 sec bins | Bins with >0 counts | Bins with >2000 counts | High rate bins dominated by noise | Noise dominated (total time) | Noise dominated (detector-on time) | Marked lightcurve |
|---|---|---|---|---|---|---|---|
| A | 10205 | 9650 | 0 | 0 | 0.00% | 0.00% |  |
| B | 10205 | 9650 | 0 | 0 | 0.00% | 0.00% |  |
| C | 10205 | 9650 | 0 | 0 | 0.00% | 0.00% |  |
| D | 10205 | 9646 | 0 | 0 | 0.00% | 0.00% |  |
Top three noisy pixels from each quadrant. If the there are fewer than three noisy pixels in the level2.evt file, extra rows are filled as -1
| Pixel properties | Quadrant properties | ||||||
|---|---|---|---|---|---|---|---|
| Quadrant | DetID | PixID | Counts | Sigma | Mean | Median | Sigma |
| A | 14 | 188 | 547 | 11.27 | 139 | 130 | 37.0 |
| A | 0 | 29 | 532 | 10.86 | 139 | 130 | 37.0 |
| A | 14 | 204 | 495 | 9.86 | 139 | 130 | 37.0 |
| B | 2 | 9 | 419 | 9.98 | 135 | 128 | 29.2 |
| B | 14 | 254 | 361 | 7.99 | 135 | 128 | 29.2 |
| B | 3 | 17 | 359 | 7.92 | 135 | 128 | 29.2 |
| C | 1 | 81 | 433 | 8.18 | 137 | 128 | 37.3 |
| C | 1 | 80 | 416 | 7.72 | 137 | 128 | 37.3 |
| C | 3 | 126 | 378 | 6.7 | 137 | 128 | 37.3 |
| D | 3 | 14 | 336 | 6.47 | 123 | 112 | 34.6 |
| D | 3 | 31 | 325 | 6.15 | 123 | 112 | 34.6 |
| D | 15 | 46 | 314 | 5.83 | 123 | 112 | 34.6 |
Histogram calculated using DETX and DETY for each event in the final _common_clean file
| Quadrant A |  |
 |
Quadrant B |
|---|---|---|---|
| Quadrant D |  |
 |
Quadrant C |
| Plot type | Count rate plots | Images |
|---|---|---|
| Comparison with Poisson distribution Blue bars denote a histogram of data divided into 1 sec bins. Red curve is a Poisson curve with rate = median count rate of data. |
 |
 |
| Quadrant-wise count rates Data is divided into 100 sec bins |
 |
|
| Module-wise count rates for Quadrant A Data is divided into 100 sec bins |
 |
 |
| Module-wise count rates for Quadrant B Data is divided into 100 sec bins |
 |
 |
| Module-wise count rates for Quadrant C Data is divided into 100 sec bins |
 |
 |
| Module-wise count rates for Quadrant D Data is divided into 100 sec bins |
 |
 |
| Parameter | Plot |
|---|---|
| CZT HV Monitor |  |
| D_VDD | 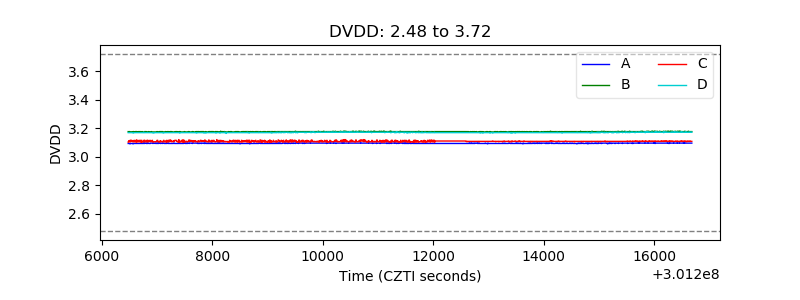 |
| Temperature 1 |  |
| Veto HV Monitor |  |
| Veto LLD |  |
| Alpha Counter |  |
| _CPM_Rate |  |
| CZT Counter | 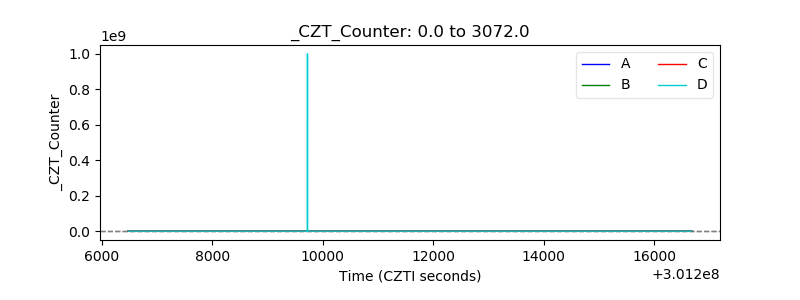 |
| +2.5 Volts monitor |  |
| +5 Volts monitor |  |
| _ROLL_ROT |  |
| _Roll_DEC |  |
| _Roll_RA |  |
| Veto Counter |  |