| Param | Original file | Final file |
|---|---|---|
| Filename | modeM0/AS1A06_009T02_9000003044_20574cztM0_level2.evt | modeM0/AS1A06_009T02_9000003044_20574cztM0_level2_quad_clean.evt |
| Size (bytes) | 102,548,160 | 7,436,160 |
| Size | 97.8 MB | 7.1 MB |
| Events in quadrant A | 585,977 | 31,122 |
| Events in quadrant B | 610,717 | 31,529 |
| Events in quadrant C | 613,546 | 29,298 |
| Events in quadrant D | 1,198,867 | 29,787 |
| Mode SS | |||
|---|---|---|---|
| Quadrant | BADHDUFLAG | Total packets | Discarded packets |
| A | 0 | 28 | 0 |
| B | 0 | 28 | 0 |
| C | 0 | 28 | 0 |
| D | 0 | 28 | 0 |
| Mode M0 | |||
|---|---|---|---|
| Quadrant | BADHDUFLAG | Total packets | Discarded packets |
| A | 0 | 2748 | 0 |
| B | 0 | 2757 | 0 |
| C | 0 | 2751 | 0 |
| D | 0 | 4555 | 0 |
| Quadrant | Total seconds | Saturated seconds | Saturation percentage |
|---|---|---|---|
| A | 1373 | 2 | 0.145666% |
| B | 1373 | 0 | 0.000000% |
| C | 1373 | 2 | 0.145666% |
| D | 1373 | 199 | 14.493809% |
Noise dominated data is calculated using 1-second bins in cleaned event files. If a bin has >2000 counts, and if more than 50% of those come from <1% of pixels, then it is considered to be noise-dominated and hence unusable.
| Quadrant | # 1 sec bins | Bins with >0 counts | Bins with >2000 counts | High rate bins dominated by noise | Noise dominated (total time) | Noise dominated (detector-on time) | Marked lightcurve |
|---|---|---|---|---|---|---|---|
| A | 1373 | 1373 | 0 | 0 | 0.00% | 0.00% | 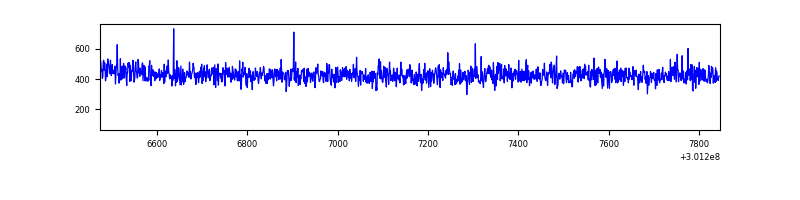 |
| B | 1373 | 1373 | 0 | 0 | 0.00% | 0.00% | 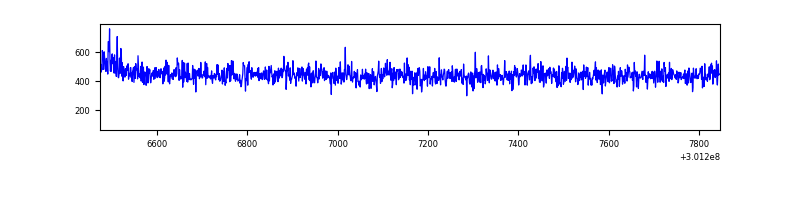 |
| C | 1373 | 1373 | 0 | 0 | 0.00% | 0.00% | 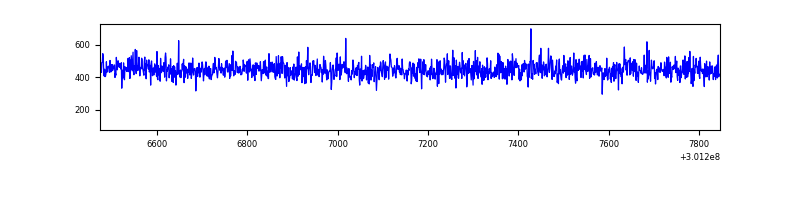 |
| D | 1373 | 1373 | 158 | 158 | 11.51% | 11.51% | 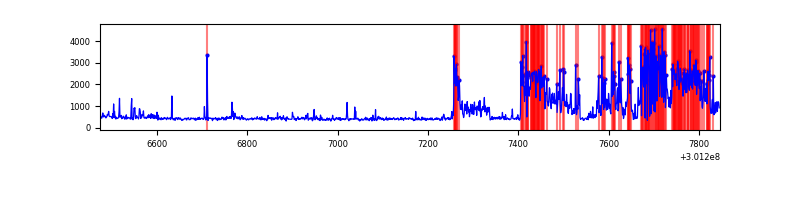 |
Top three noisy pixels from each quadrant. If the there are fewer than three noisy pixels in the level2.evt file, extra rows are filled as -1
| Pixel properties | Quadrant properties | ||||||
|---|---|---|---|---|---|---|---|
| Quadrant | DetID | PixID | Counts | Sigma | Mean | Median | Sigma |
| A | 6 | 240 | 2853 | 82.17 | 151 | 148 | 32.9 |
| A | 3 | 137 | 1304 | 35.12 | 151 | 148 | 32.9 |
| A | 0 | 226 | 1245 | 33.33 | 151 | 148 | 32.9 |
| B | 0 | 230 | 3966 | 120.71 | 154 | 150 | 31.6 |
| B | 12 | 111 | 3671 | 111.38 | 154 | 150 | 31.6 |
| B | 11 | 111 | 3101 | 93.35 | 154 | 150 | 31.6 |
| C | 14 | 238 | 23724 | 637.66 | 149 | 149 | 37.0 |
| C | 8 | 128 | 4853 | 127.23 | 149 | 149 | 37.0 |
| C | 8 | 112 | 1659 | 40.84 | 149 | 149 | 37.0 |
| D | 5 | 222 | 629463 | 17682.07 | 138 | 134 | 35.6 |
| D | 1 | 20 | 24662 | 689.16 | 138 | 134 | 35.6 |
| D | 1 | 52 | 14976 | 417.01 | 138 | 134 | 35.6 |
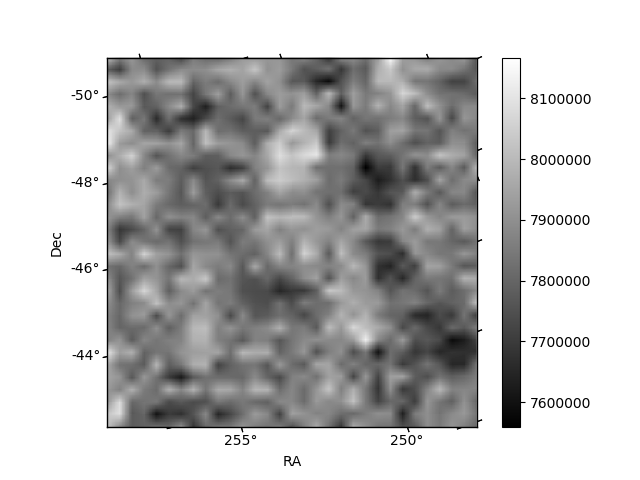
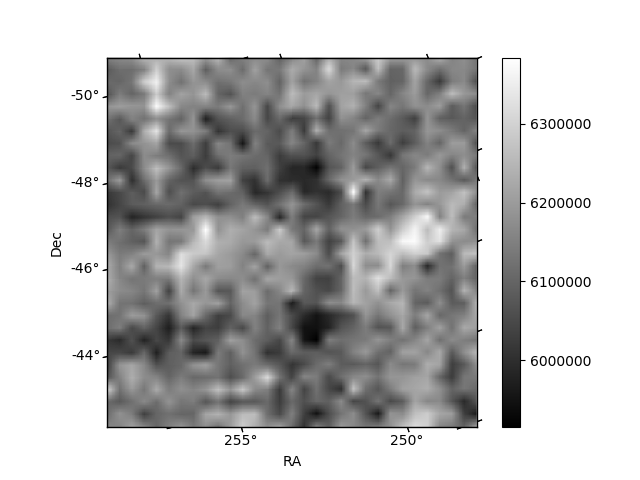
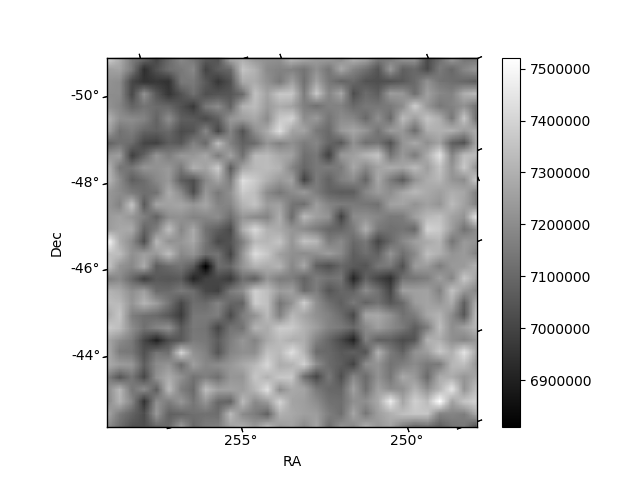
Histogram calculated using DETX and DETY for each event in the final _common_clean file
| Quadrant A | 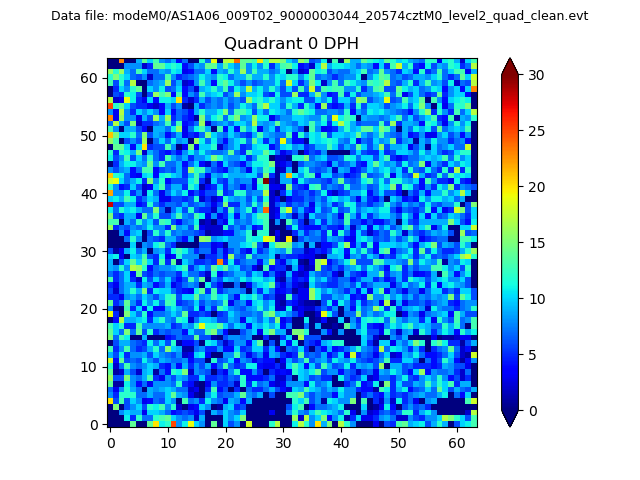 |
 |
Quadrant B |
|---|---|---|---|
| Quadrant D |  |
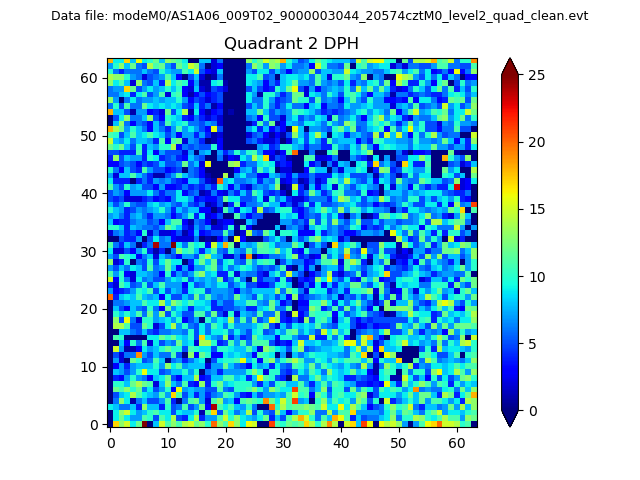 |
Quadrant C |
| Plot type | Count rate plots | Images |
|---|---|---|
| Comparison with Poisson distribution Blue bars denote a histogram of data divided into 1 sec bins. Red curve is a Poisson curve with rate = median count rate of data. |
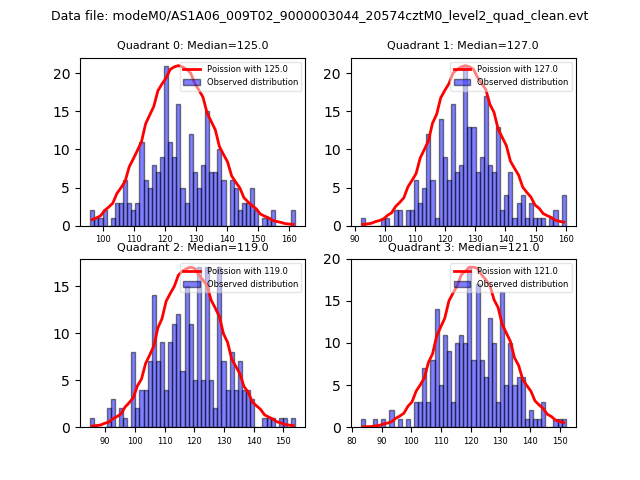 |
 |
| Quadrant-wise count rates Data is divided into 100 sec bins |
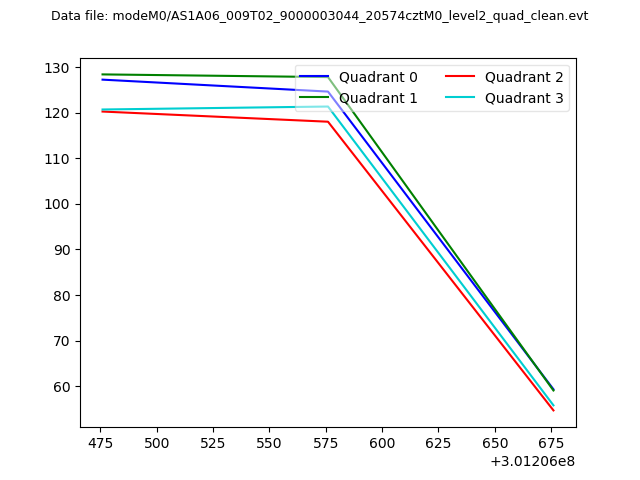 |
|
| Module-wise count rates for Quadrant A Data is divided into 100 sec bins |
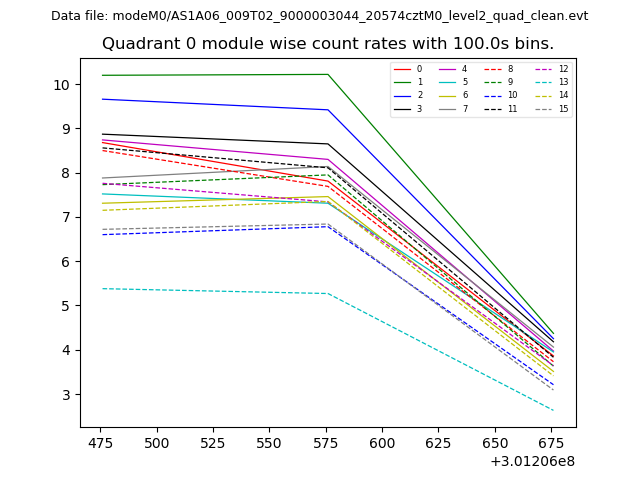 |
 |
| Module-wise count rates for Quadrant B Data is divided into 100 sec bins |
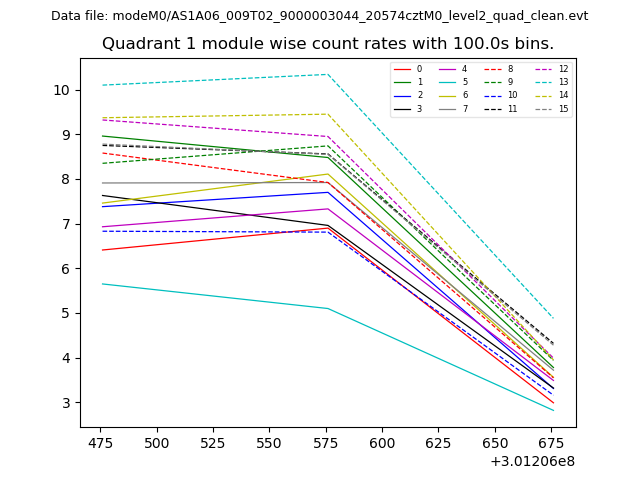 |
 |
| Module-wise count rates for Quadrant C Data is divided into 100 sec bins |
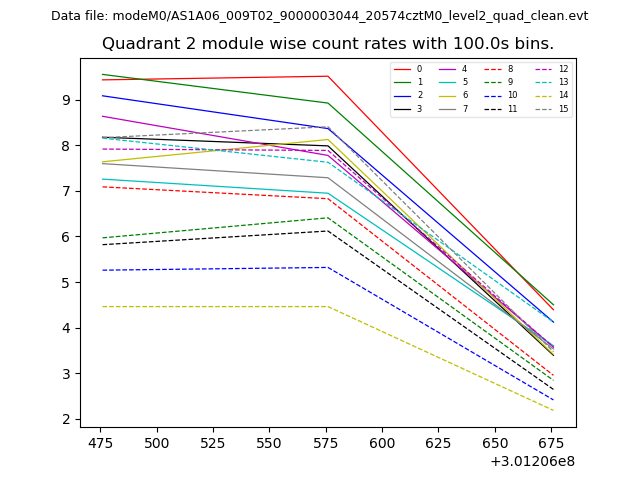 |
 |
| Module-wise count rates for Quadrant D Data is divided into 100 sec bins |
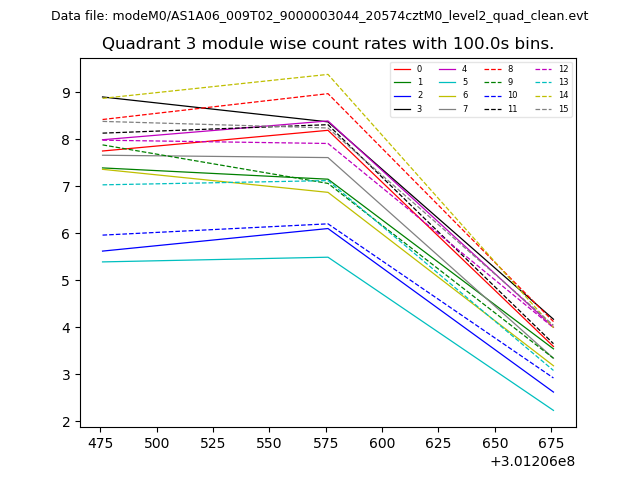 |
 |
| Parameter | Plot |
|---|---|
| CZT HV Monitor |  |
| D_VDD | 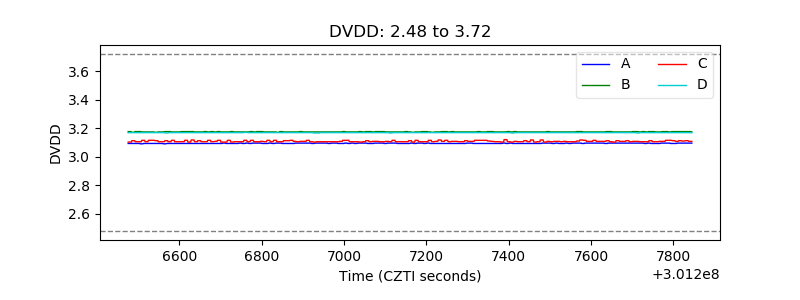 |
| Temperature 1 | 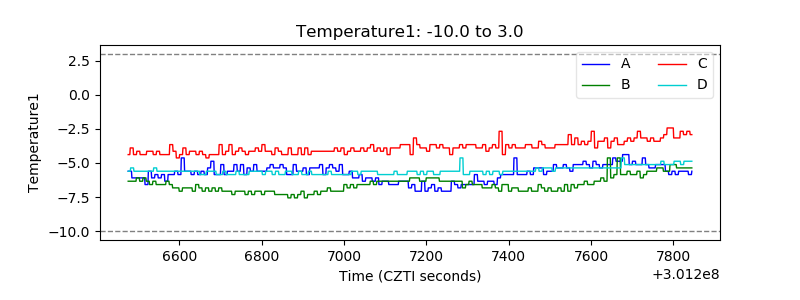 |
| Veto HV Monitor | 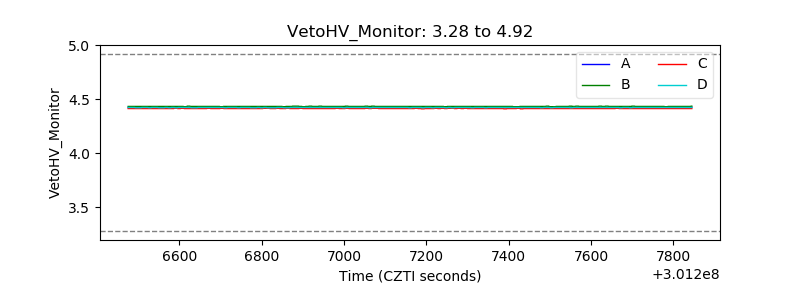 |
| Veto LLD | 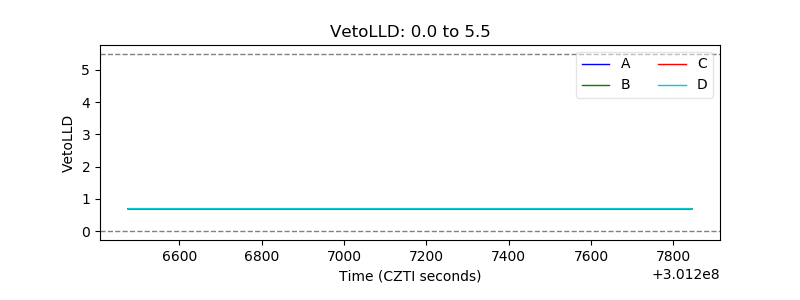 |
| Alpha Counter | 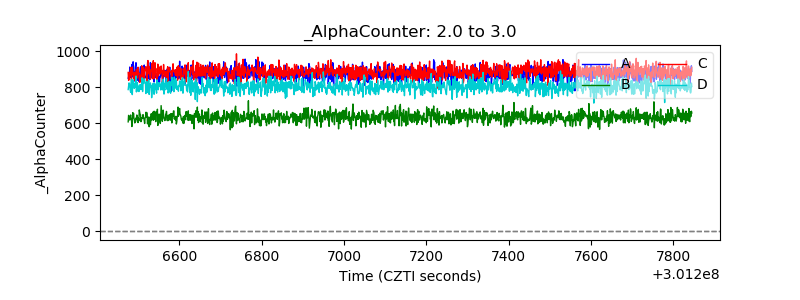 |
| _CPM_Rate | 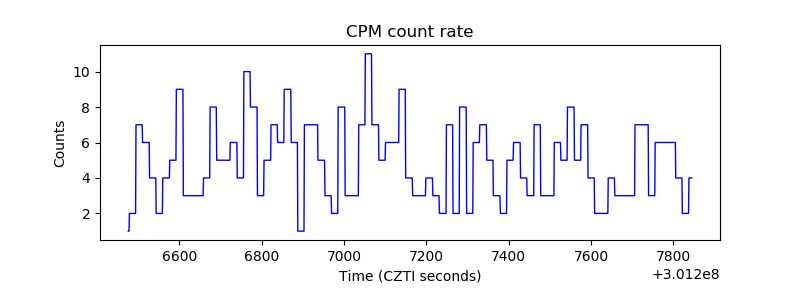 |
| CZT Counter | 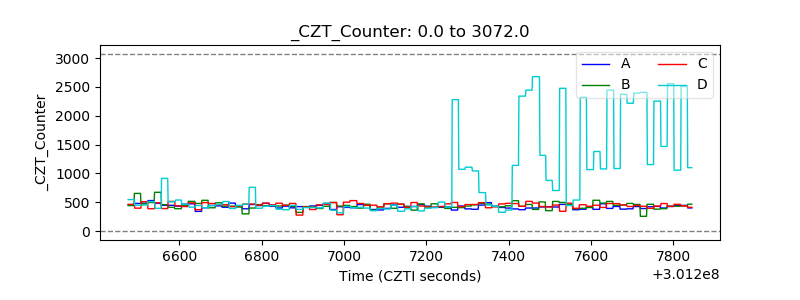 |
| +2.5 Volts monitor |  |
| +5 Volts monitor |  |
| _ROLL_ROT | 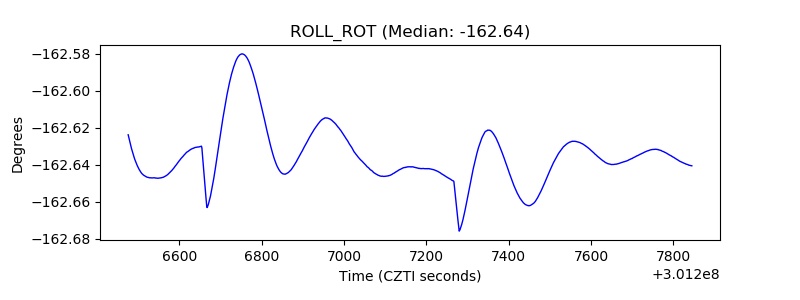 |
| _Roll_DEC | 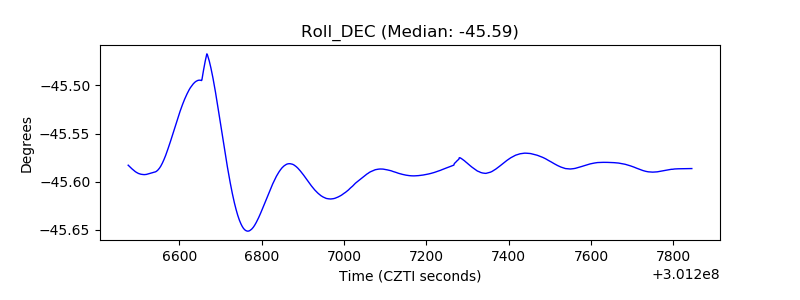 |
| _Roll_RA | 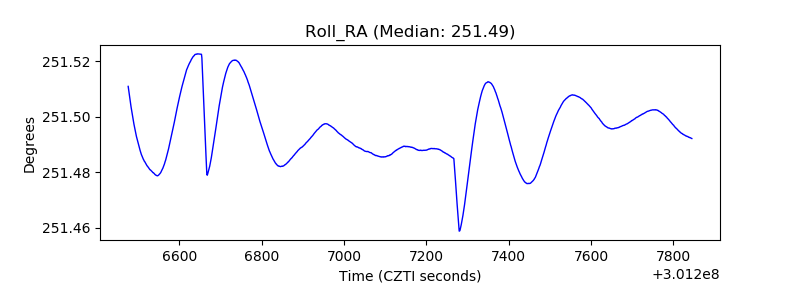 |
| Veto Counter | 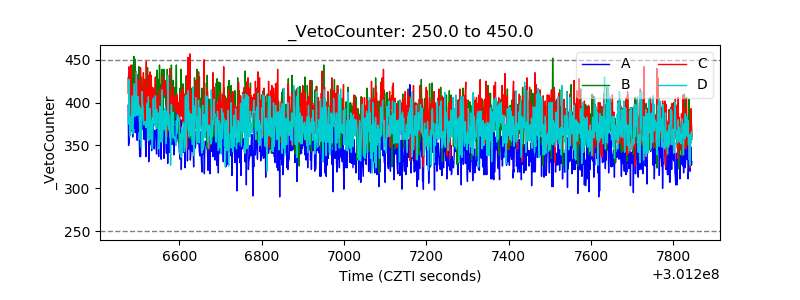 |