| Param | Original file | Final file |
|---|---|---|
| Filename | modeM0/AS1A06_009T02_9000003044_20580cztM0_level2.evt | modeM0/AS1A06_009T02_9000003044_20580cztM0_level2_quad_clean.evt |
| Size (bytes) | 669,395,520 | 109,811,520 |
| Size | 638.4 MB | 104.7 MB |
| Events in quadrant A | 3,913,486 | 701,519 |
| Events in quadrant B | 4,429,240 | 704,394 |
| Events in quadrant C | 3,951,645 | 683,414 |
| Events in quadrant D | 7,391,451 | 634,647 |
| Mode M9 | |||
|---|---|---|---|
| Quadrant | BADHDUFLAG | Total packets | Discarded packets |
| A | 0 | 5 | 0 |
| B | 0 | 5 | 0 |
| C | 0 | 5 | 0 |
| D | 0 | 5 | 0 |
| Mode SS | |||
|---|---|---|---|
| Quadrant | BADHDUFLAG | Total packets | Discarded packets |
| A | 0 | 176 | 0 |
| B | 0 | 176 | 0 |
| C | 0 | 176 | 0 |
| D | 0 | 176 | 0 |
| Mode M0 | |||
|---|---|---|---|
| Quadrant | BADHDUFLAG | Total packets | Discarded packets |
| A | 0 | 17516 | 1 |
| B | 0 | 18876 | 1 |
| C | 0 | 17511 | 1 |
| D | 0 | 27877 | 1 |
| Quadrant | Total seconds | Saturated seconds | Saturation percentage |
|---|---|---|---|
| A | 8659 | 30 | 0.346460% |
| B | 8660 | 103 | 1.189376% |
| C | 8660 | 73 | 0.842956% |
| D | 8660 | 804 | 9.284065% |
Noise dominated data is calculated using 1-second bins in cleaned event files. If a bin has >2000 counts, and if more than 50% of those come from <1% of pixels, then it is considered to be noise-dominated and hence unusable.
| Quadrant | # 1 sec bins | Bins with >0 counts | Bins with >2000 counts | High rate bins dominated by noise | Noise dominated (total time) | Noise dominated (detector-on time) | Marked lightcurve |
|---|---|---|---|---|---|---|---|
| A | 9214 | 8659 | 0 | 0 | 0.00% | 0.00% | 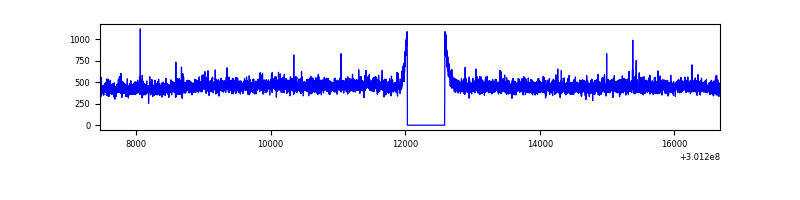 |
| B | 9215 | 8660 | 29 | 29 | 0.31% | 0.33% | 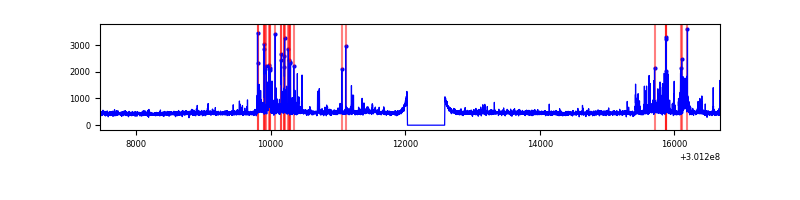 |
| C | 9215 | 8660 | 0 | 0 | 0.00% | 0.00% | 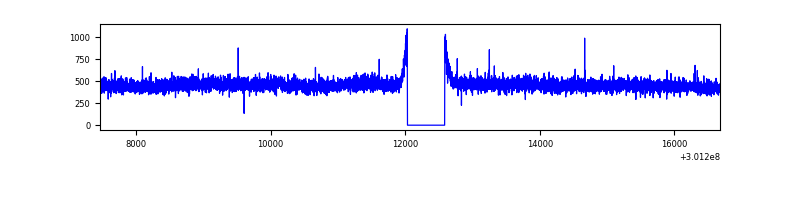 |
| D | 9215 | 8660 | 706 | 706 | 7.66% | 8.15% | 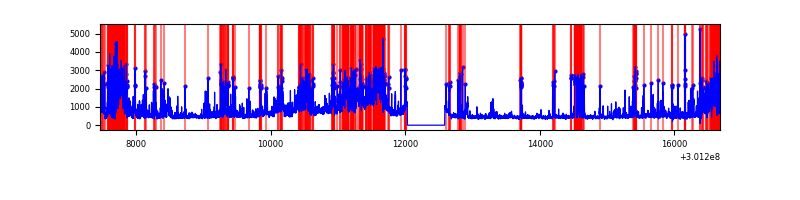 |
Top three noisy pixels from each quadrant. If the there are fewer than three noisy pixels in the level2.evt file, extra rows are filled as -1
| Pixel properties | Quadrant properties | ||||||
|---|---|---|---|---|---|---|---|
| Quadrant | DetID | PixID | Counts | Sigma | Mean | Median | Sigma |
| A | 6 | 240 | 10697 | 47.56 | 1014 | 991 | 204.1 |
| A | 0 | 226 | 8825 | 38.39 | 1014 | 991 | 204.1 |
| A | 3 | 137 | 8479 | 36.69 | 1014 | 991 | 204.1 |
| B | 7 | 220 | 316605 | 1646.48 | 1004 | 980 | 191.7 |
| B | 0 | 197 | 56748 | 290.92 | 1004 | 980 | 191.7 |
| B | 0 | 190 | 45408 | 231.76 | 1004 | 980 | 191.7 |
| C | 14 | 238 | 152426 | 665.39 | 968 | 973 | 227.6 |
| C | 8 | 128 | 11693 | 47.1 | 968 | 973 | 227.6 |
| C | 13 | 61 | 6950 | 26.26 | 968 | 973 | 227.6 |
| D | 5 | 222 | 1784908 | 7733.55 | 951 | 924 | 230.7 |
| D | 1 | 52 | 1096127 | 4747.69 | 951 | 924 | 230.7 |
| D | 1 | 20 | 465350 | 2013.28 | 951 | 924 | 230.7 |
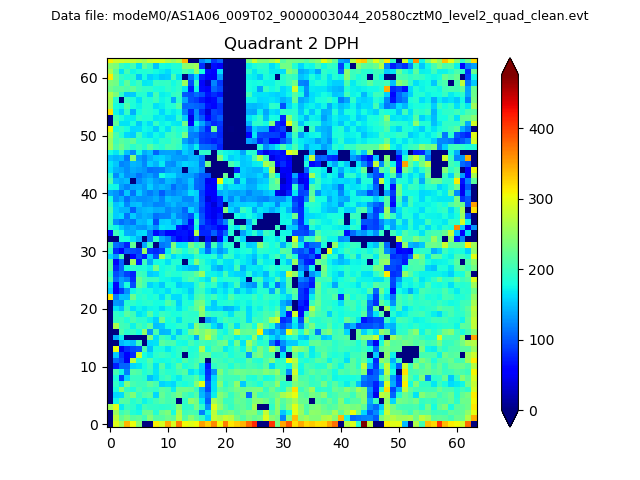
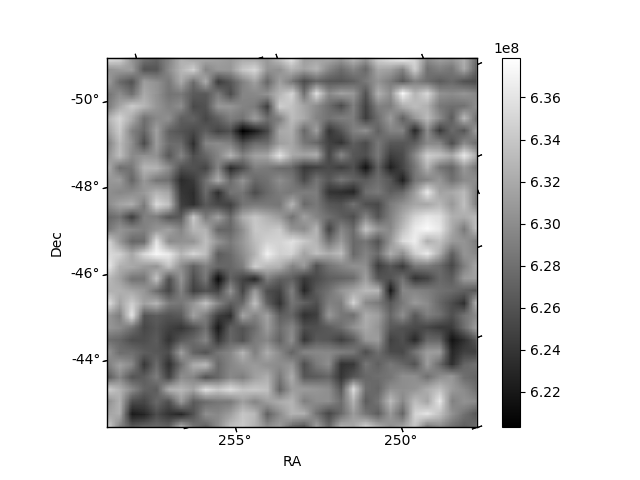
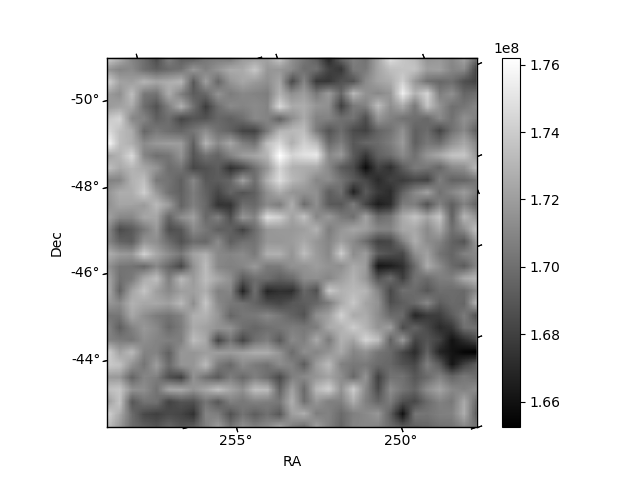
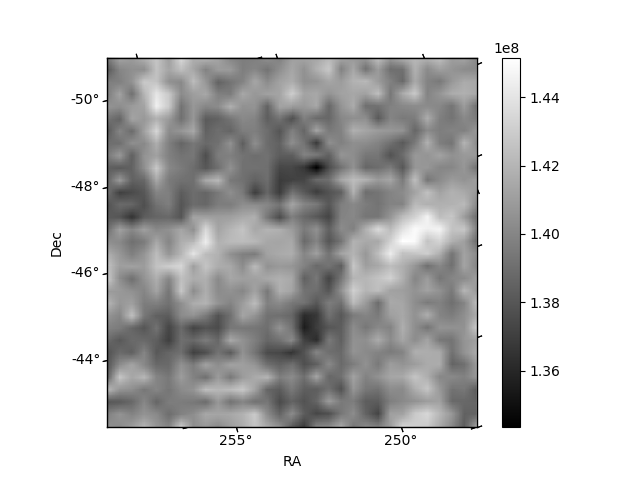
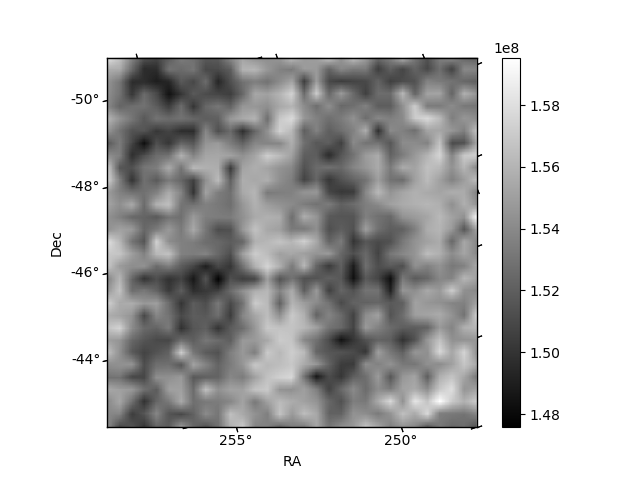
Histogram calculated using DETX and DETY for each event in the final _common_clean file
| Quadrant A | 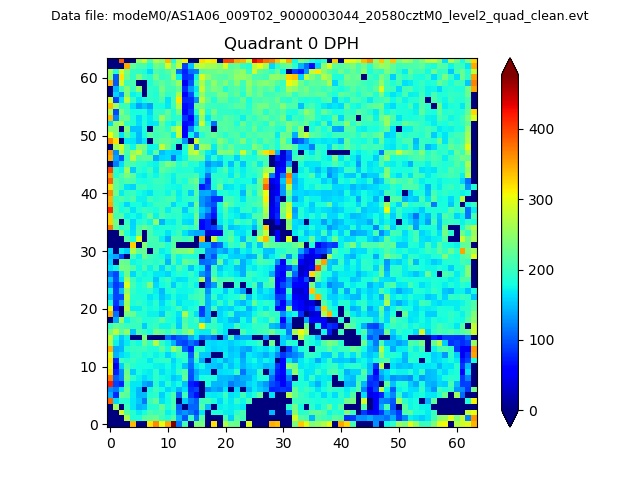 |
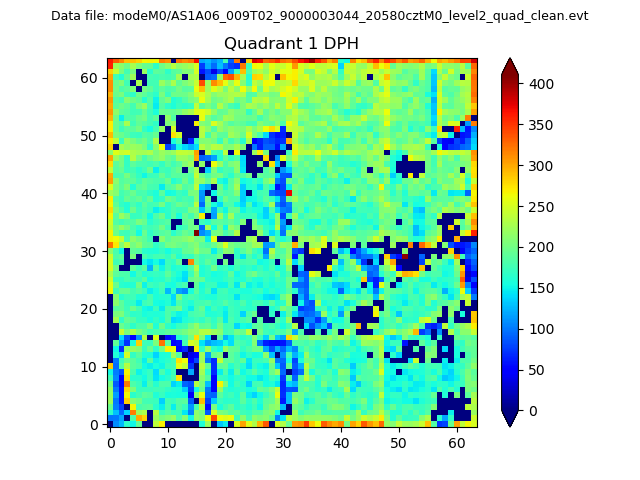 |
Quadrant B |
|---|---|---|---|
| Quadrant D | 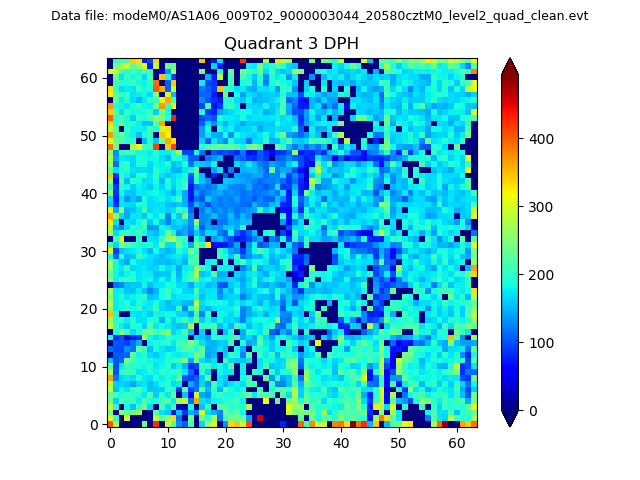 |
 |
Quadrant C |
| Plot type | Count rate plots | Images |
|---|---|---|
| Comparison with Poisson distribution Blue bars denote a histogram of data divided into 1 sec bins. Red curve is a Poisson curve with rate = median count rate of data. |
 |
 |
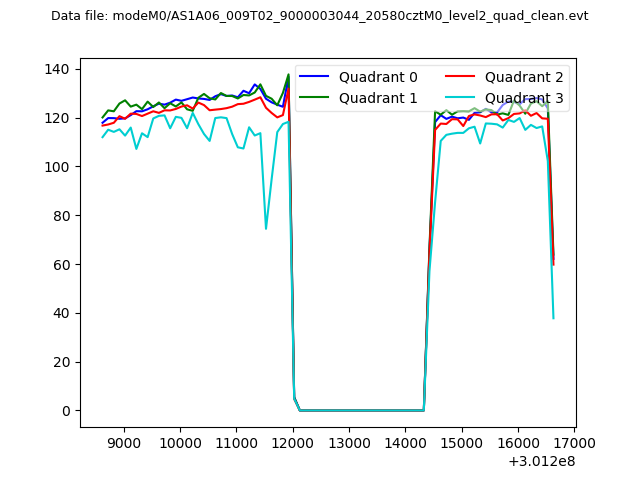
| Quadrant-wise count rates Data is divided into 100 sec bins |
 |
|
| Module-wise count rates for Quadrant A Data is divided into 100 sec bins |
 |
 |
| Module-wise count rates for Quadrant B Data is divided into 100 sec bins |
 |
 |
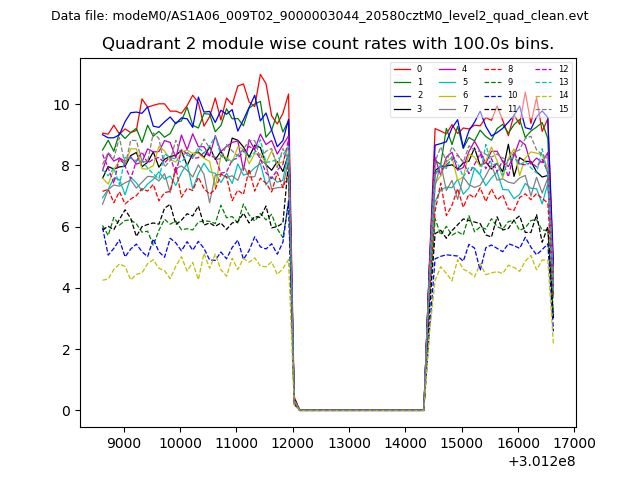
| Module-wise count rates for Quadrant C Data is divided into 100 sec bins |
 |
 |
| Module-wise count rates for Quadrant D Data is divided into 100 sec bins |
 |
 |
| Parameter | Plot |
|---|---|
| CZT HV Monitor | 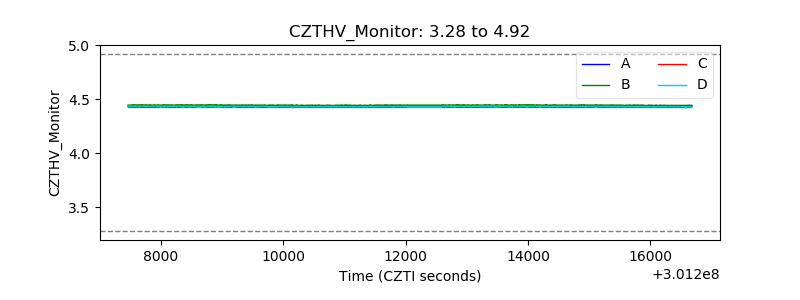 |
| D_VDD | 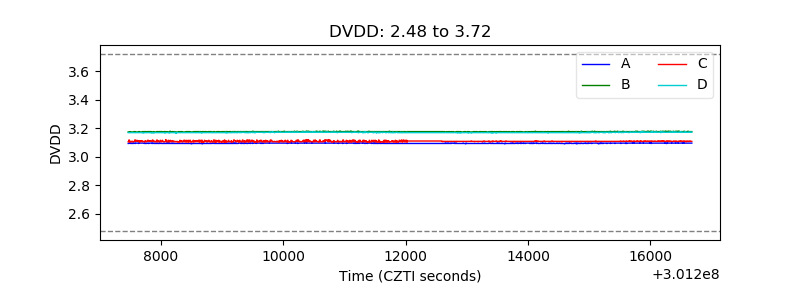 |
| Temperature 1 | 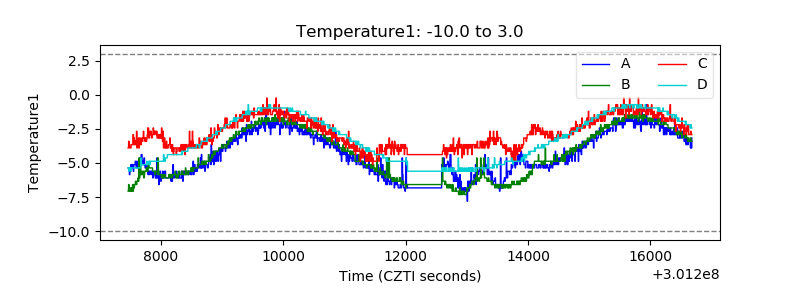 |
| Veto HV Monitor | 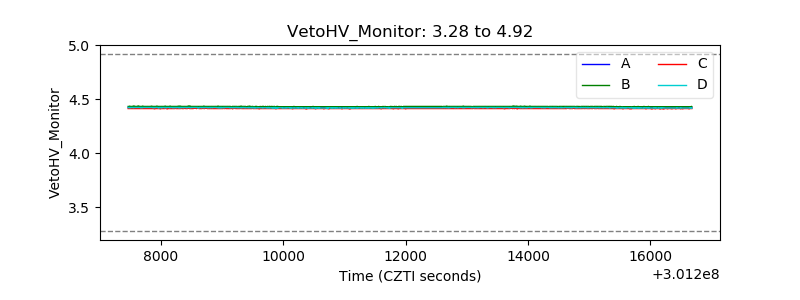 |
| Veto LLD | 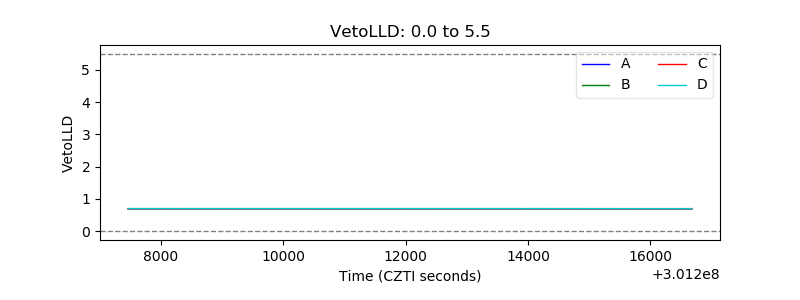 |
| Alpha Counter | 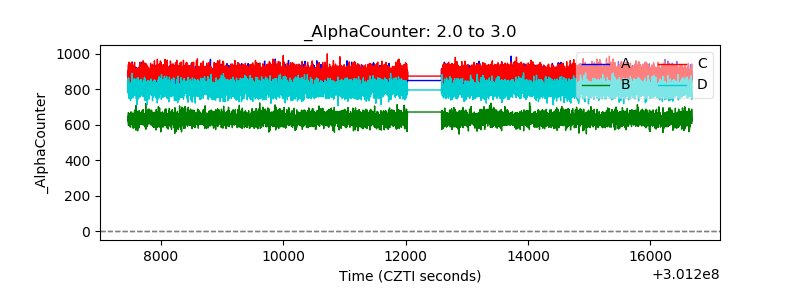 |
| _CPM_Rate | 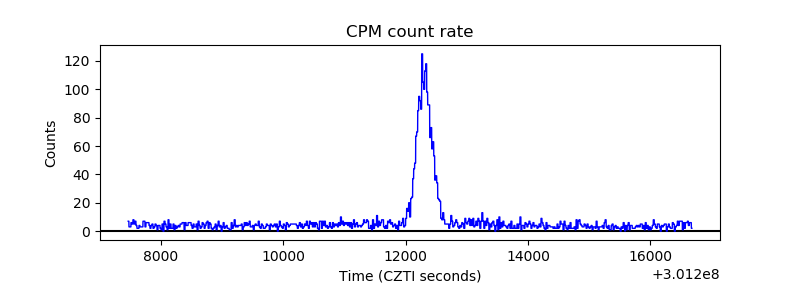 |
| CZT Counter | 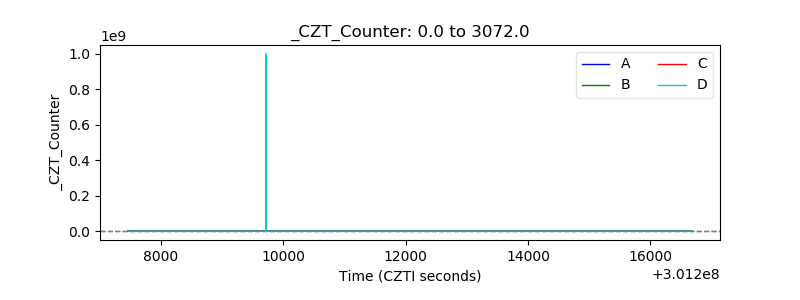 |
| +2.5 Volts monitor |  |
| +5 Volts monitor |  |
| _ROLL_ROT |  |
| _Roll_DEC |  |
| _Roll_RA | 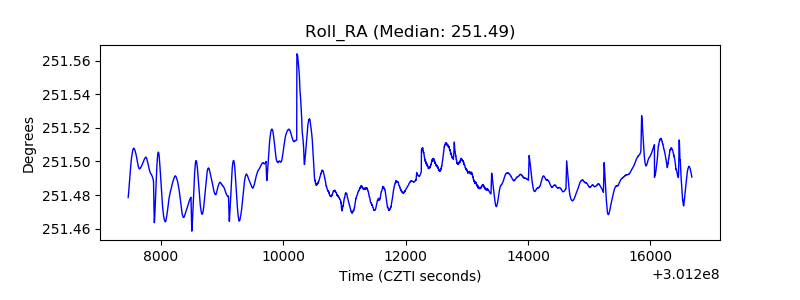 |
| Veto Counter | 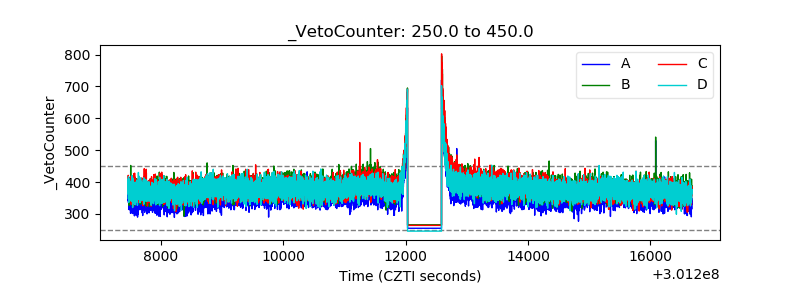 |