| Param | Original file | Final file |
|---|---|---|
| Filename | modeM0/AS1A06_005T02_9000003048cztM0_level2.fits | modeM0/AS1A06_005T02_9000003048cztM0_level2_quad_clean.evt |
| Size (bytes) | 671,754,240 | 629,622,720 |
| Size | 640.6 MB | 600.5 MB |
| Events in quadrant A | 4,215,562 | 3,876,259 |
| Events in quadrant B | 3,985,236 | 3,796,870 |
| Events in quadrant C | 4,046,398 | 3,628,660 |
| Events in quadrant D | 3,413,034 | 3,084,358 |
| Mode M9 | |||
|---|---|---|---|
| Quadrant | BADHDUFLAG | Total packets | Discarded packets |
| A | 0 | 119 | 0 |
| B | 0 | 119 | 0 |
| C | 0 | 119 | 0 |
| D | 0 | 119 | 0 |
| Mode M0 | |||
|---|---|---|---|
| Quadrant | BADHDUFLAG | Total packets | Discarded packets |
| A | 0 | 146666 | 0 |
| B | 0 | 150980 | 0 |
| C | 0 | 150200 | 0 |
| D | 0 | 214548 | 0 |
| Mode SS | |||
|---|---|---|---|
| Quadrant | BADHDUFLAG | Total packets | Discarded packets |
| A | 0 | 1392 | 0 |
| B | 0 | 1392 | 0 |
| C | 0 | 1392 | 0 |
| D | 0 | 1392 | 0 |
| Quadrant | Total seconds | Saturated seconds | Saturation percentage |
|---|---|---|---|
| A | 68276 | 624 | 0.913938% |
| B | 68276 | 1054 | 1.543734% |
| C | 68276 | 1002 | 1.467573% |
| D | 68276 | 6143 | 8.997305% |
Noise dominated data is calculated using 1-second bins in cleaned event files. If a bin has >2000 counts, and if more than 50% of those come from <1% of pixels, then it is considered to be noise-dominated and hence unusable.
| Quadrant | # 1 sec bins | Bins with >0 counts | Bins with >2000 counts | High rate bins dominated by noise | Noise dominated (total time) | Noise dominated (detector-on time) | Marked lightcurve |
|---|---|---|---|---|---|---|---|
| A | 80046 | 68275 | 0 | 0 | 0.00% | 0.00% | 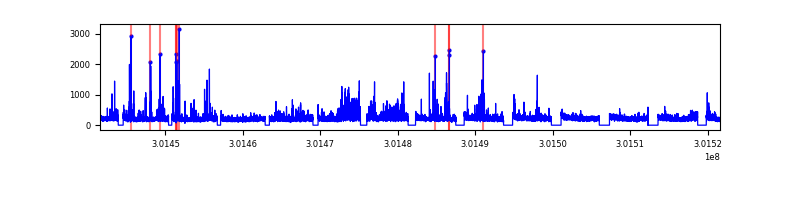 |
| B | 80046 | 68272 | 0 | 0 | 0.00% | 0.00% |  |
| C | 80046 | 68276 | 0 | 0 | 0.00% | 0.00% |  |
| D | 80046 | 68199 | 0 | 0 | 0.00% | 0.00% |  |
Top three noisy pixels from each quadrant. If the there are fewer than three noisy pixels in the level2.evt file, extra rows are filled as -1
| Pixel properties | Quadrant properties | ||||||
|---|---|---|---|---|---|---|---|
| Quadrant | DetID | PixID | Counts | Sigma | Mean | Median | Sigma |
| A | 0 | 29 | 4087 | 11.33 | 1097 | 1031 | 269.8 |
| A | 7 | 110 | 3422 | 8.86 | 1097 | 1031 | 269.8 |
| A | 9 | 19 | 3196 | 8.03 | 1097 | 1031 | 269.8 |
| B | 2 | 9 | 3090 | 10.12 | 1053 | 1007 | 205.9 |
| B | 5 | 128 | 2695 | 8.2 | 1053 | 1007 | 205.9 |
| B | 2 | 8 | 2645 | 7.96 | 1053 | 1007 | 205.9 |
| C | 1 | 81 | 3142 | 7.91 | 1066 | 999 | 270.9 |
| C | 1 | 80 | 3094 | 7.73 | 1066 | 999 | 270.9 |
| C | 12 | 241 | 2917 | 7.08 | 1066 | 999 | 270.9 |
| D | 6 | 231 | 2425 | 5.91 | 975 | 887 | 260.4 |
| D | 7 | 3 | 2410 | 5.85 | 975 | 887 | 260.4 |
| D | 3 | 14 | 2391 | 5.78 | 975 | 887 | 260.4 |
Histogram calculated using DETX and DETY for each event in the final _common_clean file
| Quadrant A | 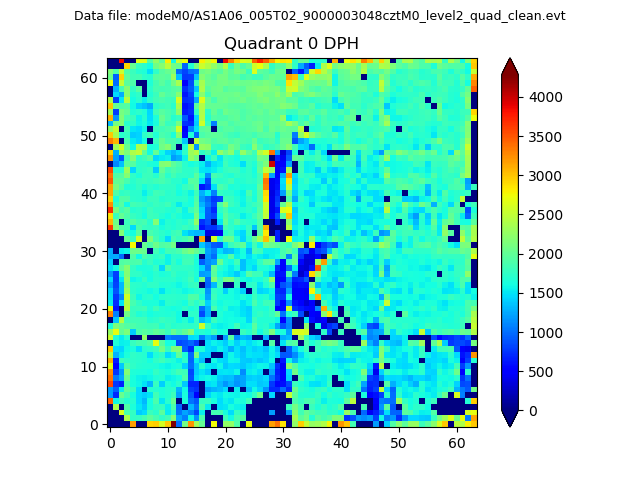 |
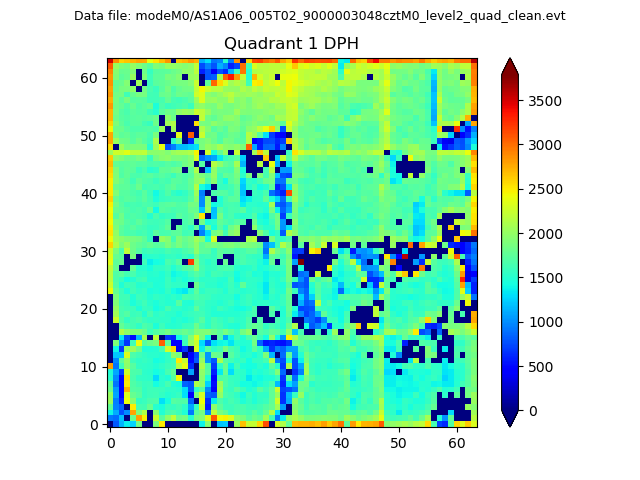 |
Quadrant B |
|---|---|---|---|
| Quadrant D | 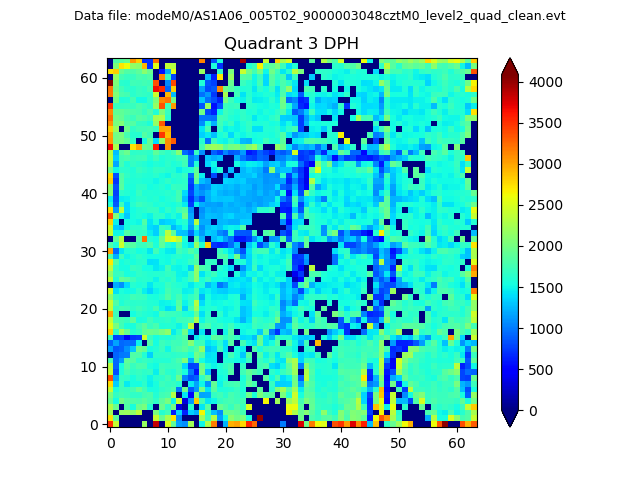 |
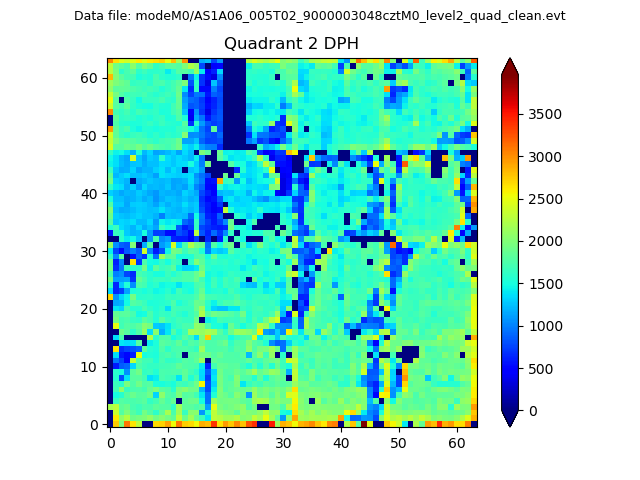 |
Quadrant C |
| Plot type | Count rate plots | Images |
|---|---|---|
| Comparison with Poisson distribution Blue bars denote a histogram of data divided into 1 sec bins. Red curve is a Poisson curve with rate = median count rate of data. |
 |
 |
| Quadrant-wise count rates Data is divided into 100 sec bins |
 |
|
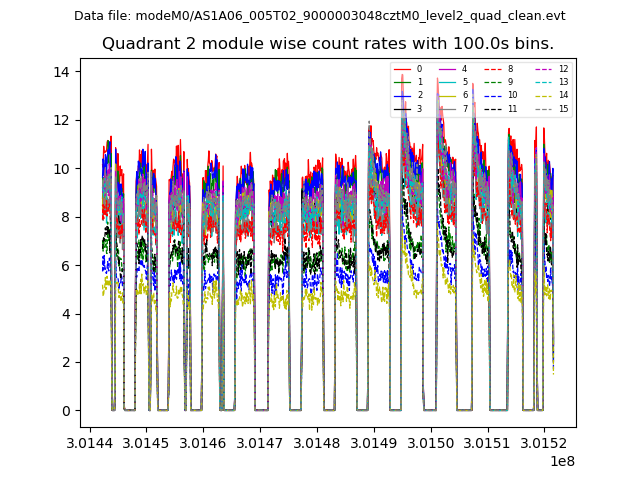
| Module-wise count rates for Quadrant A Data is divided into 100 sec bins |
 |
 |
| Module-wise count rates for Quadrant B Data is divided into 100 sec bins |
 |
 |
| Module-wise count rates for Quadrant C Data is divided into 100 sec bins |
 |
 |
| Module-wise count rates for Quadrant D Data is divided into 100 sec bins |
 |
 |
| Parameter | Plot |
|---|---|
| CZT HV Monitor |  |
| D_VDD |  |
| Temperature 1 |  |
| Veto HV Monitor |  |
| Veto LLD |  |
| Alpha Counter |  |
| _CPM_Rate |  |
| CZT Counter |  |
| +2.5 Volts monitor |  |
| +5 Volts monitor | 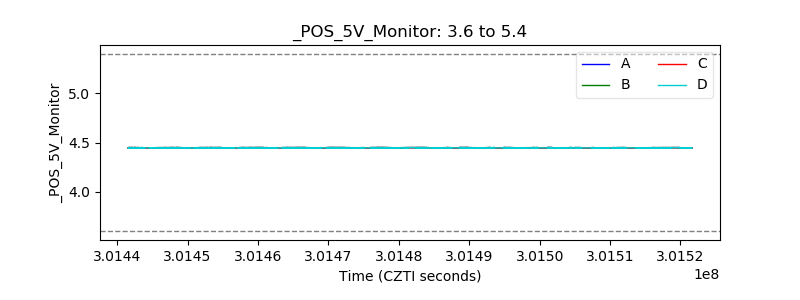 |
| _ROLL_ROT |  |
| _Roll_DEC |  |
| _Roll_RA |  |
| Veto Counter |  |