| Param | Original file | Final file |
|---|---|---|
| Filename | modeM0/AS1A06_005T02_9000003048_20616cztM0_level2.evt | modeM0/AS1A06_005T02_9000003048_20616cztM0_level2_quad_clean.evt |
| Size (bytes) | 670,440,960 | 104,520,960 |
| Size | 639.4 MB | 99.7 MB |
| Events in quadrant A | 3,816,586 | 689,515 |
| Events in quadrant B | 3,931,888 | 687,732 |
| Events in quadrant C | 4,222,443 | 663,020 |
| Events in quadrant D | 7,819,560 | 596,597 |
| Mode M9 | |||
|---|---|---|---|
| Quadrant | BADHDUFLAG | Total packets | Discarded packets |
| A | 0 | 10 | 0 |
| B | 0 | 10 | 0 |
| C | 0 | 10 | 0 |
| D | 0 | 10 | 0 |
| Mode M0 | |||
|---|---|---|---|
| Quadrant | BADHDUFLAG | Total packets | Discarded packets |
| A | 0 | 16308 | 2 |
| B | 0 | 16662 | 2 |
| C | 0 | 17399 | 2 |
| D | 0 | 28321 | 2 |
| Mode SS | |||
|---|---|---|---|
| Quadrant | BADHDUFLAG | Total packets | Discarded packets |
| A | 0 | 156 | 0 |
| B | 0 | 156 | 0 |
| C | 0 | 156 | 0 |
| D | 0 | 156 | 0 |
| Quadrant | Total seconds | Saturated seconds | Saturation percentage |
|---|---|---|---|
| A | 7588 | 80 | 1.054296% |
| B | 7588 | 97 | 1.278334% |
| C | 7589 | 97 | 1.278166% |
| D | 7589 | 1407 | 18.539992% |
Noise dominated data is calculated using 1-second bins in cleaned event files. If a bin has >2000 counts, and if more than 50% of those come from <1% of pixels, then it is considered to be noise-dominated and hence unusable.
| Quadrant | # 1 sec bins | Bins with >0 counts | Bins with >2000 counts | High rate bins dominated by noise | Noise dominated (total time) | Noise dominated (detector-on time) | Marked lightcurve |
|---|---|---|---|---|---|---|---|
| A | 8648 | 7590 | 36 | 36 | 0.42% | 0.47% | 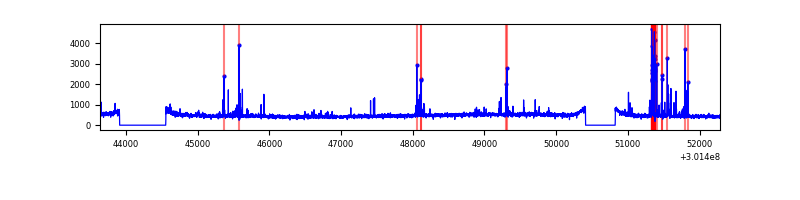 |
| B | 8648 | 7590 | 25 | 25 | 0.29% | 0.33% | 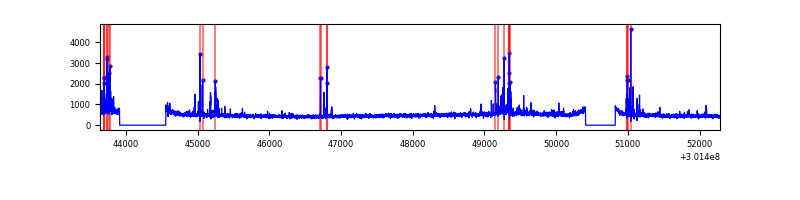 |
| C | 8649 | 7591 | 0 | 0 | 0.00% | 0.00% | 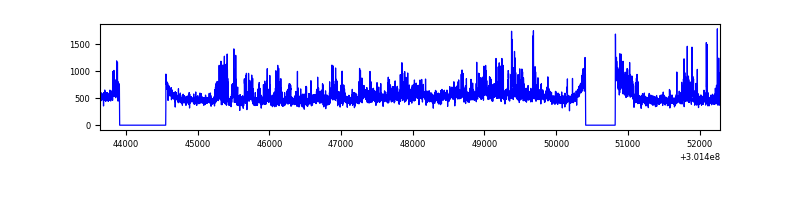 |
| D | 8649 | 7591 | 1337 | 1337 | 15.46% | 17.61% | 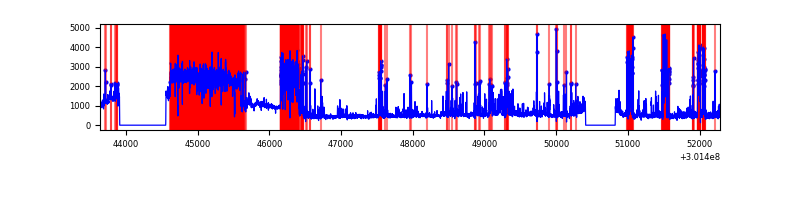 |
Top three noisy pixels from each quadrant. If the there are fewer than three noisy pixels in the level2.evt file, extra rows are filled as -1
| Pixel properties | Quadrant properties | ||||||
|---|---|---|---|---|---|---|---|
| Quadrant | DetID | PixID | Counts | Sigma | Mean | Median | Sigma |
| A | 5 | 16 | 240424 | 1293.98 | 915 | 896 | 185.1 |
| A | 12 | 16 | 25381 | 132.27 | 915 | 896 | 185.1 |
| A | 15 | 174 | 16707 | 85.41 | 915 | 896 | 185.1 |
| B | 7 | 220 | 188936 | 1063.54 | 913 | 890 | 176.8 |
| B | 0 | 190 | 37019 | 204.34 | 913 | 890 | 176.8 |
| B | 3 | 64 | 28152 | 154.19 | 913 | 890 | 176.8 |
| C | 3 | 9 | 417202 | 2051.73 | 870 | 875 | 202.9 |
| C | 14 | 238 | 135297 | 662.46 | 870 | 875 | 202.9 |
| C | 3 | 233 | 126311 | 618.17 | 870 | 875 | 202.9 |
| D | 1 | 52 | 3906366 | 19356.49 | 824 | 799 | 201.8 |
| D | 13 | 153 | 257903 | 1274.24 | 824 | 799 | 201.8 |
| D | 5 | 222 | 241682 | 1193.85 | 824 | 799 | 201.8 |
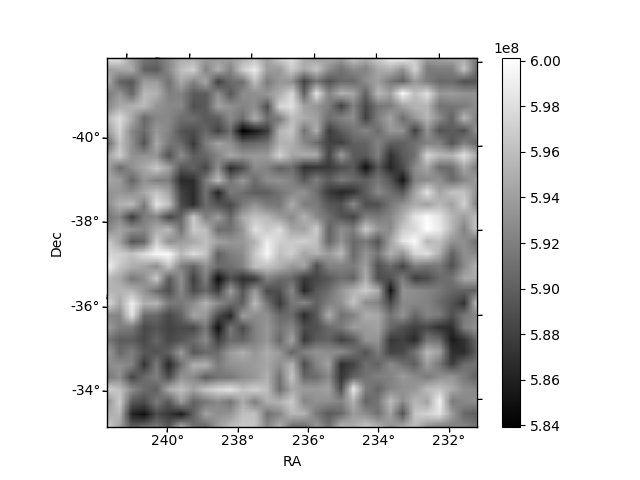
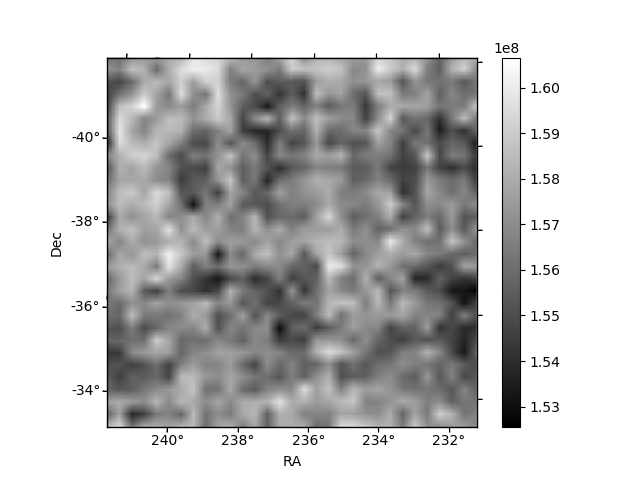
Histogram calculated using DETX and DETY for each event in the final _common_clean file
| Quadrant A | 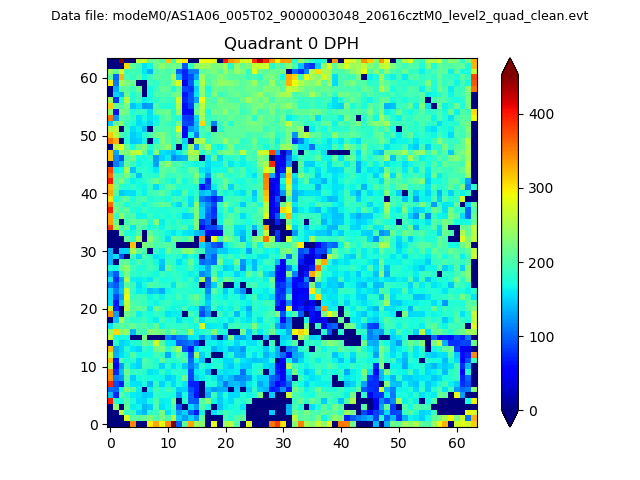 |
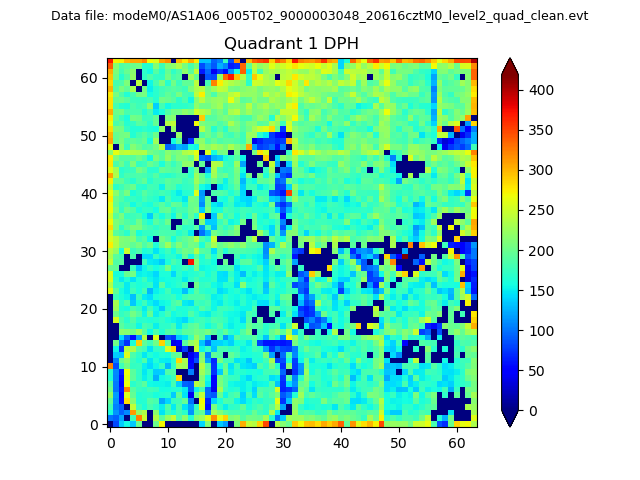 |
Quadrant B |
|---|---|---|---|
| Quadrant D | 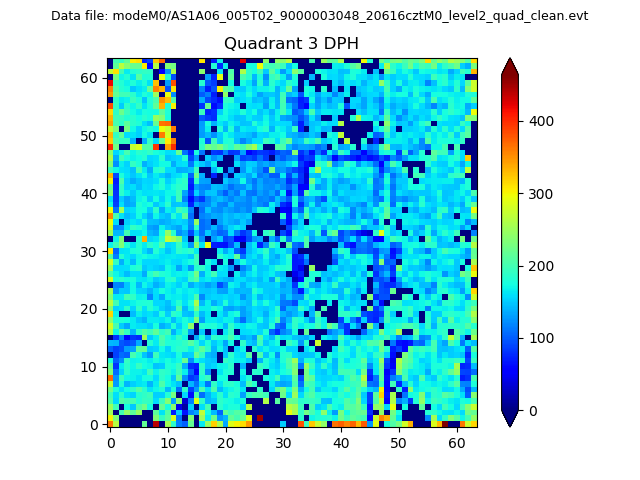 |
 |
Quadrant C |
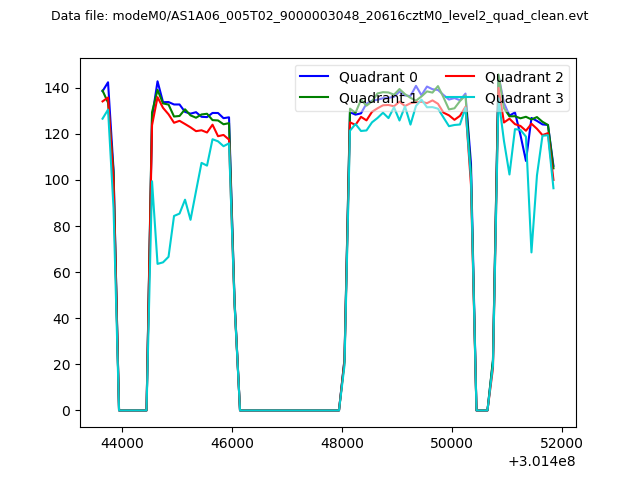
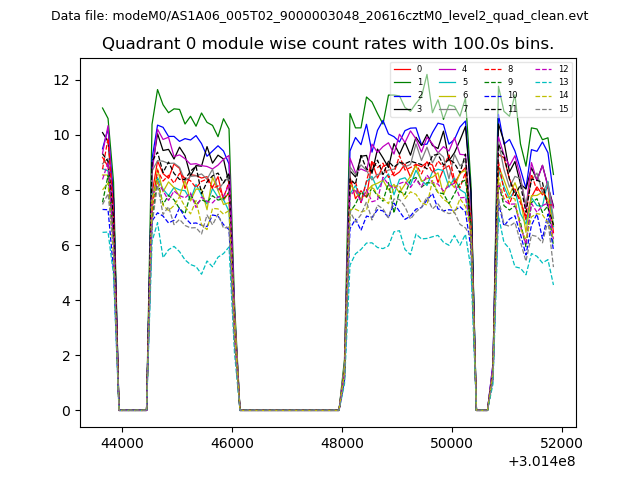
| Plot type | Count rate plots | Images |
|---|---|---|
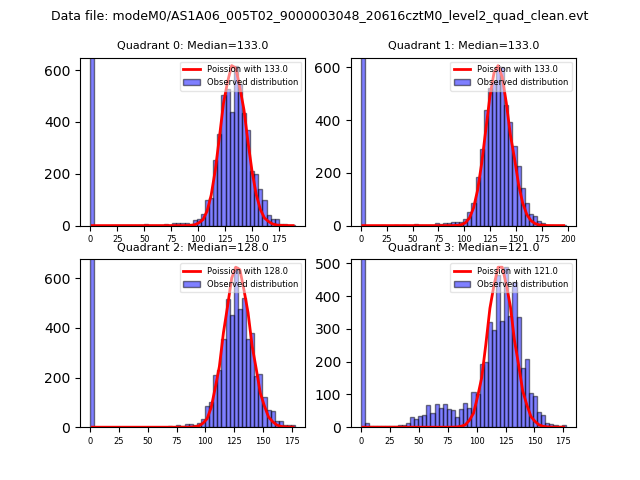
| Comparison with Poisson distribution Blue bars denote a histogram of data divided into 1 sec bins. Red curve is a Poisson curve with rate = median count rate of data. |
 |
 |
| Quadrant-wise count rates Data is divided into 100 sec bins |
 |
|
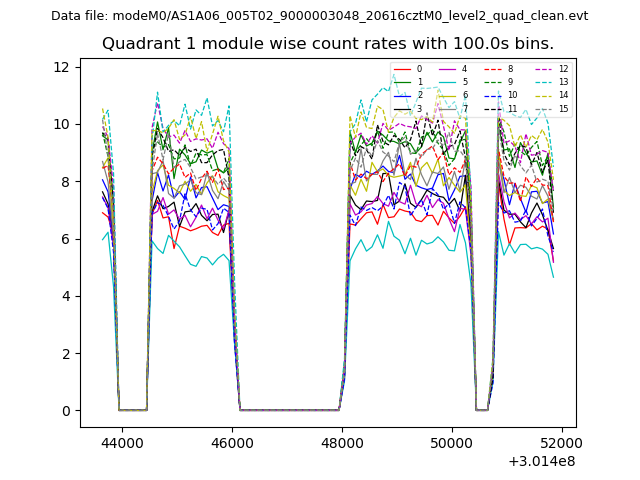
| Module-wise count rates for Quadrant A Data is divided into 100 sec bins |
 |
 |
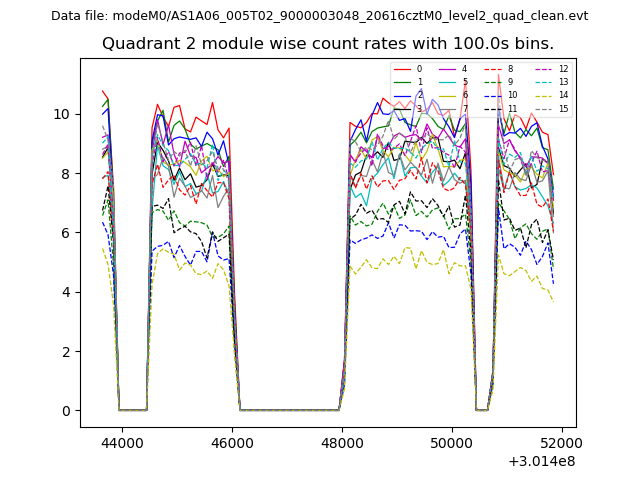
| Module-wise count rates for Quadrant B Data is divided into 100 sec bins |
 |
 |
| Module-wise count rates for Quadrant C Data is divided into 100 sec bins |
 |
 |
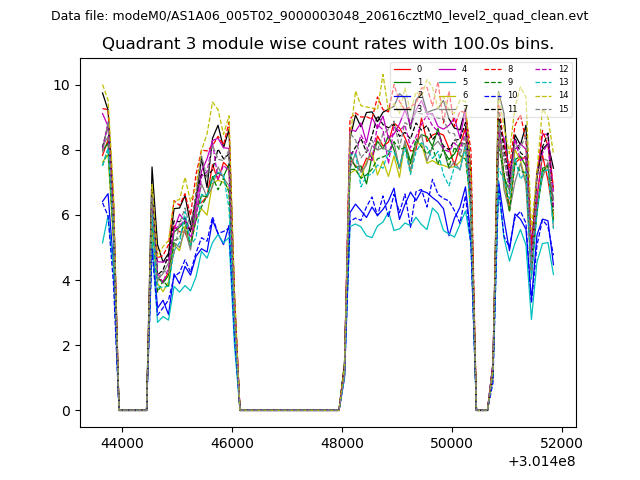
| Module-wise count rates for Quadrant D Data is divided into 100 sec bins |
 |
 |
| Parameter | Plot |
|---|---|
| CZT HV Monitor | 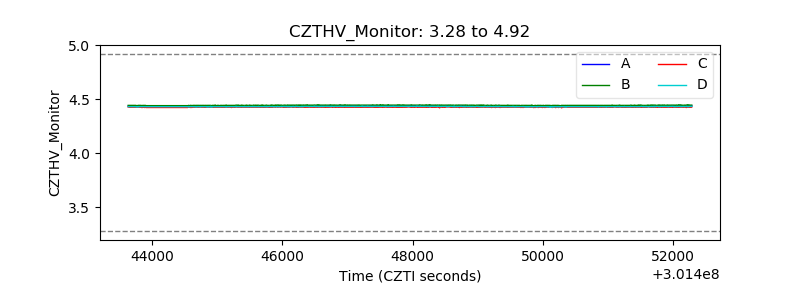 |
| D_VDD | 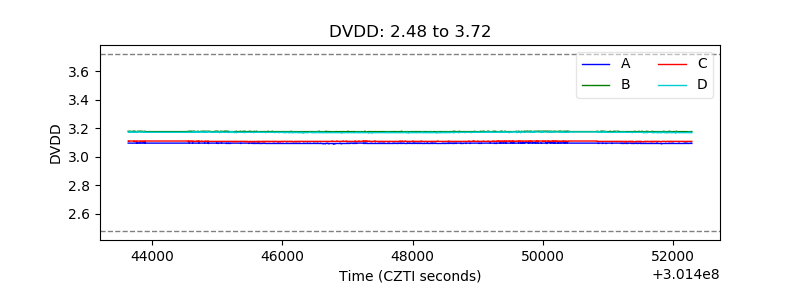 |
| Temperature 1 | 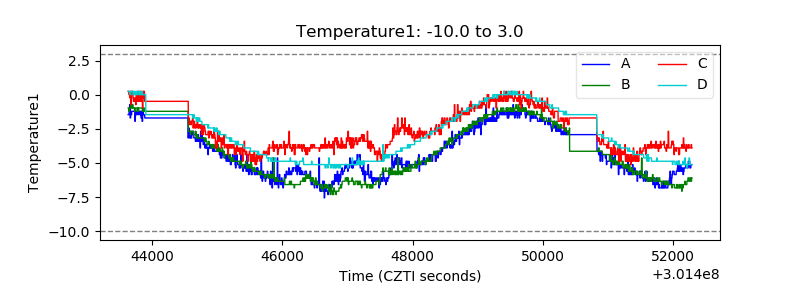 |
| Veto HV Monitor | 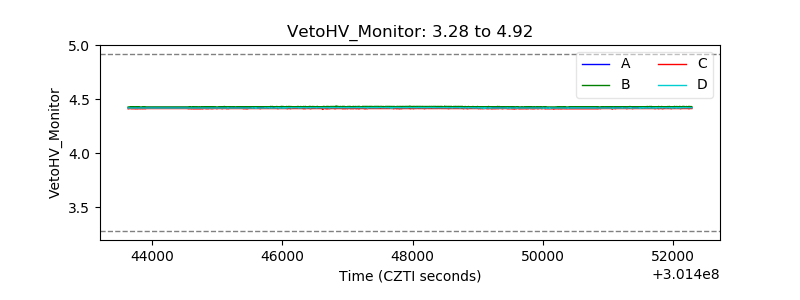 |
| Veto LLD | 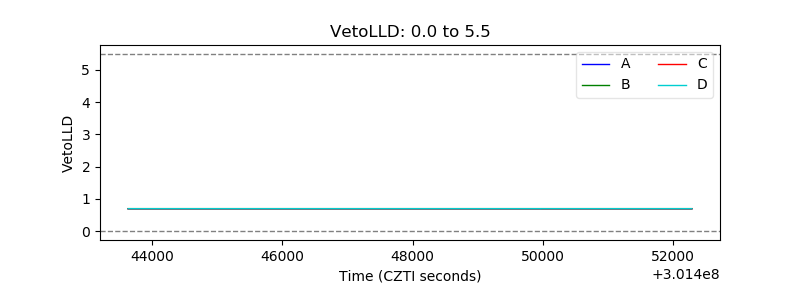 |
| Alpha Counter | 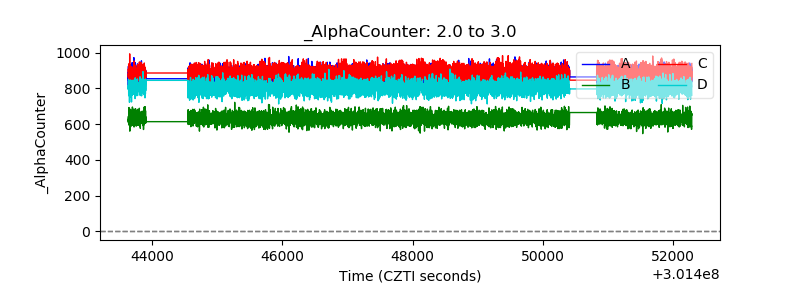 |
| _CPM_Rate | 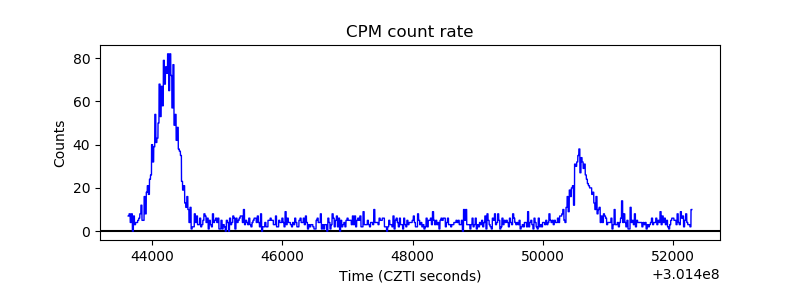 |
| CZT Counter |  |
| +2.5 Volts monitor |  |
| +5 Volts monitor |  |
| _ROLL_ROT | 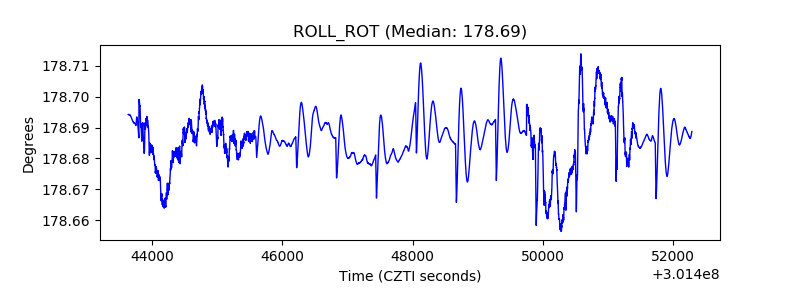 |
| _Roll_DEC | 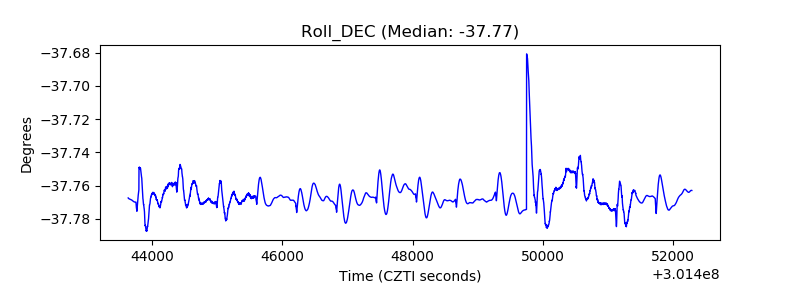 |
| _Roll_RA |  |
| Veto Counter | 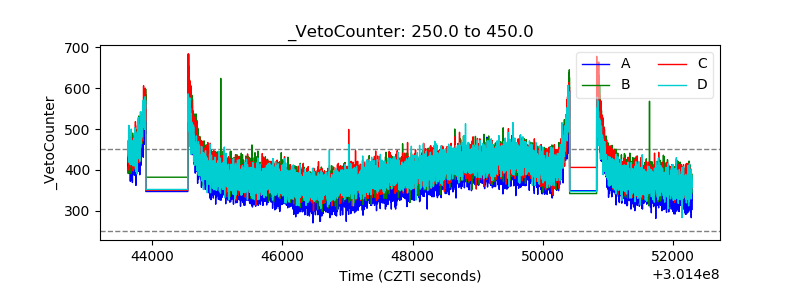 |