| Param | Original file | Final file |
|---|---|---|
| Filename | modeM0/AS1A06_005T02_9000003048_20617cztM0_level2.evt | modeM0/AS1A06_005T02_9000003048_20617cztM0_level2_quad_clean.evt |
| Size (bytes) | 645,353,280 | 110,816,640 |
| Size | 615.5 MB | 105.7 MB |
| Events in quadrant A | 4,108,005 | 717,071 |
| Events in quadrant B | 4,260,456 | 715,837 |
| Events in quadrant C | 4,791,975 | 687,589 |
| Events in quadrant D | 5,816,556 | 653,583 |
| Mode M9 | |||
|---|---|---|---|
| Quadrant | BADHDUFLAG | Total packets | Discarded packets |
| A | 0 | 8 | 0 |
| B | 0 | 8 | 0 |
| C | 0 | 8 | 0 |
| D | 0 | 8 | 0 |
| Mode M0 | |||
|---|---|---|---|
| Quadrant | BADHDUFLAG | Total packets | Discarded packets |
| A | 0 | 17730 | 2 |
| B | 0 | 18067 | 2 |
| C | 0 | 19542 | 2 |
| D | 0 | 22916 | 3 |
| Mode SS | |||
|---|---|---|---|
| Quadrant | BADHDUFLAG | Total packets | Discarded packets |
| A | 0 | 172 | 0 |
| B | 0 | 172 | 0 |
| C | 0 | 172 | 0 |
| D | 0 | 172 | 0 |
| Quadrant | Total seconds | Saturated seconds | Saturation percentage |
|---|---|---|---|
| A | 8375 | 77 | 0.919403% |
| B | 8376 | 94 | 1.122254% |
| C | 8376 | 139 | 1.659503% |
| D | 8375 | 510 | 6.089552% |
Noise dominated data is calculated using 1-second bins in cleaned event files. If a bin has >2000 counts, and if more than 50% of those come from <1% of pixels, then it is considered to be noise-dominated and hence unusable.
| Quadrant | # 1 sec bins | Bins with >0 counts | Bins with >2000 counts | High rate bins dominated by noise | Noise dominated (total time) | Noise dominated (detector-on time) | Marked lightcurve |
|---|---|---|---|---|---|---|---|
| A | 9220 | 8377 | 31 | 31 | 0.34% | 0.37% | 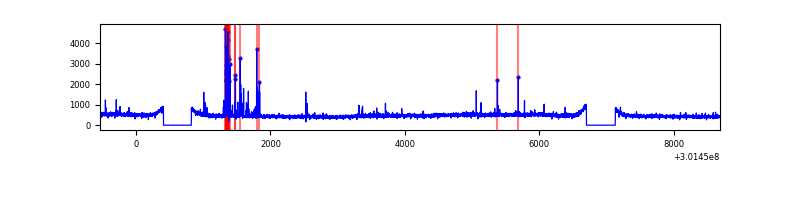 |
| B | 9221 | 8378 | 13 | 13 | 0.14% | 0.16% | 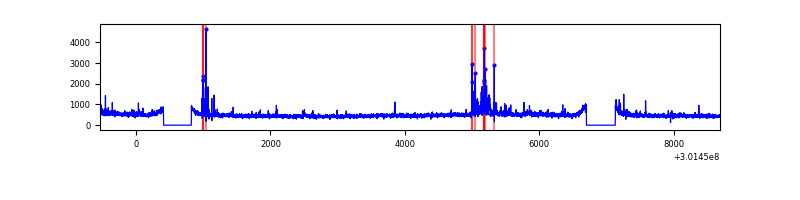 |
| C | 9221 | 8378 | 16 | 16 | 0.17% | 0.19% | 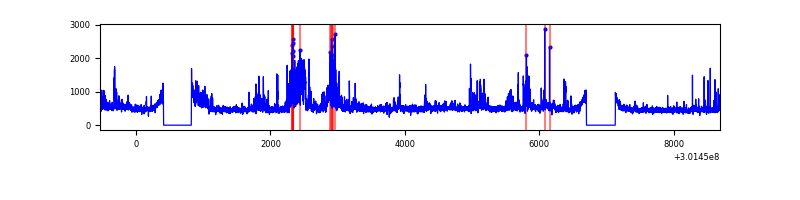 |
| D | 9220 | 8377 | 412 | 412 | 4.47% | 4.92% | 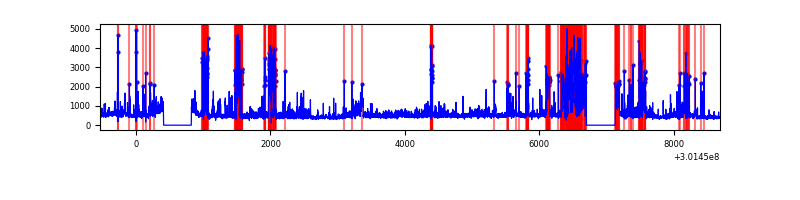 |
Top three noisy pixels from each quadrant. If the there are fewer than three noisy pixels in the level2.evt file, extra rows are filled as -1
| Pixel properties | Quadrant properties | ||||||
|---|---|---|---|---|---|---|---|
| Quadrant | DetID | PixID | Counts | Sigma | Mean | Median | Sigma |
| A | 5 | 16 | 194506 | 951.62 | 1009 | 987 | 203.4 |
| A | 12 | 16 | 17061 | 79.04 | 1009 | 987 | 203.4 |
| A | 8 | 205 | 15172 | 69.75 | 1009 | 987 | 203.4 |
| B | 7 | 220 | 109056 | 556.72 | 1006 | 982 | 194.1 |
| B | 0 | 197 | 60894 | 308.62 | 1006 | 982 | 194.1 |
| B | 0 | 190 | 33924 | 169.69 | 1006 | 982 | 194.1 |
| C | 3 | 233 | 433210 | 1920.67 | 959 | 966 | 225.0 |
| C | 3 | 9 | 276950 | 1226.33 | 959 | 966 | 225.0 |
| C | 14 | 238 | 149287 | 659.06 | 959 | 966 | 225.0 |
| D | 1 | 52 | 1171179 | 5066.34 | 949 | 919 | 231.0 |
| D | 5 | 222 | 523883 | 2264.04 | 949 | 919 | 231.0 |
| D | 13 | 153 | 218004 | 939.81 | 949 | 919 | 231.0 |
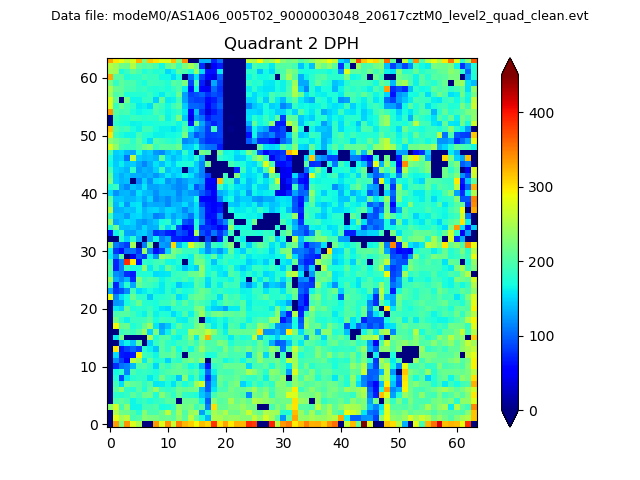
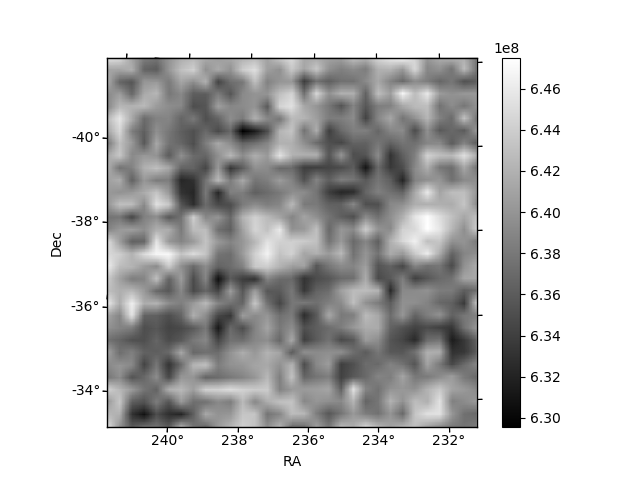
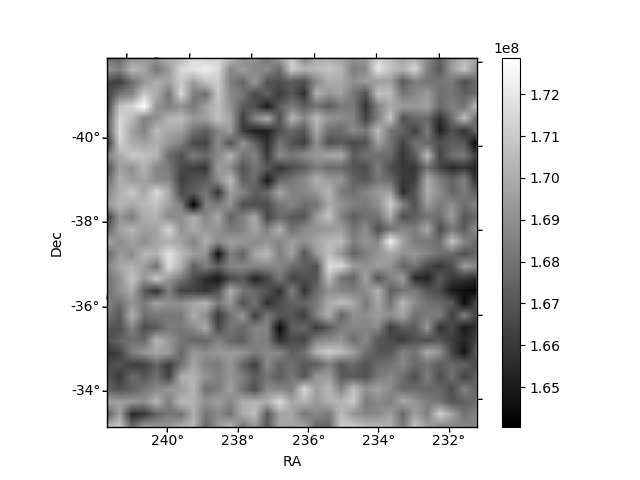
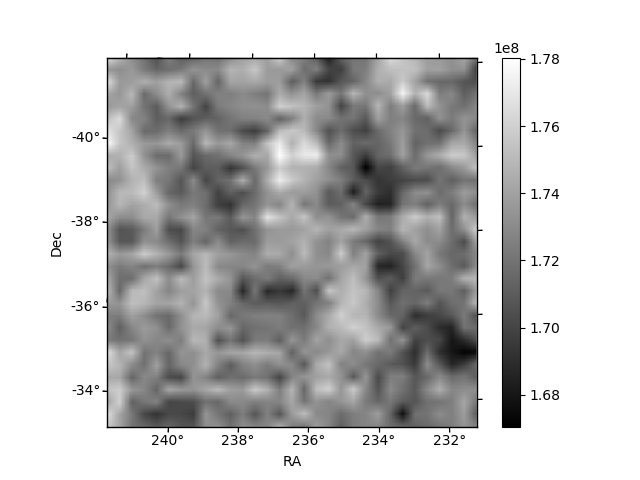
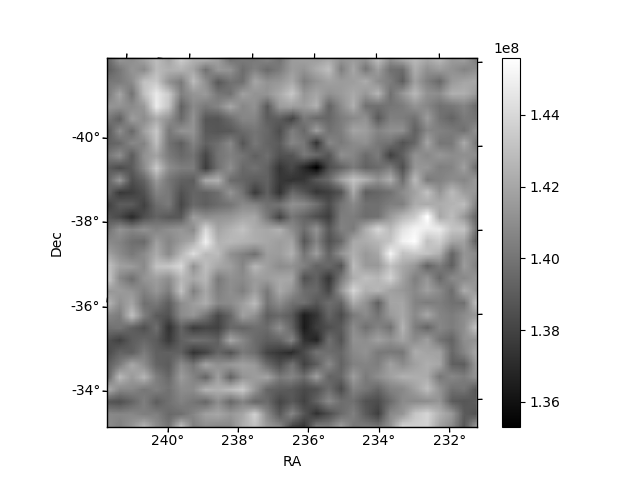
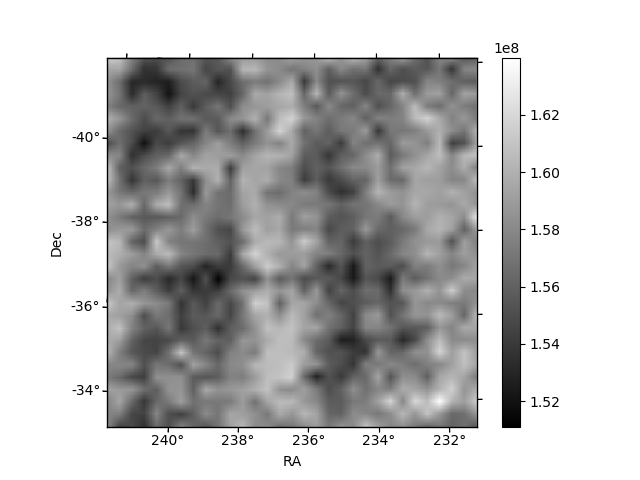
Histogram calculated using DETX and DETY for each event in the final _common_clean file
| Quadrant A | 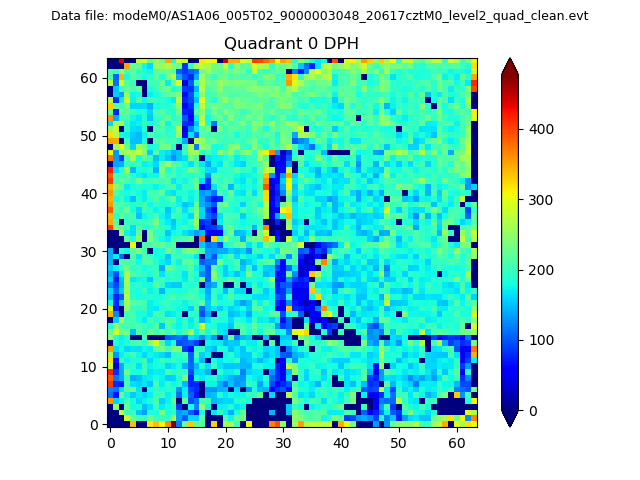 |
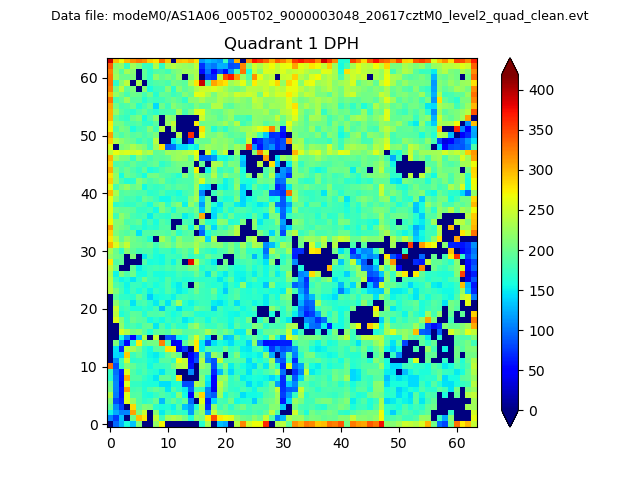 |
Quadrant B |
|---|---|---|---|
| Quadrant D | 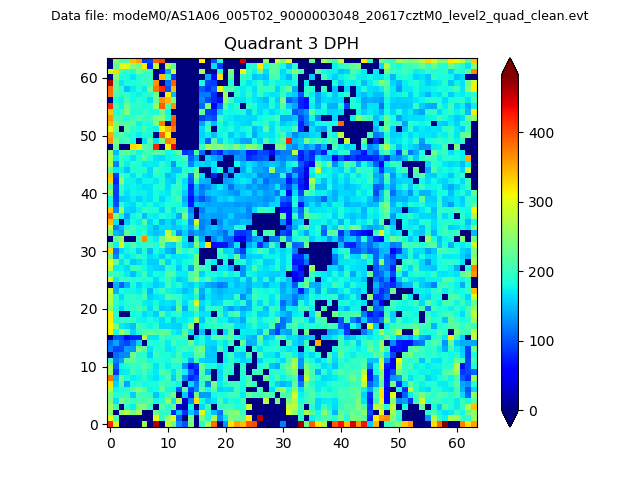 |
 |
Quadrant C |
| Plot type | Count rate plots | Images |
|---|---|---|
| Comparison with Poisson distribution Blue bars denote a histogram of data divided into 1 sec bins. Red curve is a Poisson curve with rate = median count rate of data. |
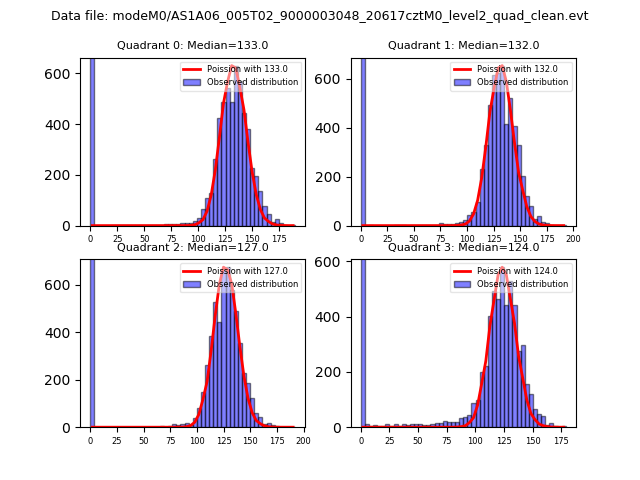 |
 |
| Quadrant-wise count rates Data is divided into 100 sec bins |
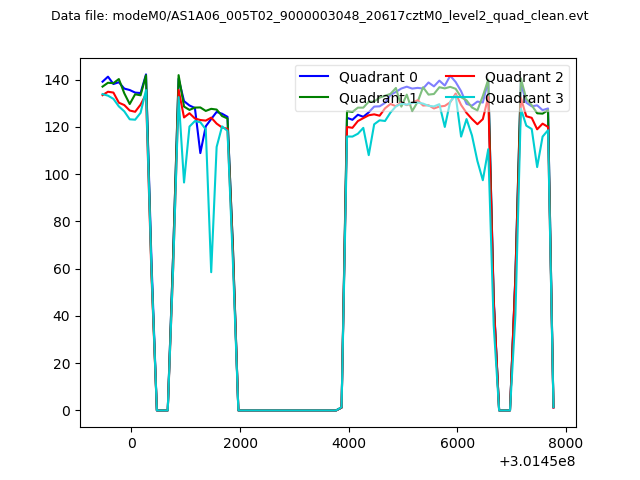 |
|
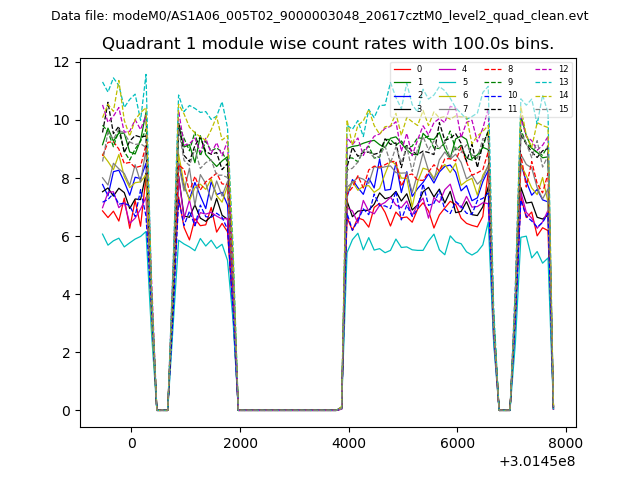
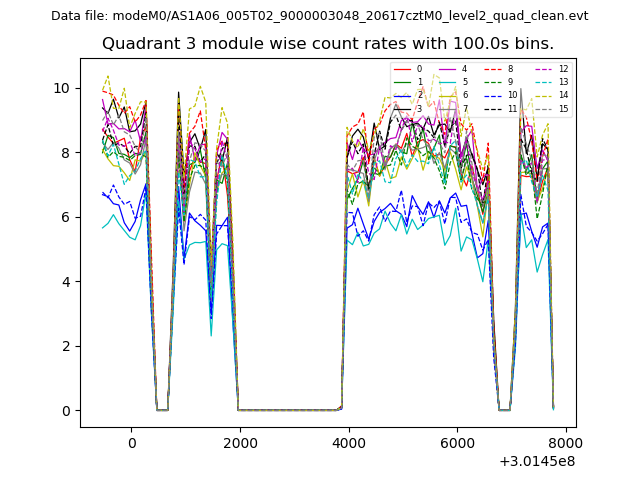
| Module-wise count rates for Quadrant A Data is divided into 100 sec bins |
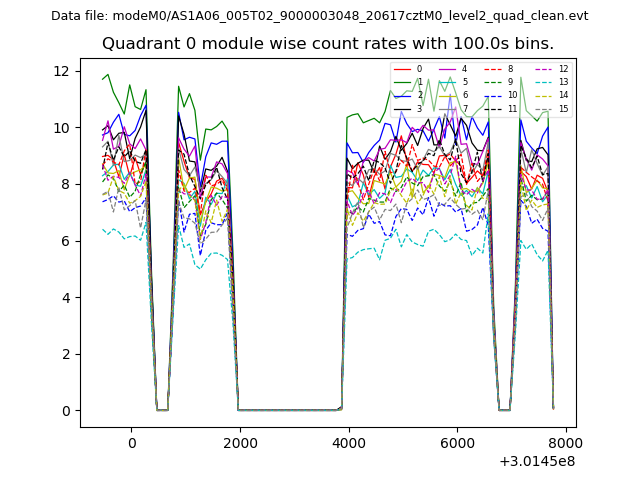 |
 |
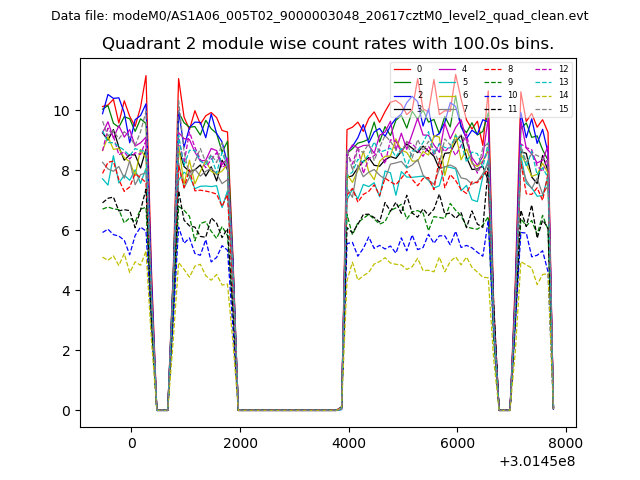
| Module-wise count rates for Quadrant B Data is divided into 100 sec bins |
 |
 |
| Module-wise count rates for Quadrant C Data is divided into 100 sec bins |
 |
 |
| Module-wise count rates for Quadrant D Data is divided into 100 sec bins |
 |
 |
| Parameter | Plot |
|---|---|
| CZT HV Monitor | 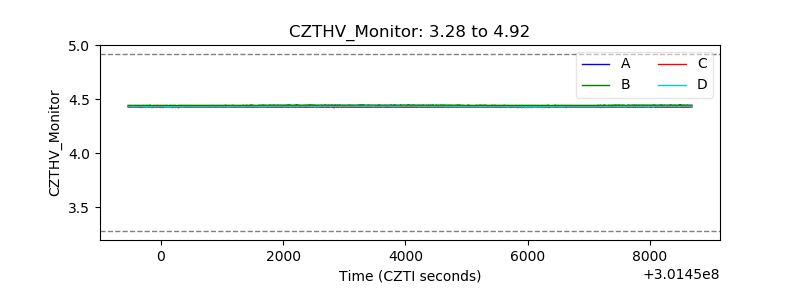 |
| D_VDD | 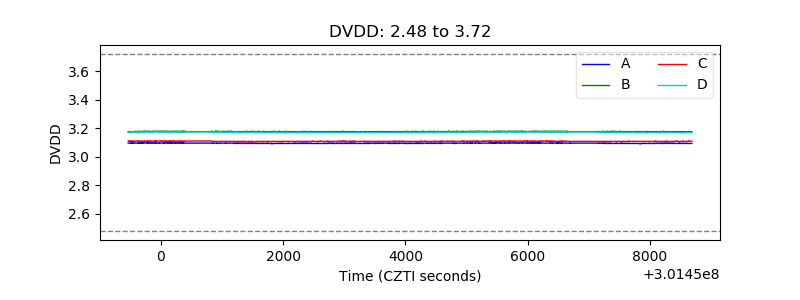 |
| Temperature 1 | 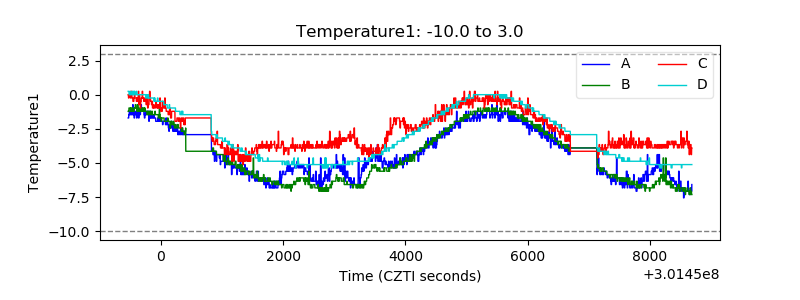 |
| Veto HV Monitor | 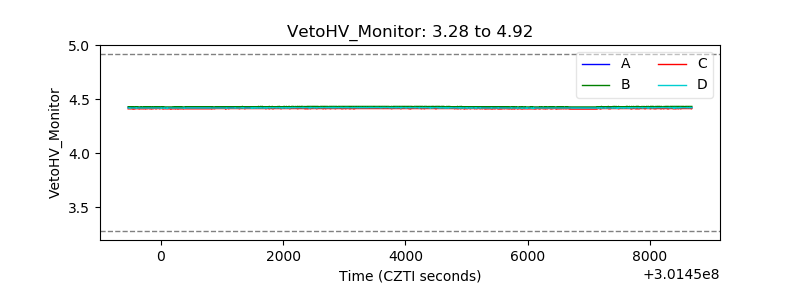 |
| Veto LLD | 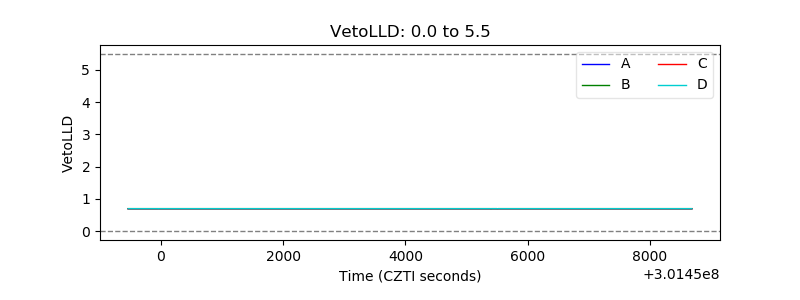 |
| Alpha Counter | 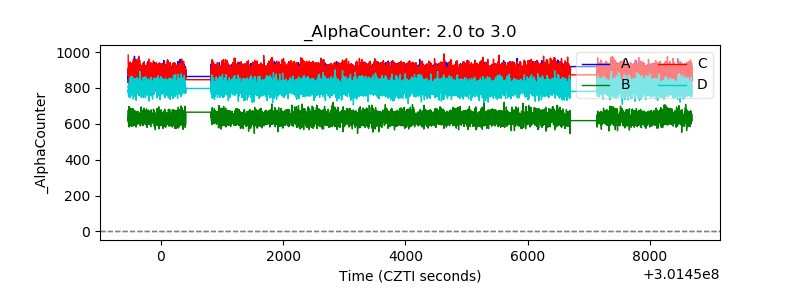 |
| _CPM_Rate | 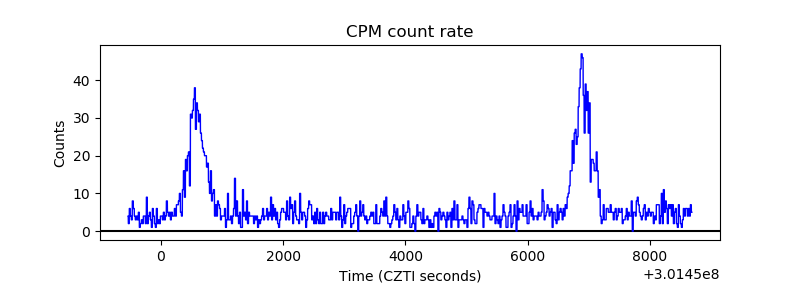 |
| CZT Counter | 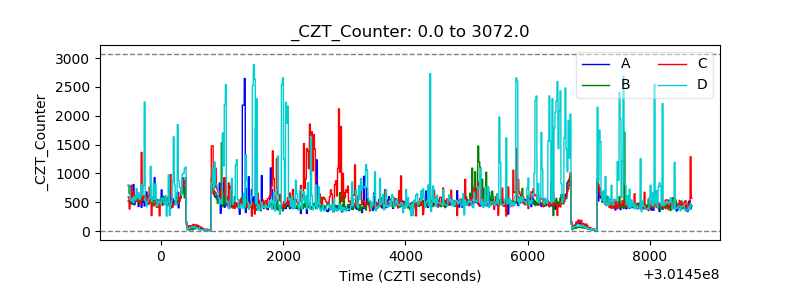 |
| +2.5 Volts monitor |  |
| +5 Volts monitor |  |
| _ROLL_ROT | 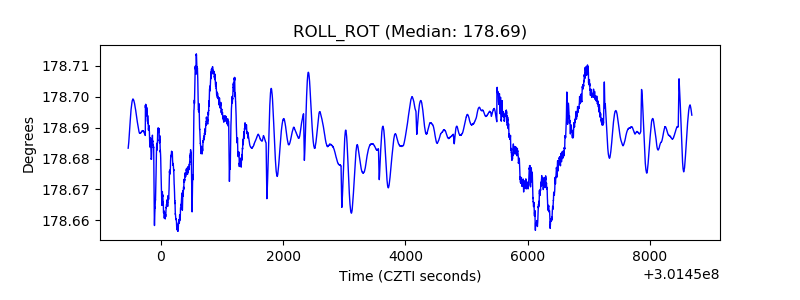 |
| _Roll_DEC | 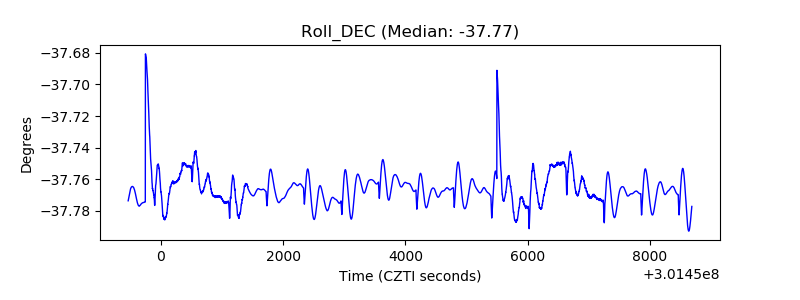 |
| _Roll_RA | 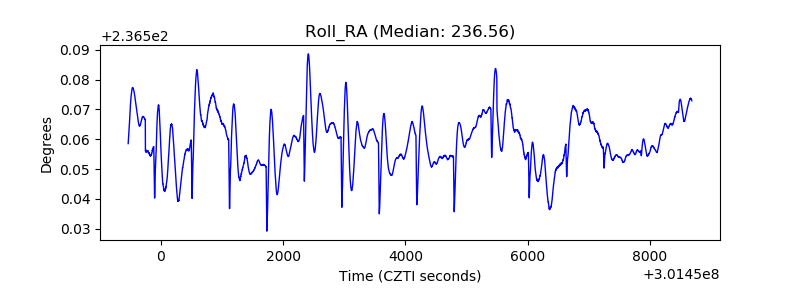 |
| Veto Counter | 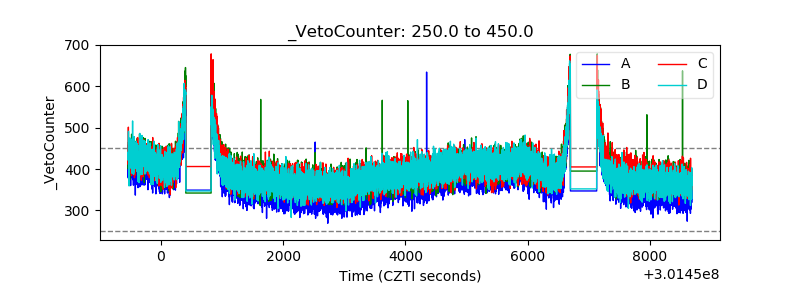 |