| Param | Original file | Final file |
|---|---|---|
| Filename | modeM0/AS1A06_005T02_9000003048_20620cztM0_level2.evt | modeM0/AS1A06_005T02_9000003048_20620cztM0_level2_quad_clean.evt |
| Size (bytes) | 2,268,046,080 | 367,104,960 |
| Size | 2.1 GB | 350.1 MB |
| Events in quadrant A | 14,580,845 | 2,346,065 |
| Events in quadrant B | 15,290,783 | 2,340,566 |
| Events in quadrant C | 15,416,006 | 2,258,688 |
| Events in quadrant D | 21,420,786 | 2,155,335 |
| Mode M9 | |||
|---|---|---|---|
| Quadrant | BADHDUFLAG | Total packets | Discarded packets |
| A | 0 | 30 | 0 |
| B | 0 | 30 | 0 |
| C | 0 | 30 | 0 |
| D | 0 | 30 | 0 |
| Mode M0 | |||
|---|---|---|---|
| Quadrant | BADHDUFLAG | Total packets | Discarded packets |
| A | 0 | 62497 | 5 |
| B | 0 | 64108 | 5 |
| C | 0 | 64350 | 5 |
| D | 0 | 83371 | 5 |
| Mode SS | |||
|---|---|---|---|
| Quadrant | BADHDUFLAG | Total packets | Discarded packets |
| A | 0 | 596 | 0 |
| B | 0 | 596 | 0 |
| C | 0 | 596 | 0 |
| D | 0 | 596 | 0 |
| Quadrant | Total seconds | Saturated seconds | Saturation percentage |
|---|---|---|---|
| A | 29363 | 182 | 0.619828% |
| B | 29363 | 427 | 1.454211% |
| C | 29363 | 342 | 1.164731% |
| D | 29363 | 1812 | 6.171032% |
Noise dominated data is calculated using 1-second bins in cleaned event files. If a bin has >2000 counts, and if more than 50% of those come from <1% of pixels, then it is considered to be noise-dominated and hence unusable.
| Quadrant | # 1 sec bins | Bins with >0 counts | Bins with >2000 counts | High rate bins dominated by noise | Noise dominated (total time) | Noise dominated (detector-on time) | Marked lightcurve |
|---|---|---|---|---|---|---|---|
| A | 32253 | 29368 | 39 | 39 | 0.12% | 0.13% | 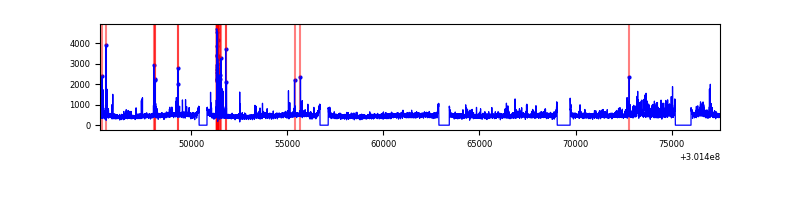 |
| B | 32253 | 29368 | 174 | 174 | 0.54% | 0.59% | 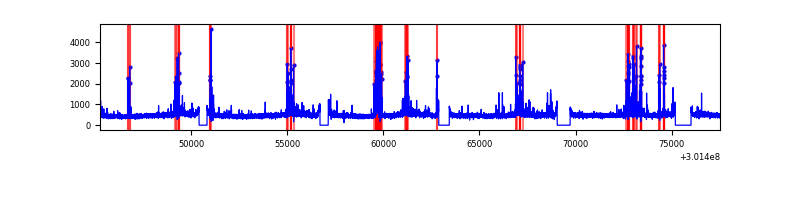 |
| C | 32253 | 29368 | 21 | 21 | 0.07% | 0.07% |  |
| D | 32253 | 29368 | 1535 | 1535 | 4.76% | 5.23% | 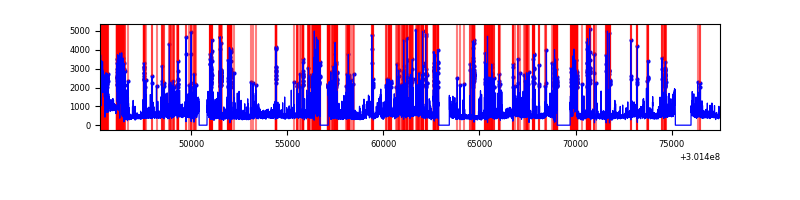 |
Top three noisy pixels from each quadrant. If the there are fewer than three noisy pixels in the level2.evt file, extra rows are filled as -1
| Pixel properties | Quadrant properties | ||||||
|---|---|---|---|---|---|---|---|
| Quadrant | DetID | PixID | Counts | Sigma | Mean | Median | Sigma |
| A | 12 | 16 | 624199 | 879.24 | 3514 | 3437 | 706.0 |
| A | 5 | 16 | 302196 | 423.16 | 3514 | 3437 | 706.0 |
| A | 12 | 194 | 126565 | 174.4 | 3514 | 3437 | 706.0 |
| B | 7 | 220 | 625139 | 943.23 | 3488 | 3403 | 659.2 |
| B | 3 | 64 | 378714 | 569.38 | 3488 | 3403 | 659.2 |
| B | 0 | 197 | 120976 | 178.37 | 3488 | 3403 | 659.2 |
| C | 3 | 9 | 710976 | 907.22 | 3351 | 3377 | 780.0 |
| C | 8 | 208 | 558861 | 712.19 | 3351 | 3377 | 780.0 |
| C | 14 | 238 | 523685 | 667.09 | 3351 | 3377 | 780.0 |
| D | 1 | 52 | 4299301 | 5352.06 | 3314 | 3216 | 802.7 |
| D | 5 | 222 | 2197796 | 2734.0 | 3314 | 3216 | 802.7 |
| D | 2 | 165 | 838259 | 1040.3 | 3314 | 3216 | 802.7 |
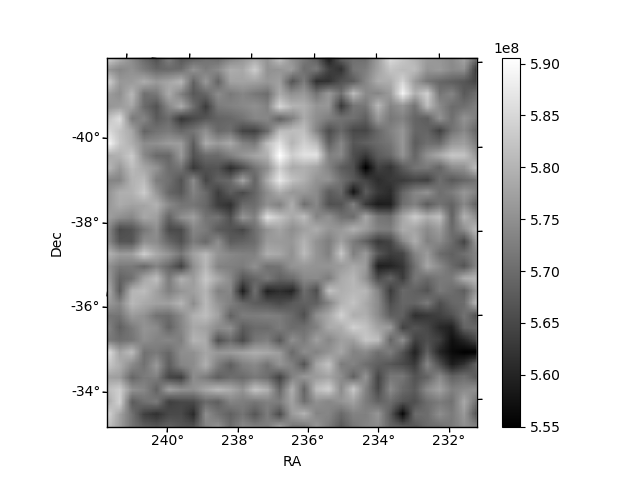
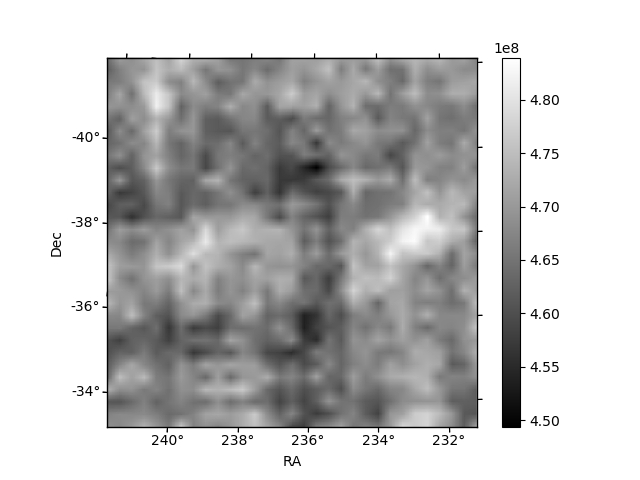
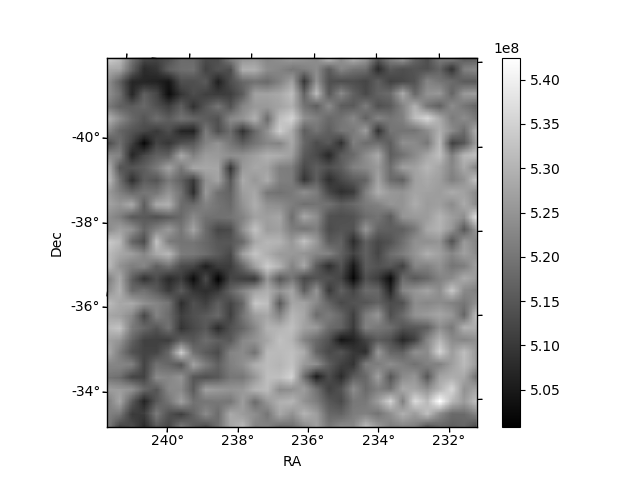
Histogram calculated using DETX and DETY for each event in the final _common_clean file
| Quadrant A |  |
 |
Quadrant B |
|---|---|---|---|
| Quadrant D |  |
 |
Quadrant C |
| Plot type | Count rate plots | Images |
|---|---|---|
| Comparison with Poisson distribution Blue bars denote a histogram of data divided into 1 sec bins. Red curve is a Poisson curve with rate = median count rate of data. |
 |
 |
| Quadrant-wise count rates Data is divided into 100 sec bins |
 |
|
| Module-wise count rates for Quadrant A Data is divided into 100 sec bins |
 |
 |
| Module-wise count rates for Quadrant B Data is divided into 100 sec bins |
 |
 |
| Module-wise count rates for Quadrant C Data is divided into 100 sec bins |
 |
 |
| Module-wise count rates for Quadrant D Data is divided into 100 sec bins |
 |
 |
| Parameter | Plot |
|---|---|
| CZT HV Monitor |  |
| D_VDD | 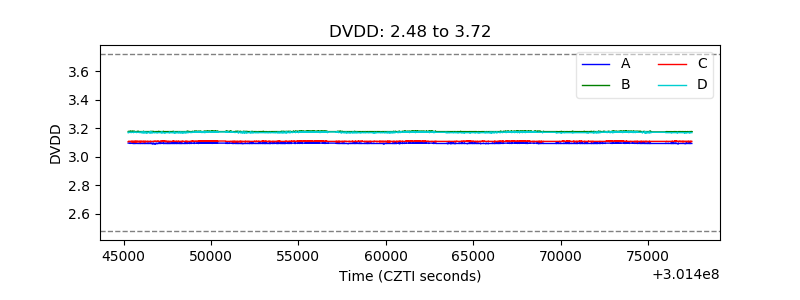 |
| Temperature 1 |  |
| Veto HV Monitor |  |
| Veto LLD |  |
| Alpha Counter |  |
| _CPM_Rate |  |
| CZT Counter |  |
| +2.5 Volts monitor |  |
| +5 Volts monitor |  |
| _ROLL_ROT |  |
| _Roll_DEC |  |
| _Roll_RA |  |
| Veto Counter |  |