| Param | Original file | Final file |
|---|---|---|
| Filename | modeM0/AS1A06_005T02_9000003048_20621cztM0_level2.evt | modeM0/AS1A06_005T02_9000003048_20621cztM0_level2_quad_clean.evt |
| Size (bytes) | 499,628,160 | 87,215,040 |
| Size | 476.5 MB | 83.2 MB |
| Events in quadrant A | 3,596,466 | 557,196 |
| Events in quadrant B | 3,552,878 | 555,408 |
| Events in quadrant C | 3,368,687 | 538,096 |
| Events in quadrant D | 4,156,512 | 521,141 |
| Mode M9 | |||
|---|---|---|---|
| Quadrant | BADHDUFLAG | Total packets | Discarded packets |
| A | 0 | 14 | 0 |
| B | 0 | 15 | 0 |
| C | 0 | 15 | 0 |
| D | 0 | 15 | 0 |
| Mode M0 | |||
|---|---|---|---|
| Quadrant | BADHDUFLAG | Total packets | Discarded packets |
| A | 0 | 14754 | 2 |
| B | 0 | 14606 | 2 |
| C | 0 | 14187 | 2 |
| D | 0 | 16670 | 2 |
| Mode SS | |||
|---|---|---|---|
| Quadrant | BADHDUFLAG | Total packets | Discarded packets |
| A | 0 | 136 | 0 |
| B | 0 | 136 | 0 |
| C | 0 | 136 | 0 |
| D | 0 | 136 | 0 |
| Quadrant | Total seconds | Saturated seconds | Saturation percentage |
|---|---|---|---|
| A | 6734 | 49 | 0.727651% |
| B | 6734 | 100 | 1.485001% |
| C | 6734 | 106 | 1.574102% |
| D | 6734 | 111 | 1.648352% |
Noise dominated data is calculated using 1-second bins in cleaned event files. If a bin has >2000 counts, and if more than 50% of those come from <1% of pixels, then it is considered to be noise-dominated and hence unusable.
| Quadrant | # 1 sec bins | Bins with >0 counts | Bins with >2000 counts | High rate bins dominated by noise | Noise dominated (total time) | Noise dominated (detector-on time) | Marked lightcurve |
|---|---|---|---|---|---|---|---|
| A | 7699 | 6735 | 2 | 2 | 0.03% | 0.03% | 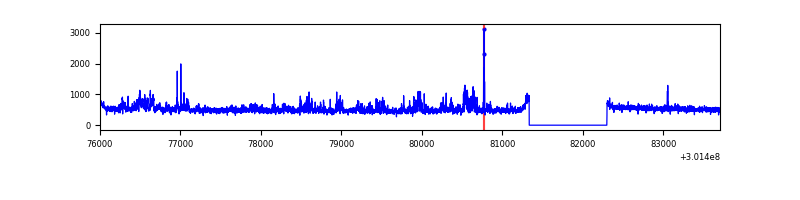 |
| B | 7699 | 6735 | 30 | 30 | 0.39% | 0.45% | 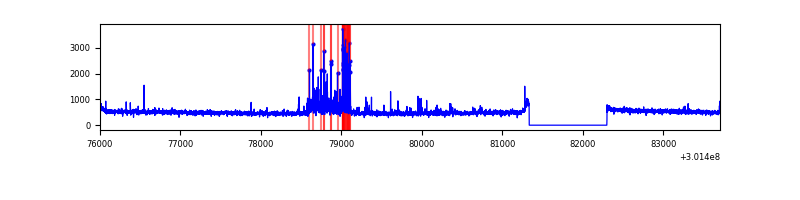 |
| C | 7699 | 6735 | 4 | 4 | 0.05% | 0.06% | 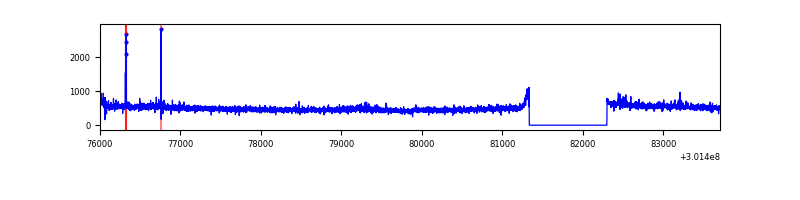 |
| D | 7699 | 6735 | 76 | 76 | 0.99% | 1.13% | 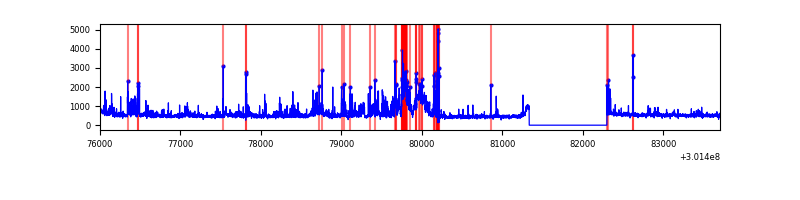 |
Top three noisy pixels from each quadrant. If the there are fewer than three noisy pixels in the level2.evt file, extra rows are filled as -1
| Pixel properties | Quadrant properties | ||||||
|---|---|---|---|---|---|---|---|
| Quadrant | DetID | PixID | Counts | Sigma | Mean | Median | Sigma |
| A | 12 | 16 | 262930 | 1554.61 | 840 | 824 | 168.6 |
| A | 12 | 194 | 54480 | 318.25 | 840 | 824 | 168.6 |
| A | 15 | 174 | 39717 | 230.68 | 840 | 824 | 168.6 |
| B | 7 | 220 | 181062 | 1131.94 | 833 | 814 | 159.2 |
| B | 12 | 111 | 18711 | 112.39 | 833 | 814 | 159.2 |
| B | 0 | 244 | 16664 | 99.54 | 833 | 814 | 159.2 |
| C | 14 | 238 | 126135 | 669.22 | 804 | 809 | 187.3 |
| C | 8 | 208 | 85656 | 453.07 | 804 | 809 | 187.3 |
| C | 9 | 54 | 15052 | 76.06 | 804 | 809 | 187.3 |
| D | 2 | 165 | 458964 | 2327.95 | 812 | 788 | 196.8 |
| D | 5 | 222 | 328868 | 1666.94 | 812 | 788 | 196.8 |
| D | 1 | 52 | 173401 | 877.03 | 812 | 788 | 196.8 |
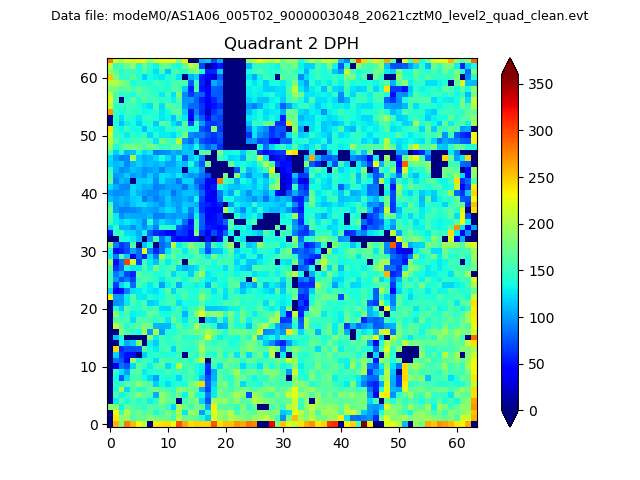
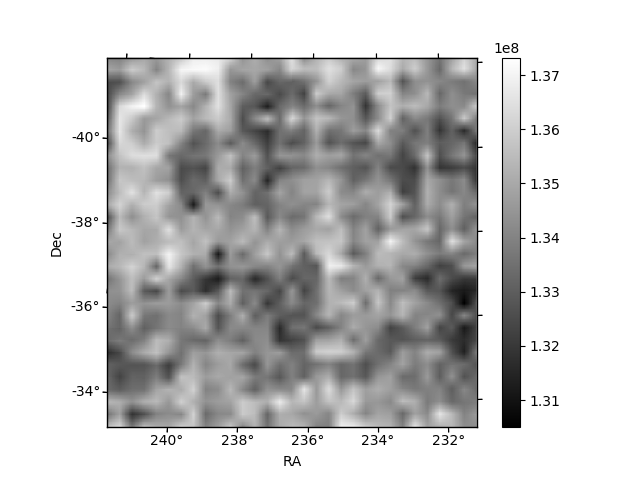
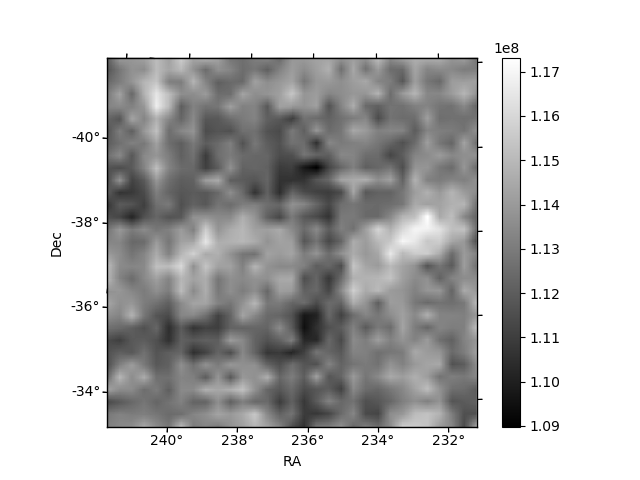
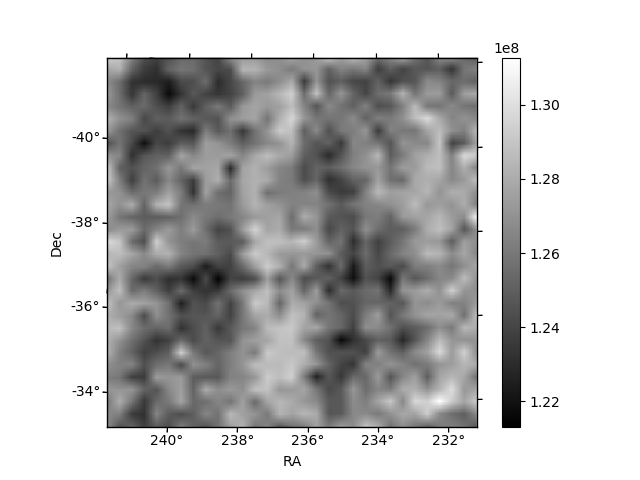
Histogram calculated using DETX and DETY for each event in the final _common_clean file
| Quadrant A | 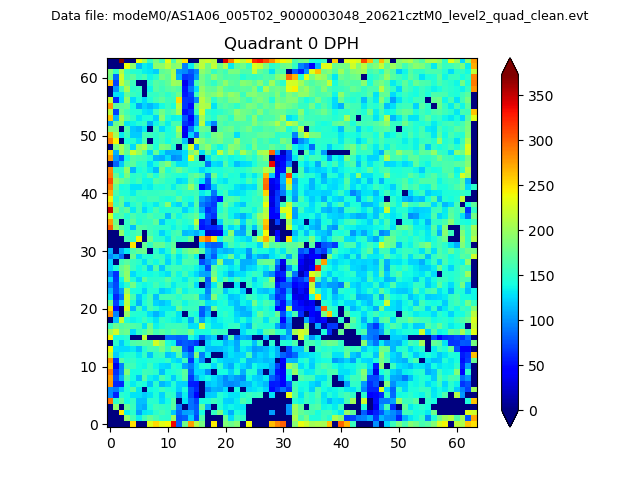 |
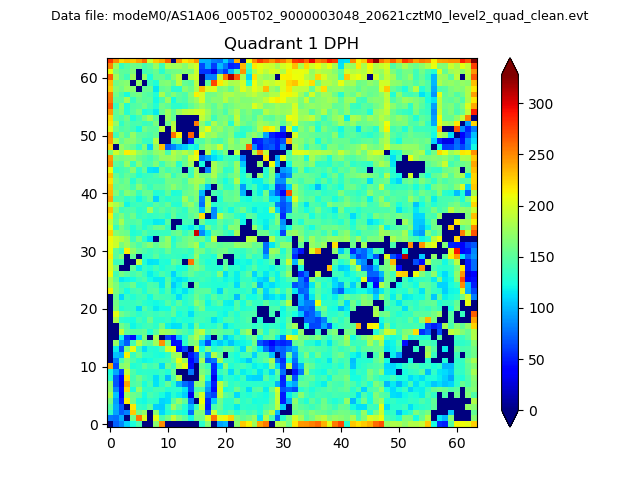 |
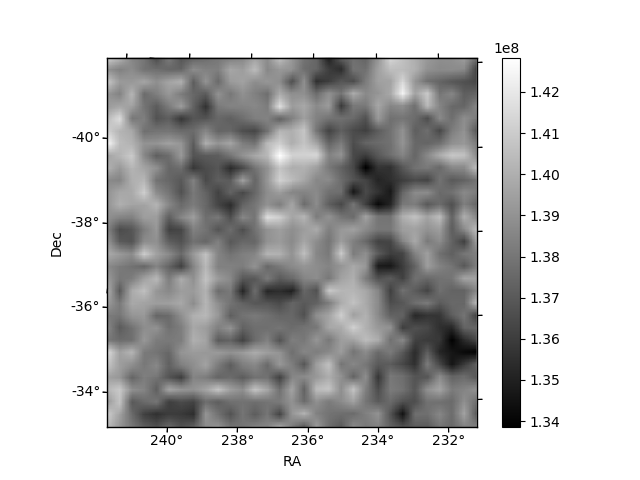
Quadrant B |
|---|---|---|---|
| Quadrant D | 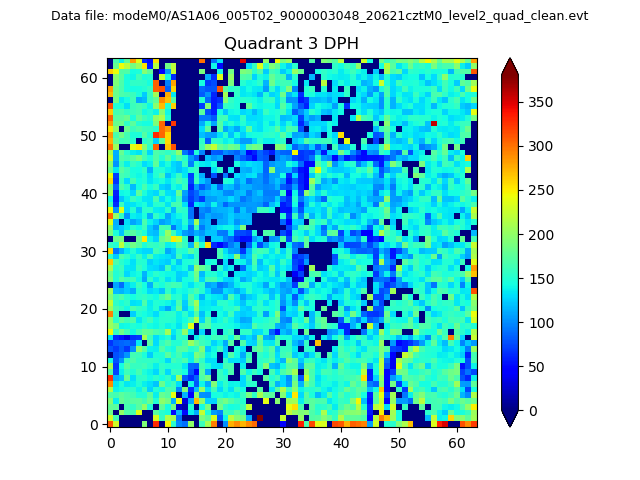 |
 |
Quadrant C |
| Plot type | Count rate plots | Images |
|---|---|---|
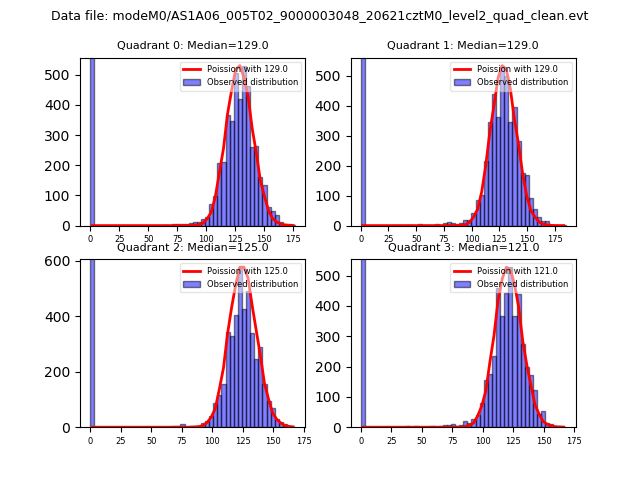
| Comparison with Poisson distribution Blue bars denote a histogram of data divided into 1 sec bins. Red curve is a Poisson curve with rate = median count rate of data. |
 |
 |
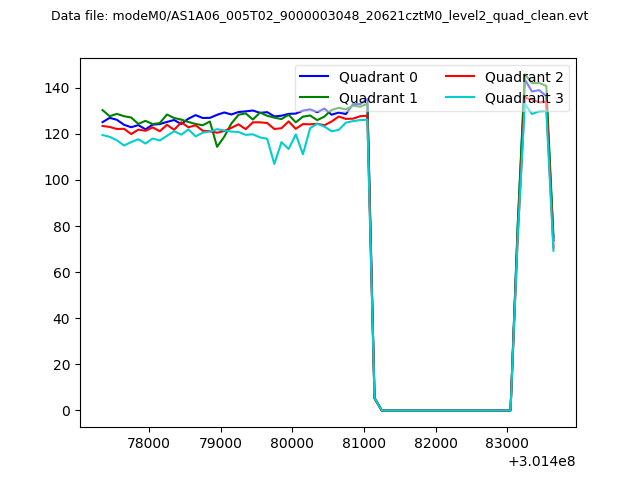
| Quadrant-wise count rates Data is divided into 100 sec bins |
 |
|
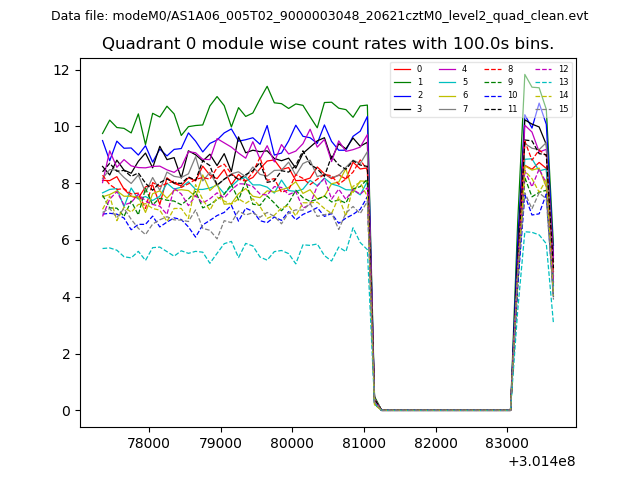
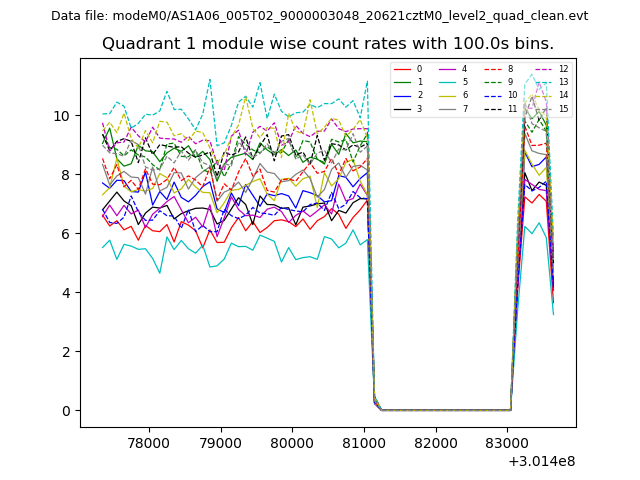
| Module-wise count rates for Quadrant A Data is divided into 100 sec bins |
 |
 |
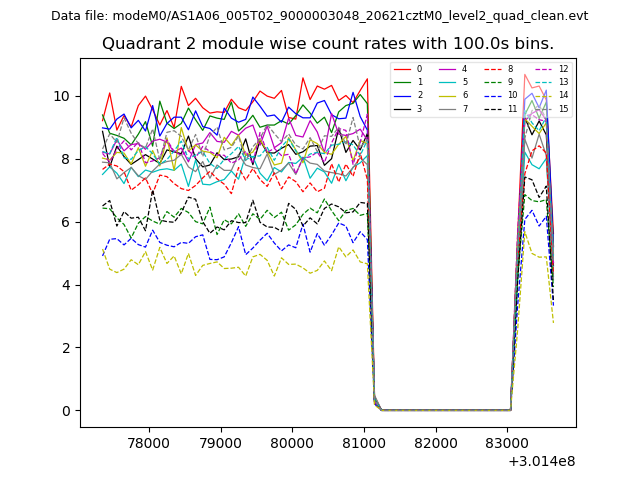
| Module-wise count rates for Quadrant B Data is divided into 100 sec bins |
 |
 |
| Module-wise count rates for Quadrant C Data is divided into 100 sec bins |
 |
 |
| Module-wise count rates for Quadrant D Data is divided into 100 sec bins |
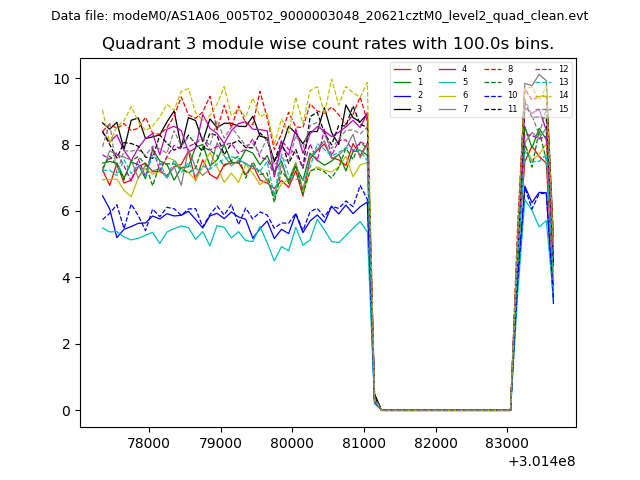 |
 |
| Parameter | Plot |
|---|---|
| CZT HV Monitor | 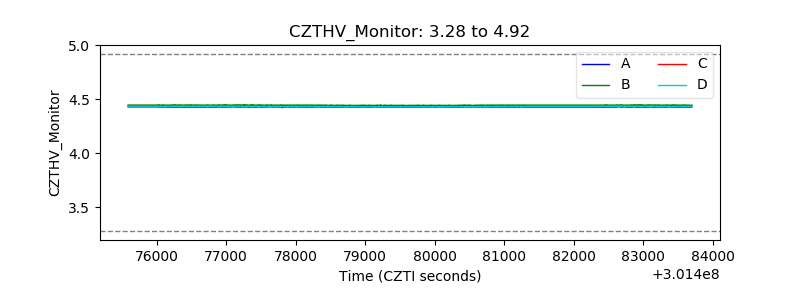 |
| D_VDD | 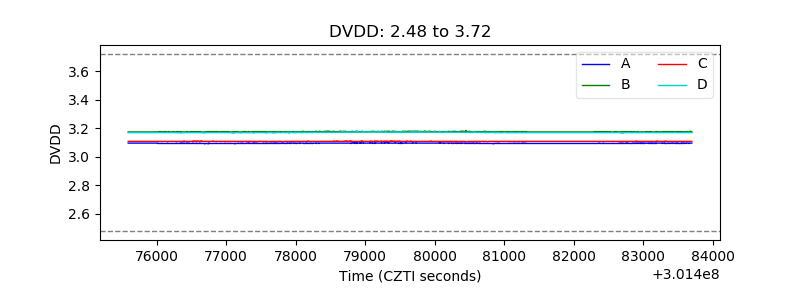 |
| Temperature 1 | 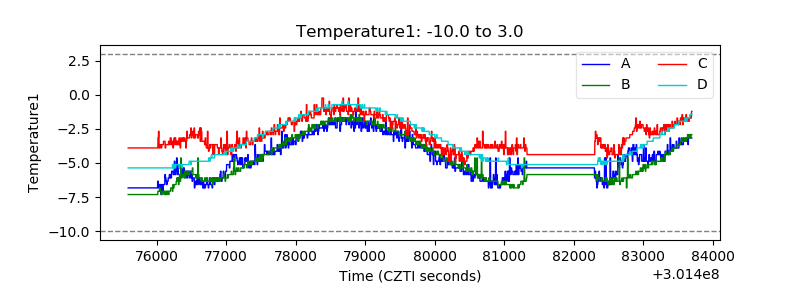 |
| Veto HV Monitor | 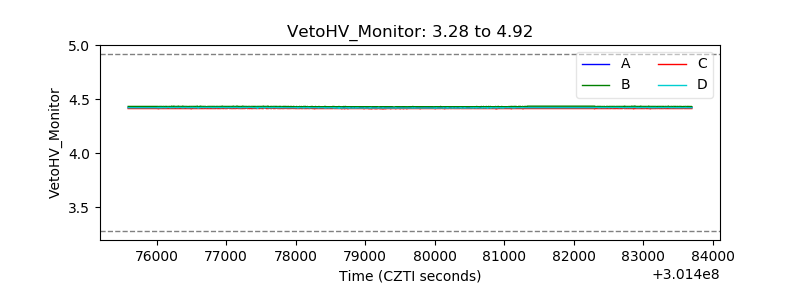 |
| Veto LLD | 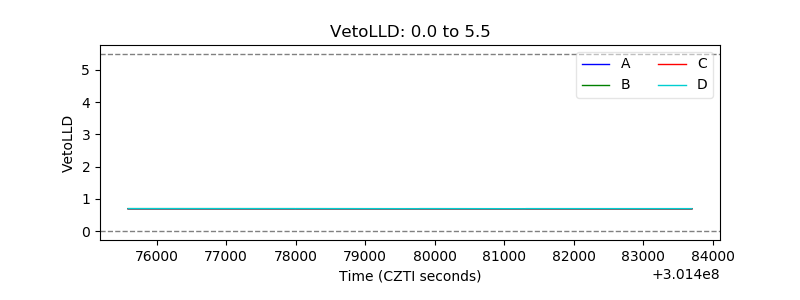 |
| Alpha Counter | 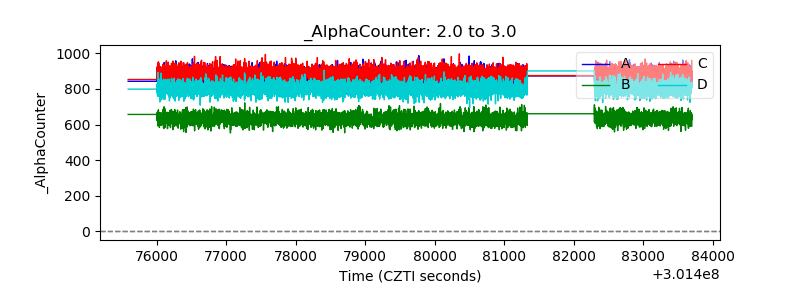 |
| _CPM_Rate | 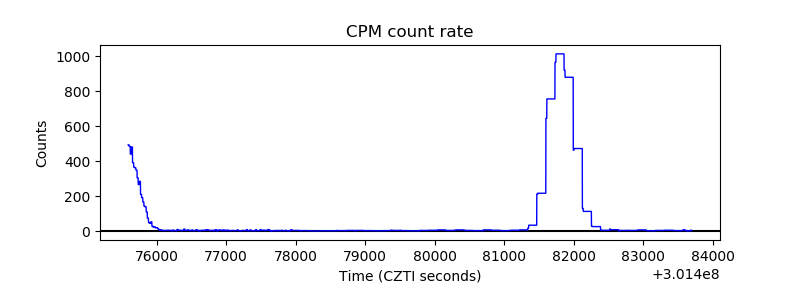 |
| CZT Counter | 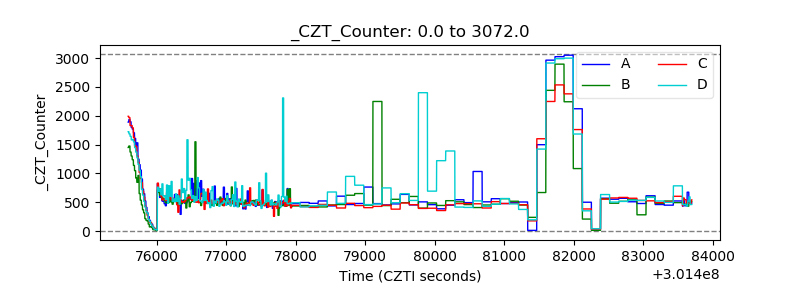 |
| +2.5 Volts monitor | 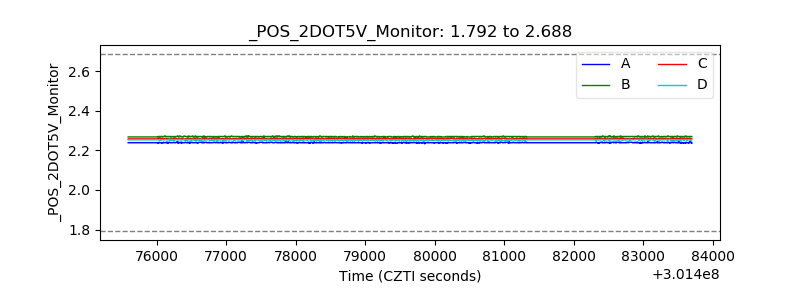 |
| +5 Volts monitor |  |
| _ROLL_ROT | 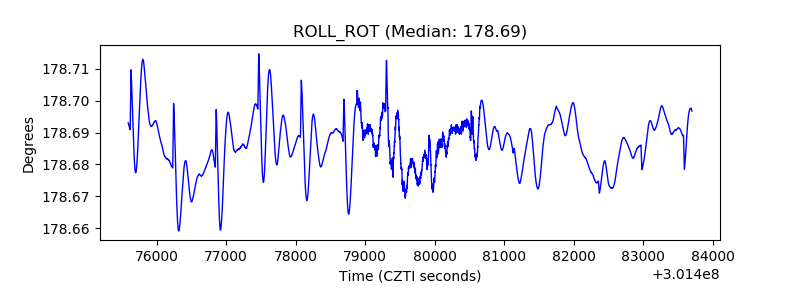 |
| _Roll_DEC | 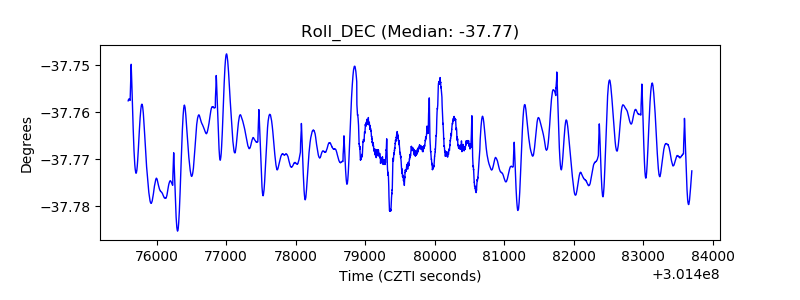 |
| _Roll_RA | 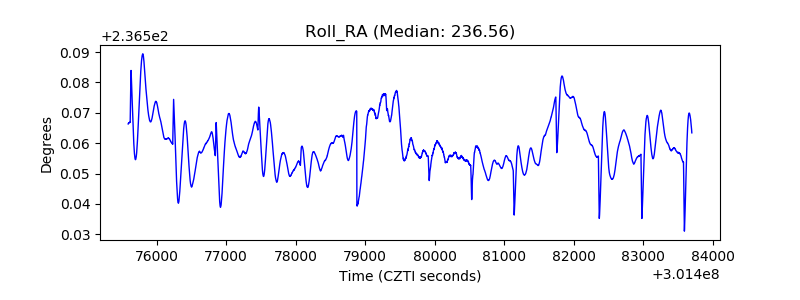 |
| Veto Counter | 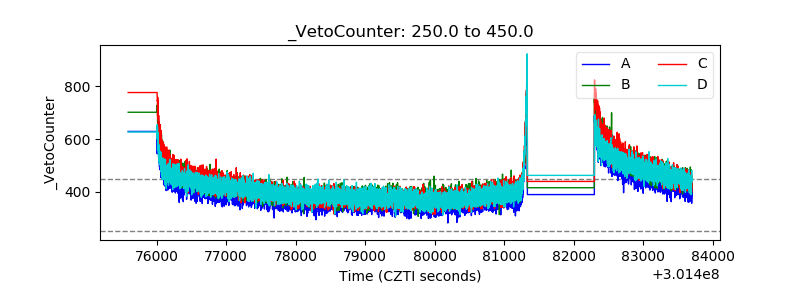 |