| Param | Original file | Final file |
|---|---|---|
| Filename | modeM0/AS1A06_005T02_9000003048_20627cztM0_level2.evt | modeM0/AS1A06_005T02_9000003048_20627cztM0_level2_quad_clean.evt |
| Size (bytes) | 569,784,960 | 91,560,960 |
| Size | 543.4 MB | 87.3 MB |
| Events in quadrant A | 3,074,243 | 634,341 |
| Events in quadrant B | 3,291,923 | 624,382 |
| Events in quadrant C | 3,162,654 | 587,095 |
| Events in quadrant D | 7,314,088 | 500,630 |
| Mode M9 | |||
|---|---|---|---|
| Quadrant | BADHDUFLAG | Total packets | Discarded packets |
| A | 0 | 14 | 0 |
| B | 0 | 14 | 0 |
| C | 0 | 14 | 0 |
| D | 0 | 14 | 0 |
| Mode M0 | |||
|---|---|---|---|
| Quadrant | BADHDUFLAG | Total packets | Discarded packets |
| A | 0 | 12919 | 1 |
| B | 0 | 13614 | 1 |
| C | 0 | 13333 | 1 |
| D | 0 | 25892 | 5 |
| Mode SS | |||
|---|---|---|---|
| Quadrant | BADHDUFLAG | Total packets | Discarded packets |
| A | 0 | 124 | 0 |
| B | 0 | 124 | 0 |
| C | 0 | 124 | 0 |
| D | 0 | 124 | 0 |
| Quadrant | Total seconds | Saturated seconds | Saturation percentage |
|---|---|---|---|
| A | 6103 | 56 | 0.917582% |
| B | 6104 | 108 | 1.769332% |
| C | 6104 | 88 | 1.441678% |
| D | 6103 | 1305 | 21.382926% |
Noise dominated data is calculated using 1-second bins in cleaned event files. If a bin has >2000 counts, and if more than 50% of those come from <1% of pixels, then it is considered to be noise-dominated and hence unusable.
| Quadrant | # 1 sec bins | Bins with >0 counts | Bins with >2000 counts | High rate bins dominated by noise | Noise dominated (total time) | Noise dominated (detector-on time) | Marked lightcurve |
|---|---|---|---|---|---|---|---|
| A | 7413 | 6105 | 0 | 0 | 0.00% | 0.00% | 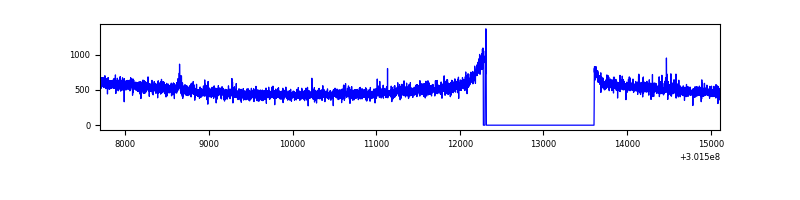 |
| B | 7414 | 6106 | 34 | 34 | 0.46% | 0.56% | 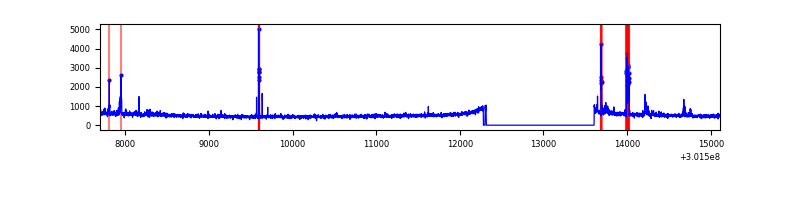 |
| C | 7414 | 6106 | 0 | 0 | 0.00% | 0.00% | 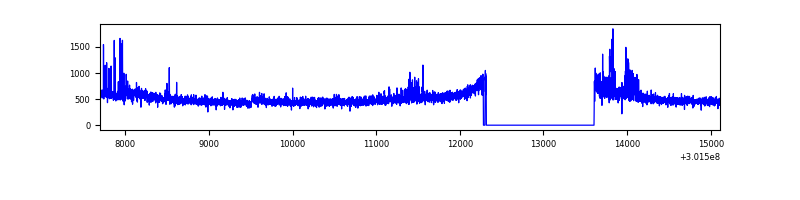 |
| D | 7413 | 6105 | 1141 | 1141 | 15.39% | 18.69% | 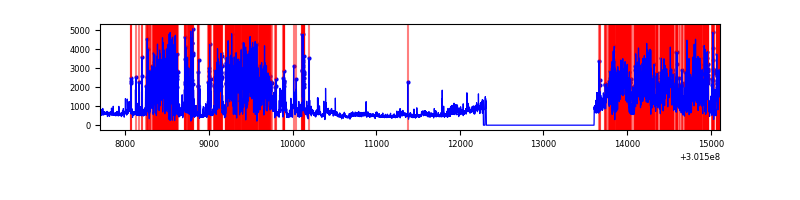 |
Top three noisy pixels from each quadrant. If the there are fewer than three noisy pixels in the level2.evt file, extra rows are filled as -1
| Pixel properties | Quadrant properties | ||||||
|---|---|---|---|---|---|---|---|
| Quadrant | DetID | PixID | Counts | Sigma | Mean | Median | Sigma |
| A | 12 | 16 | 9846 | 57.11 | 793 | 780 | 158.7 |
| A | 5 | 16 | 8429 | 48.19 | 793 | 780 | 158.7 |
| A | 12 | 194 | 7676 | 43.44 | 793 | 780 | 158.7 |
| B | 0 | 244 | 66026 | 438.53 | 778 | 761 | 148.8 |
| B | 0 | 190 | 46197 | 305.3 | 778 | 761 | 148.8 |
| B | 5 | 172 | 46009 | 304.03 | 778 | 761 | 148.8 |
| C | 8 | 208 | 173852 | 1024.83 | 733 | 739 | 168.9 |
| C | 14 | 238 | 116735 | 686.69 | 733 | 739 | 168.9 |
| C | 9 | 54 | 6538 | 34.33 | 733 | 739 | 168.9 |
| D | 1 | 52 | 2225745 | 13171.0 | 699 | 679 | 168.9 |
| D | 5 | 222 | 1730241 | 10237.93 | 699 | 679 | 168.9 |
| D | 7 | 238 | 245301 | 1448.01 | 699 | 679 | 168.9 |
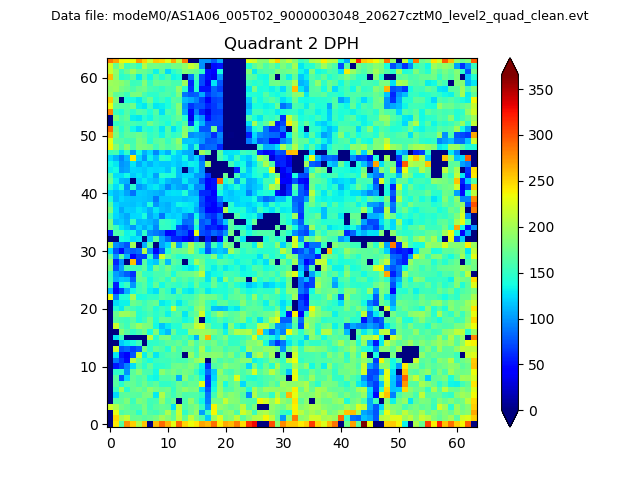
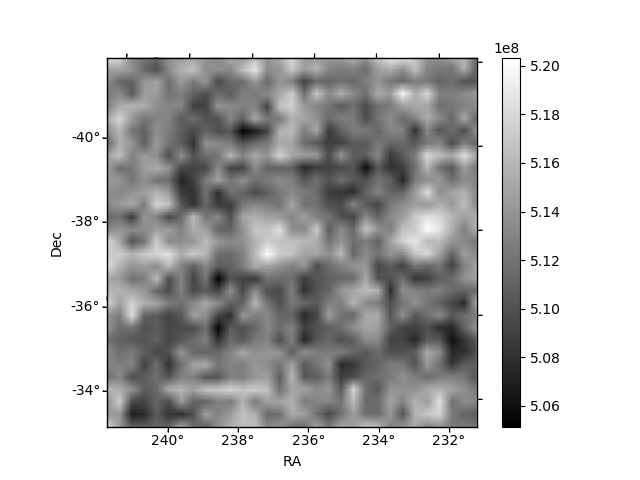
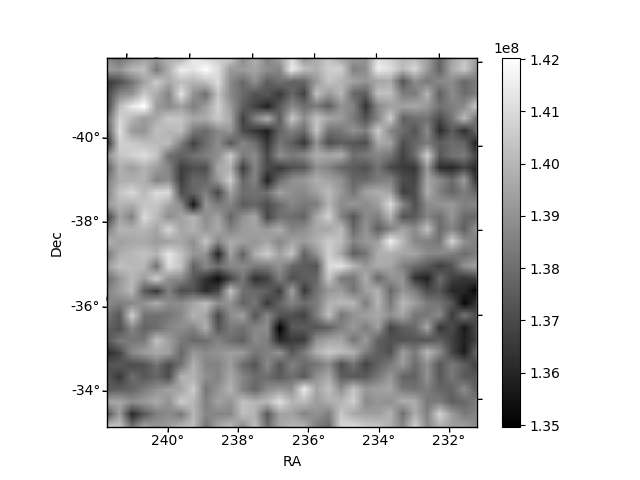
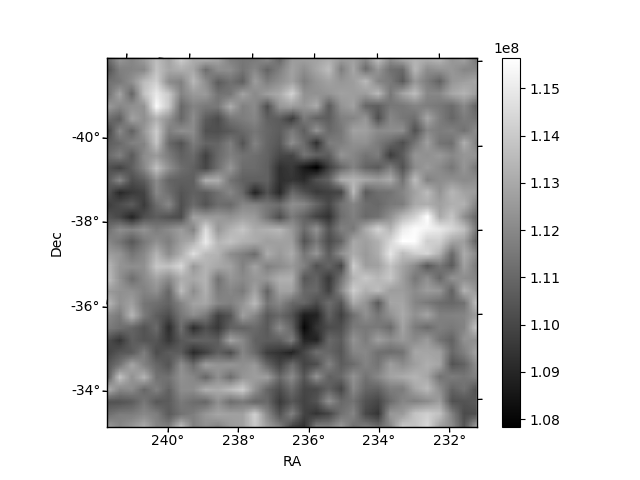
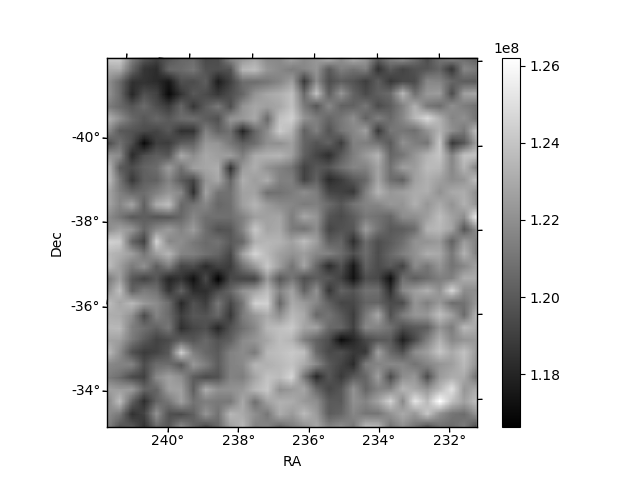
Histogram calculated using DETX and DETY for each event in the final _common_clean file
| Quadrant A | 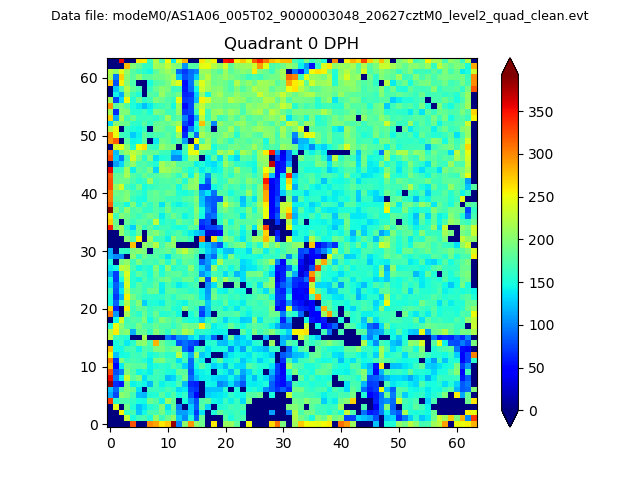 |
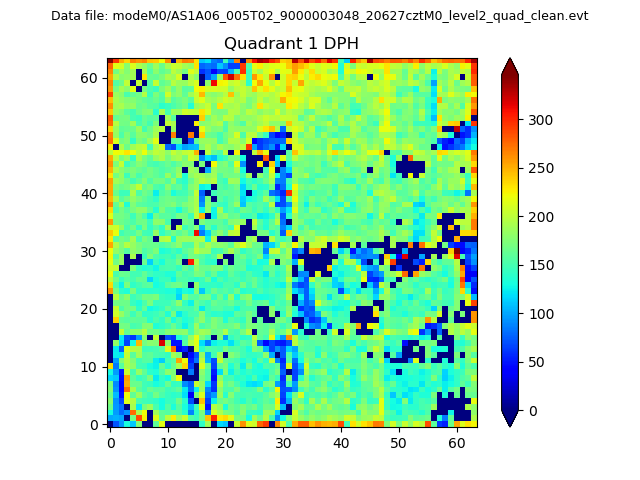 |
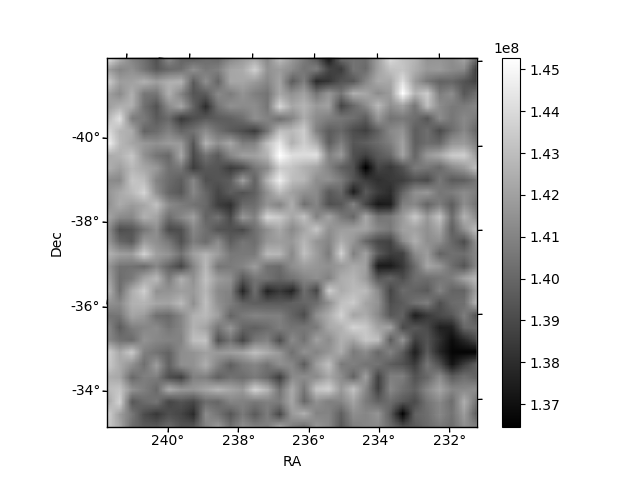
Quadrant B |
|---|---|---|---|
| Quadrant D | 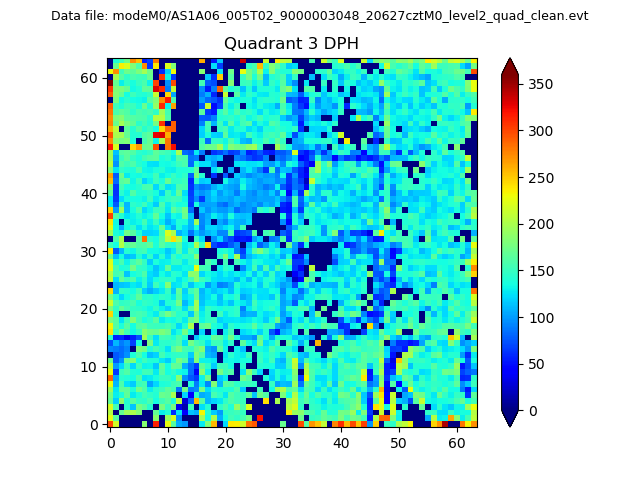 |
 |
Quadrant C |
| Plot type | Count rate plots | Images |
|---|---|---|
| Comparison with Poisson distribution Blue bars denote a histogram of data divided into 1 sec bins. Red curve is a Poisson curve with rate = median count rate of data. |
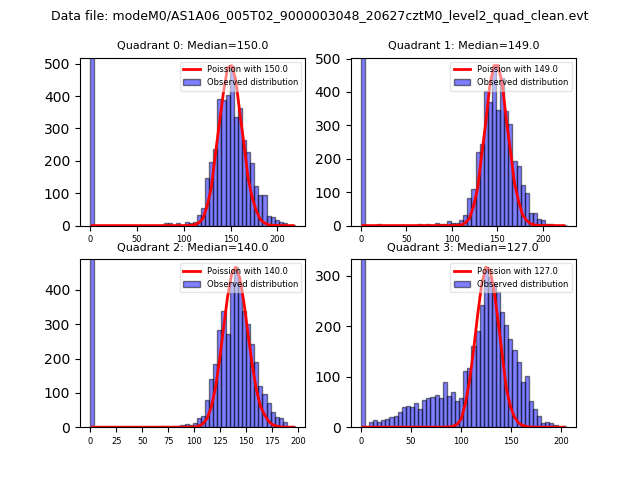 |
 |
| Quadrant-wise count rates Data is divided into 100 sec bins |
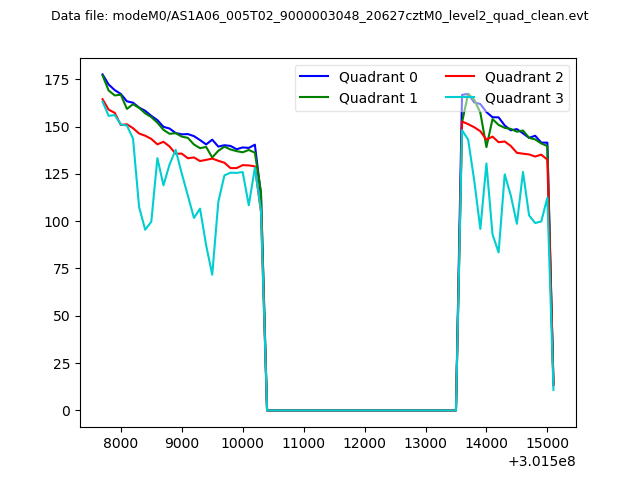 |
|
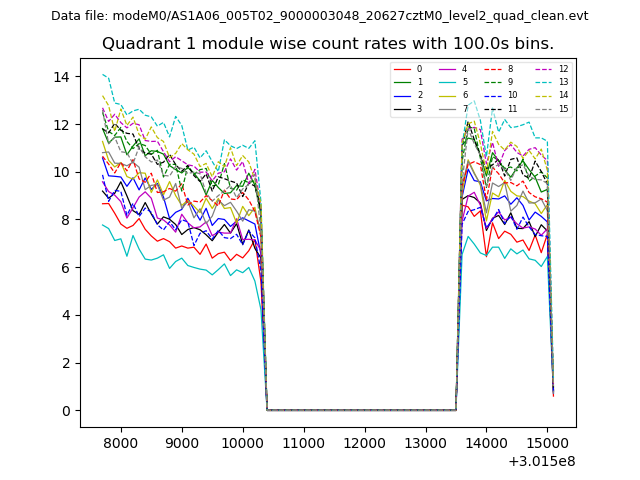
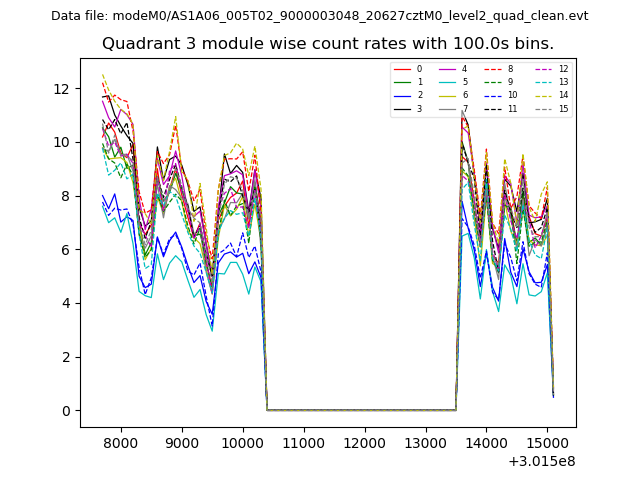
| Module-wise count rates for Quadrant A Data is divided into 100 sec bins |
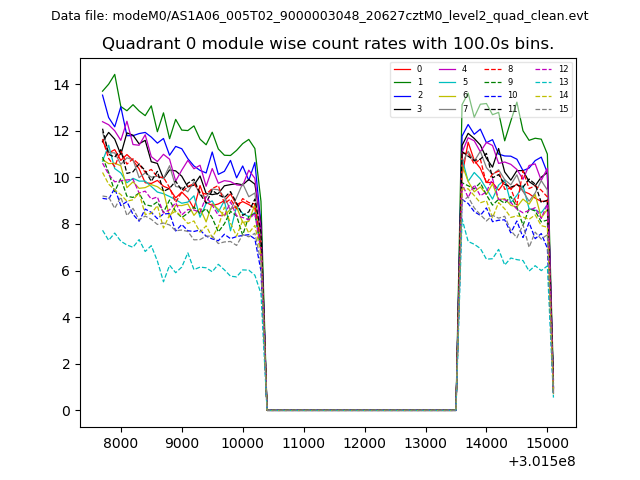 |
 |
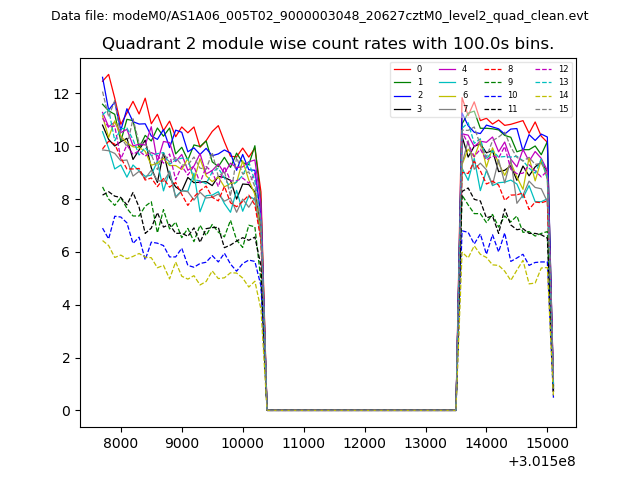
| Module-wise count rates for Quadrant B Data is divided into 100 sec bins |
 |
 |
| Module-wise count rates for Quadrant C Data is divided into 100 sec bins |
 |
 |
| Module-wise count rates for Quadrant D Data is divided into 100 sec bins |
 |
 |
| Parameter | Plot |
|---|---|
| CZT HV Monitor | 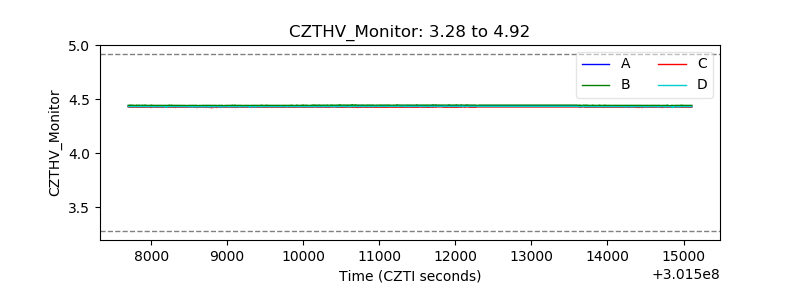 |
| D_VDD | 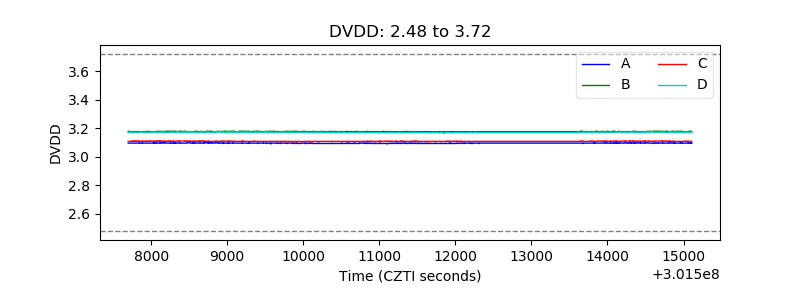 |
| Temperature 1 | 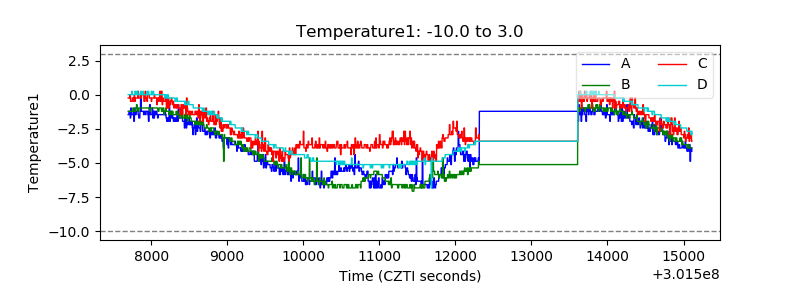 |
| Veto HV Monitor |  |
| Veto LLD | 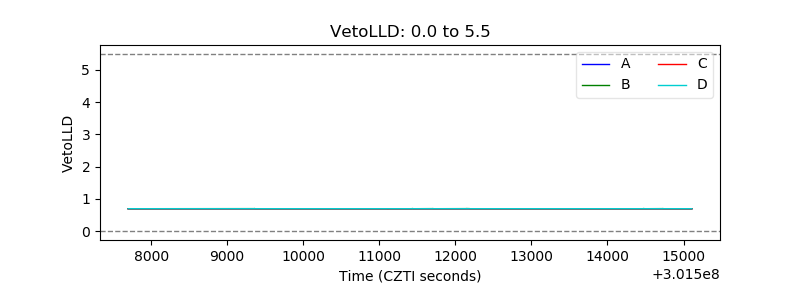 |
| Alpha Counter | 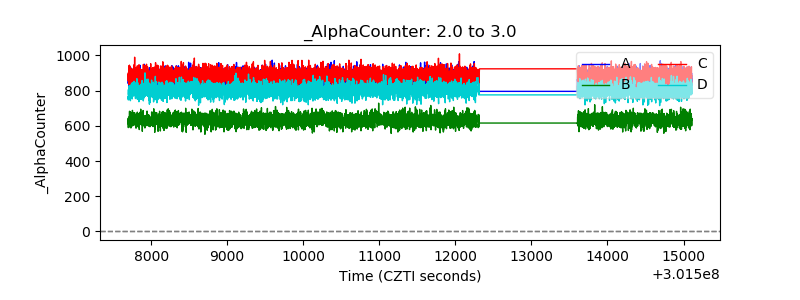 |
| _CPM_Rate | 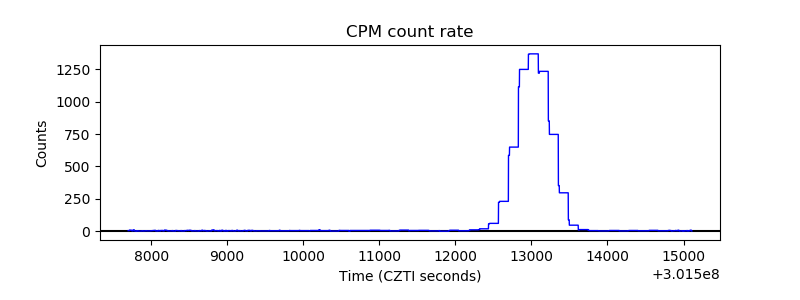 |
| CZT Counter | 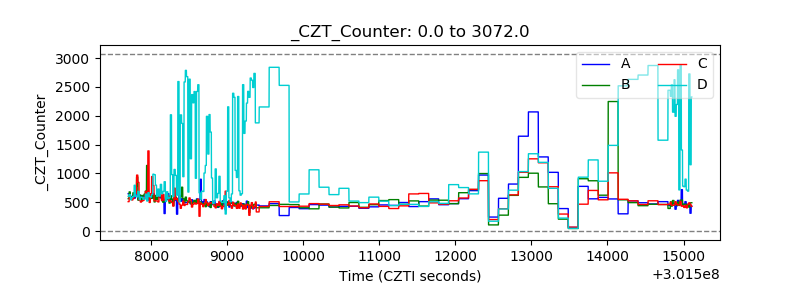 |
| +2.5 Volts monitor |  |
| +5 Volts monitor | 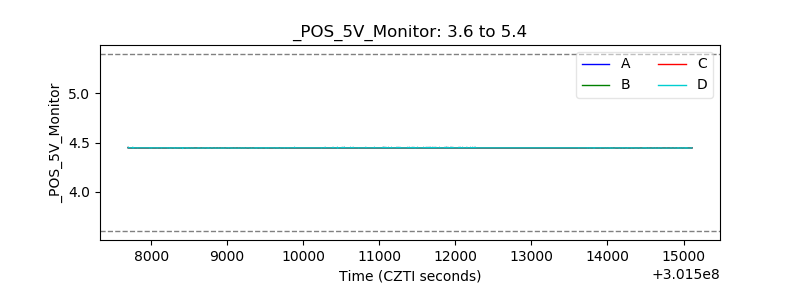 |
| _ROLL_ROT | 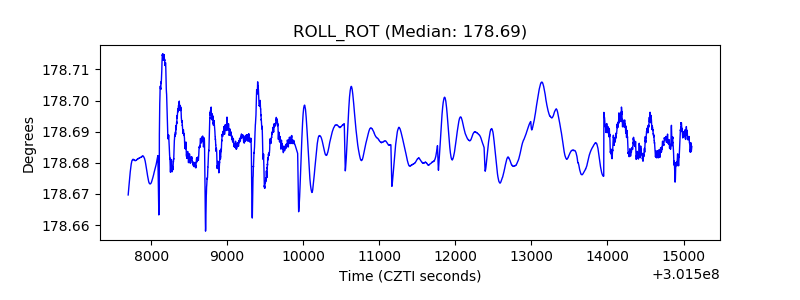 |
| _Roll_DEC | 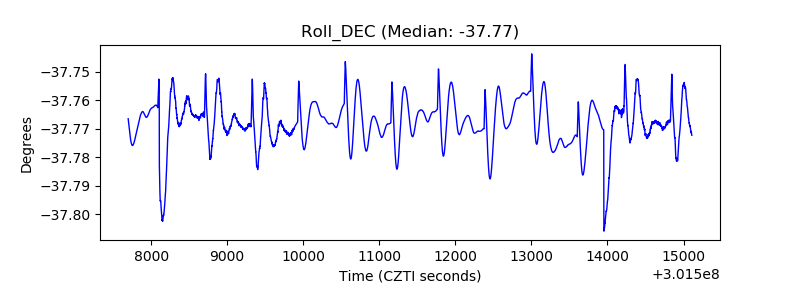 |
| _Roll_RA | 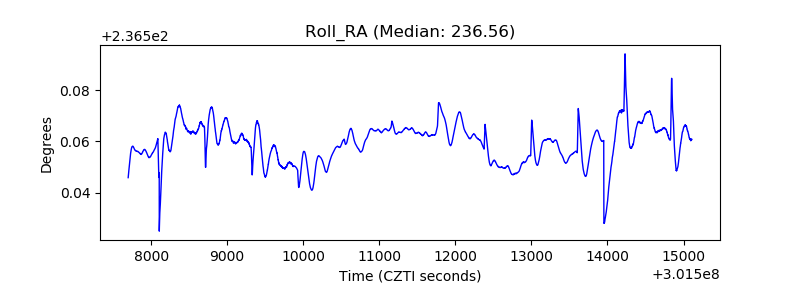 |
| Veto Counter | 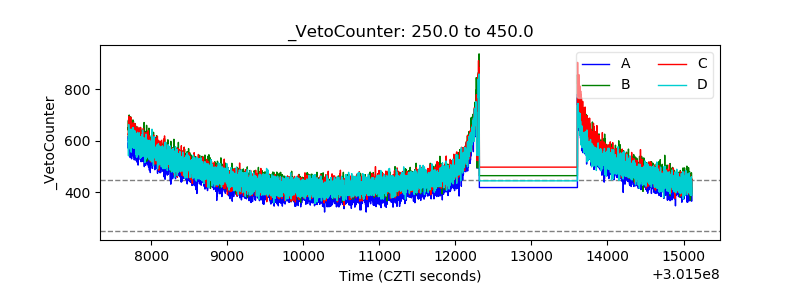 |