| Param | Original file | Final file |
|---|---|---|
| Filename | modeM0/AS1A06_005T02_9000003048_20629cztM0_level2.evt | modeM0/AS1A06_005T02_9000003048_20629cztM0_level2_quad_clean.evt |
| Size (bytes) | 144,452,160 | 35,300,160 |
| Size | 137.8 MB | 33.7 MB |
| Events in quadrant A | 874,544 | 246,326 |
| Events in quadrant B | 896,923 | 244,054 |
| Events in quadrant C | 858,084 | 232,303 |
| Events in quadrant D | 1,621,955 | 215,894 |
| Mode M9 | |||
|---|---|---|---|
| Quadrant | BADHDUFLAG | Total packets | Discarded packets |
| A | 0 | 1 | 0 |
| B | 0 | 2 | 0 |
| C | 0 | 2 | 0 |
| D | 0 | 2 | 0 |
| Mode M0 | |||
|---|---|---|---|
| Quadrant | BADHDUFLAG | Total packets | Discarded packets |
| A | 0 | 3769 | 1 |
| B | 0 | 3798 | 1 |
| C | 0 | 3724 | 1 |
| D | 0 | 5993 | 1 |
| Mode SS | |||
|---|---|---|---|
| Quadrant | BADHDUFLAG | Total packets | Discarded packets |
| A | 0 | 36 | 0 |
| B | 0 | 36 | 0 |
| C | 0 | 36 | 0 |
| D | 0 | 36 | 0 |
| Quadrant | Total seconds | Saturated seconds | Saturation percentage |
|---|---|---|---|
| A | 1773 | 9 | 0.507614% |
| B | 1773 | 11 | 0.620417% |
| C | 1773 | 23 | 1.297236% |
| D | 1773 | 209 | 11.787930% |
Noise dominated data is calculated using 1-second bins in cleaned event files. If a bin has >2000 counts, and if more than 50% of those come from <1% of pixels, then it is considered to be noise-dominated and hence unusable.
| Quadrant | # 1 sec bins | Bins with >0 counts | Bins with >2000 counts | High rate bins dominated by noise | Noise dominated (total time) | Noise dominated (detector-on time) | Marked lightcurve |
|---|---|---|---|---|---|---|---|
| A | 1773 | 1773 | 0 | 0 | 0.00% | 0.00% | 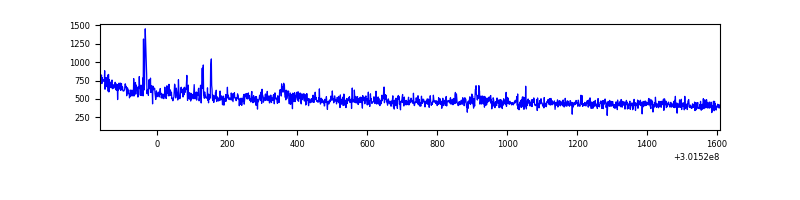 |
| B | 1773 | 1773 | 0 | 0 | 0.00% | 0.00% | 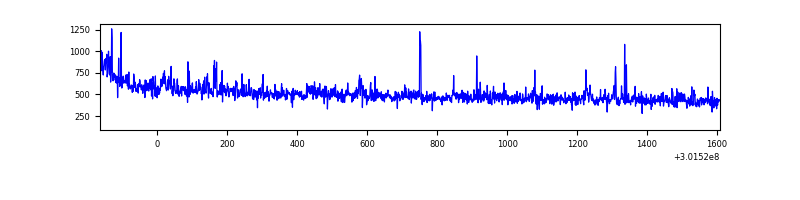 |
| C | 1773 | 1773 | 0 | 0 | 0.00% | 0.00% | 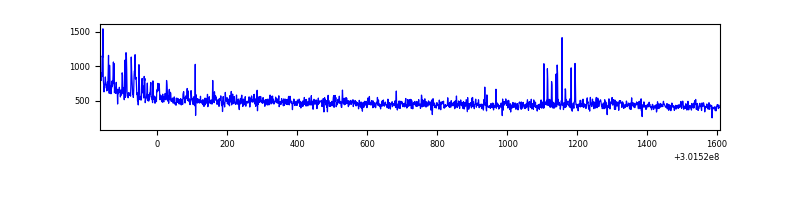 |
| D | 1773 | 1773 | 148 | 148 | 8.35% | 8.35% | 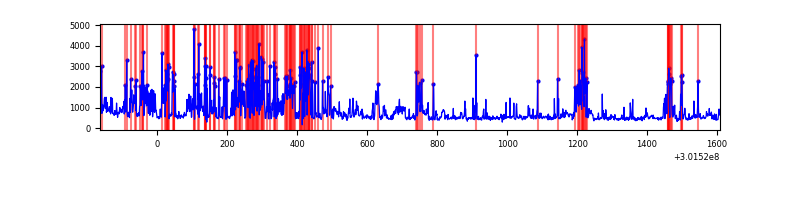 |
Top three noisy pixels from each quadrant. If the there are fewer than three noisy pixels in the level2.evt file, extra rows are filled as -1
| Pixel properties | Quadrant properties | ||||||
|---|---|---|---|---|---|---|---|
| Quadrant | DetID | PixID | Counts | Sigma | Mean | Median | Sigma |
| A | 12 | 16 | 18761 | 405.15 | 219 | 215 | 45.8 |
| A | 5 | 16 | 10252 | 219.27 | 219 | 215 | 45.8 |
| A | 12 | 194 | 5433 | 113.99 | 219 | 215 | 45.8 |
| B | 0 | 190 | 12655 | 286.59 | 216 | 212 | 43.4 |
| B | 0 | 189 | 10371 | 233.99 | 216 | 212 | 43.4 |
| B | 0 | 244 | 6250 | 139.07 | 216 | 212 | 43.4 |
| C | 14 | 238 | 32515 | 665.27 | 202 | 203 | 48.6 |
| C | 8 | 208 | 29978 | 613.04 | 202 | 203 | 48.6 |
| C | 3 | 233 | 3069 | 59.01 | 202 | 203 | 48.6 |
| D | 1 | 52 | 418126 | 8479.97 | 197 | 190 | 49.3 |
| D | 1 | 20 | 275875 | 5593.68 | 197 | 190 | 49.3 |
| D | 13 | 153 | 71502 | 1446.93 | 197 | 190 | 49.3 |
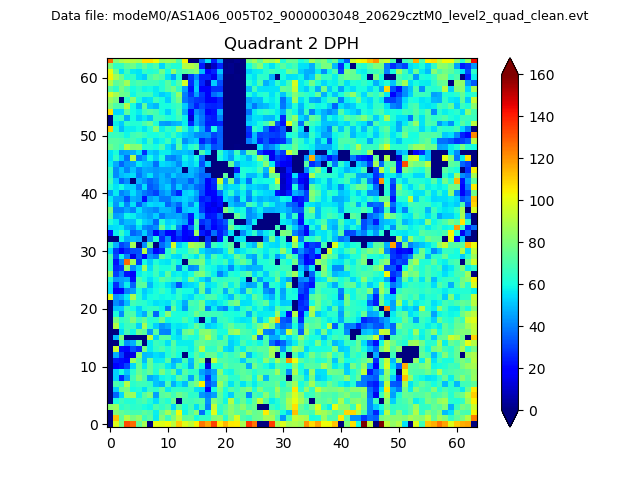
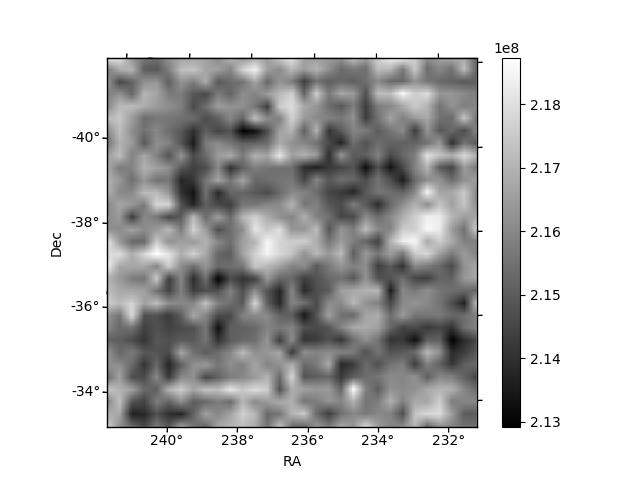
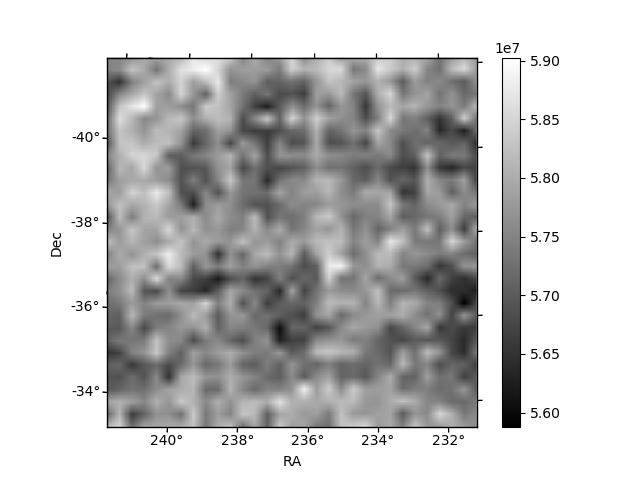
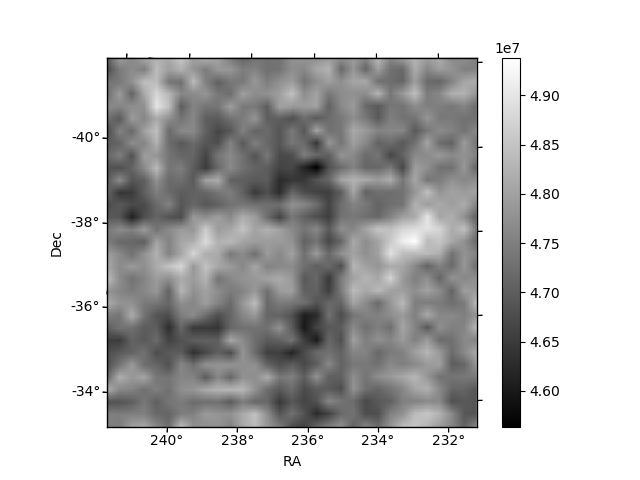
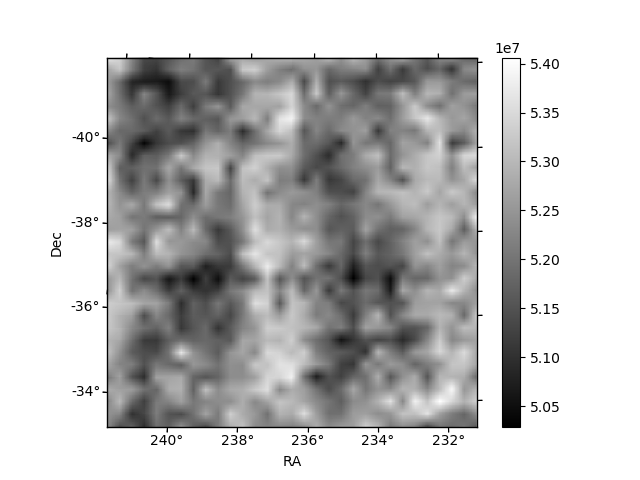
Histogram calculated using DETX and DETY for each event in the final _common_clean file
| Quadrant A | 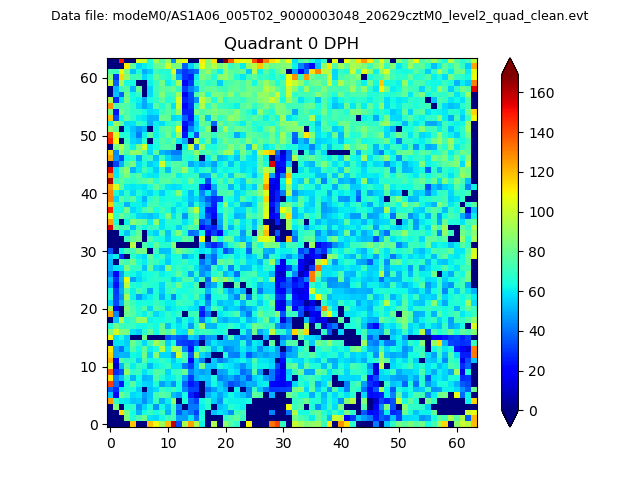 |
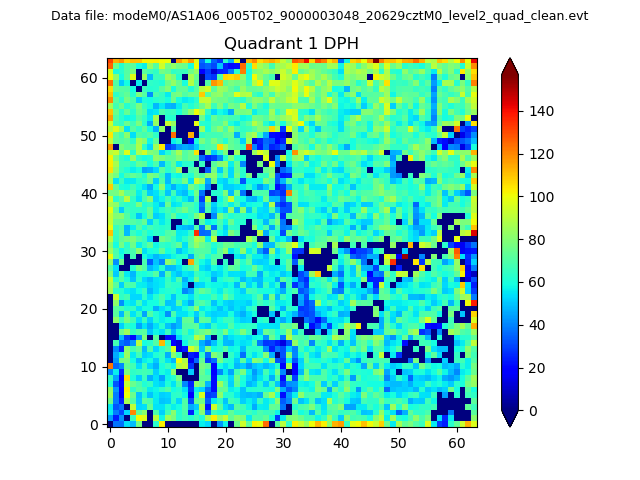 |
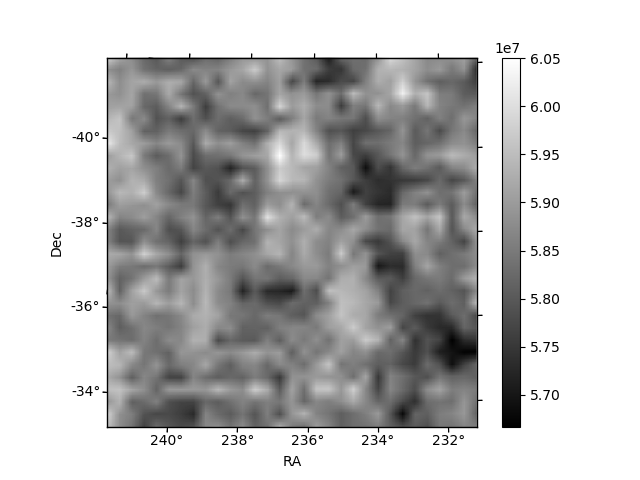
Quadrant B |
|---|---|---|---|
| Quadrant D | 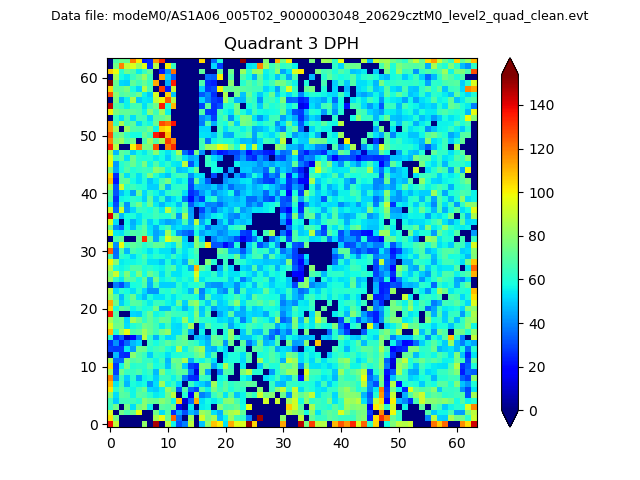 |
 |
Quadrant C |
| Plot type | Count rate plots | Images |
|---|---|---|
| Comparison with Poisson distribution Blue bars denote a histogram of data divided into 1 sec bins. Red curve is a Poisson curve with rate = median count rate of data. |
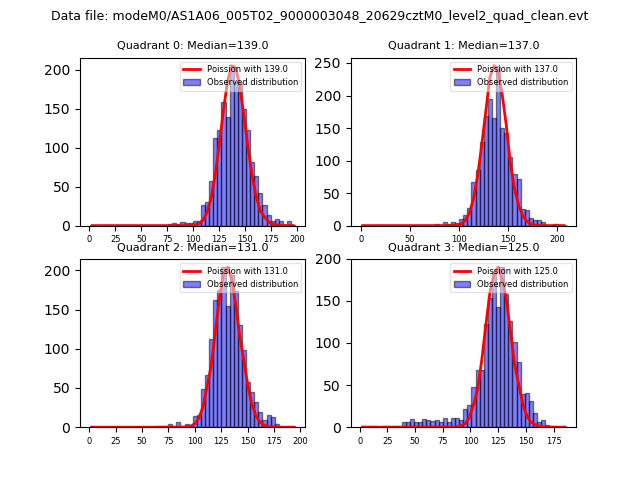 |
 |
| Quadrant-wise count rates Data is divided into 100 sec bins |
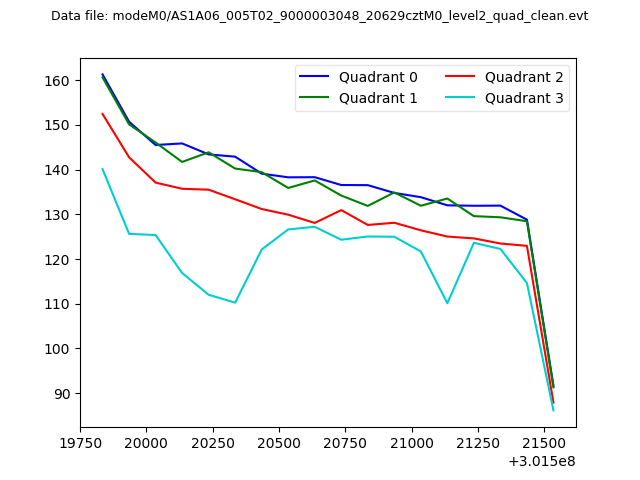 |
|
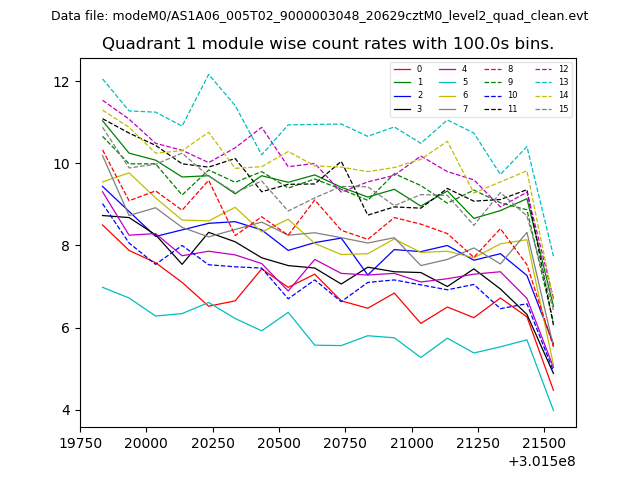
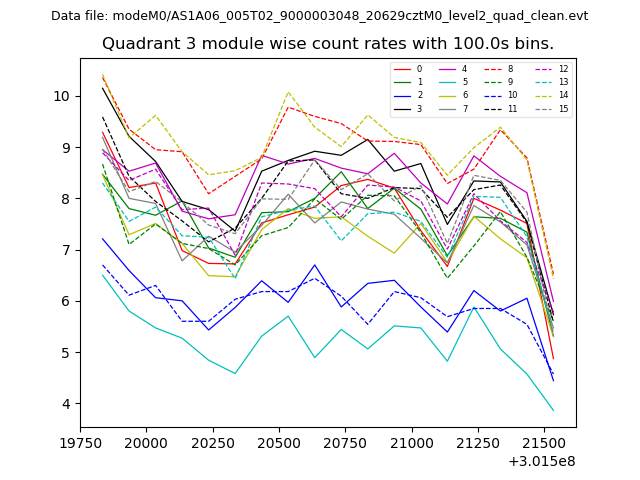
| Module-wise count rates for Quadrant A Data is divided into 100 sec bins |
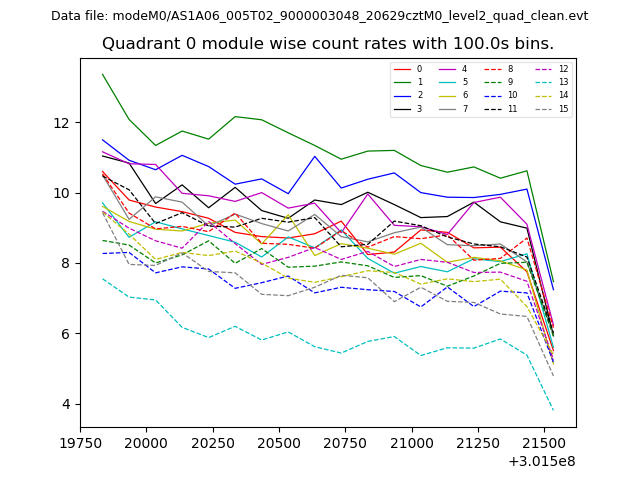 |
 |
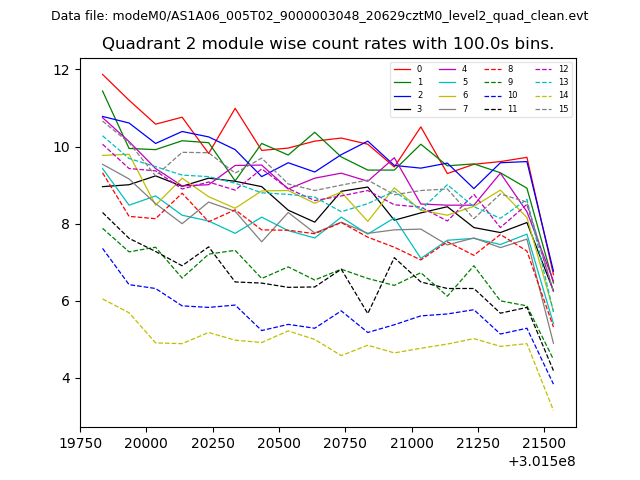
| Module-wise count rates for Quadrant B Data is divided into 100 sec bins |
 |
 |
| Module-wise count rates for Quadrant C Data is divided into 100 sec bins |
 |
 |
| Module-wise count rates for Quadrant D Data is divided into 100 sec bins |
 |
 |
| Parameter | Plot |
|---|---|
| CZT HV Monitor | 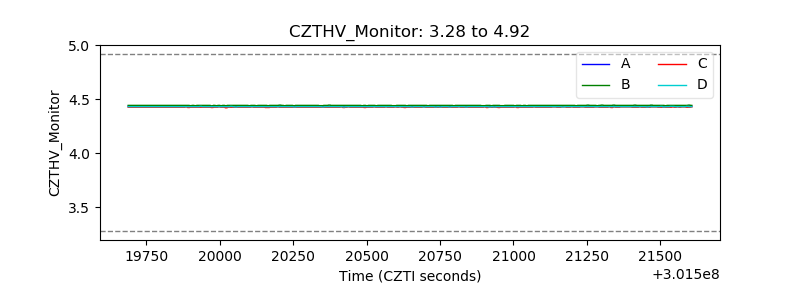 |
| D_VDD | 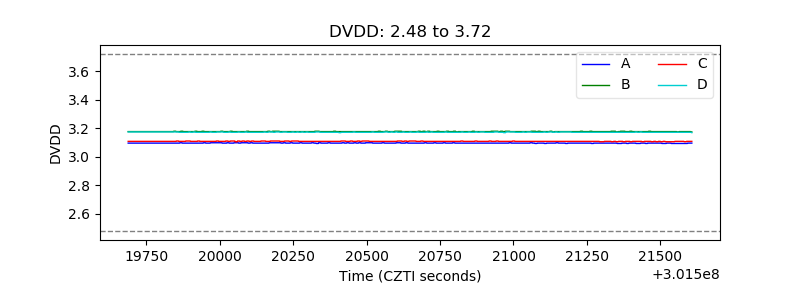 |
| Temperature 1 | 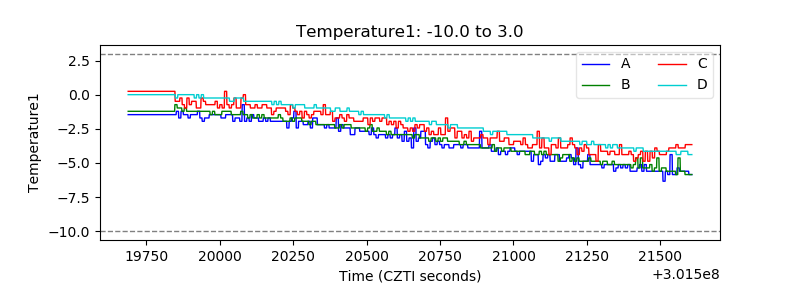 |
| Veto HV Monitor | 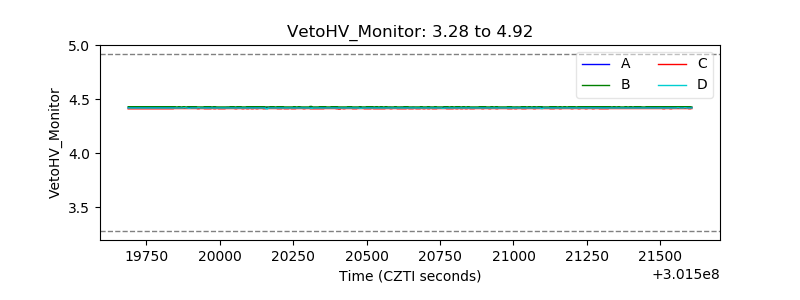 |
| Veto LLD | 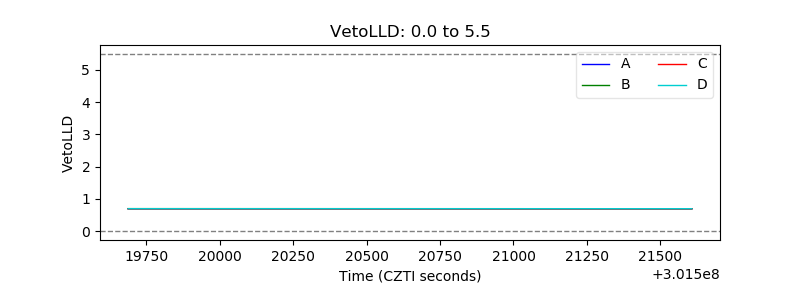 |
| Alpha Counter | 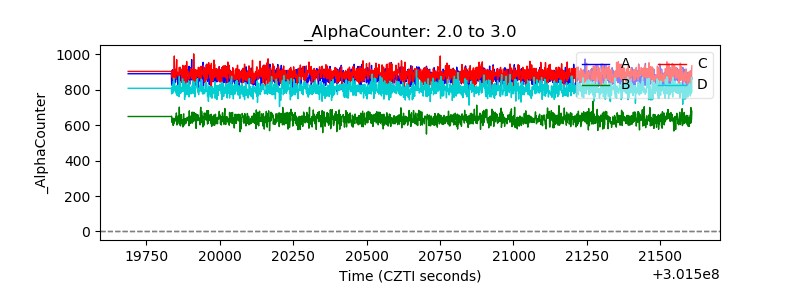 |
| _CPM_Rate | 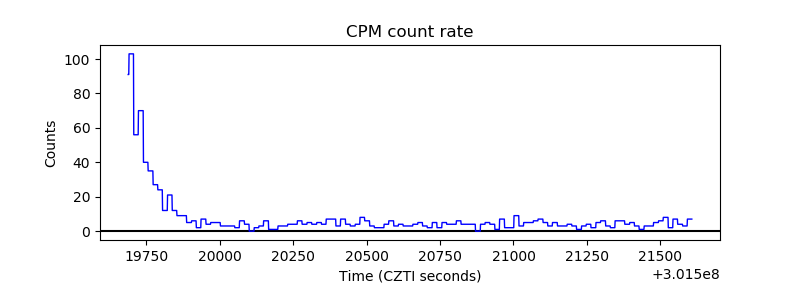 |
| CZT Counter | 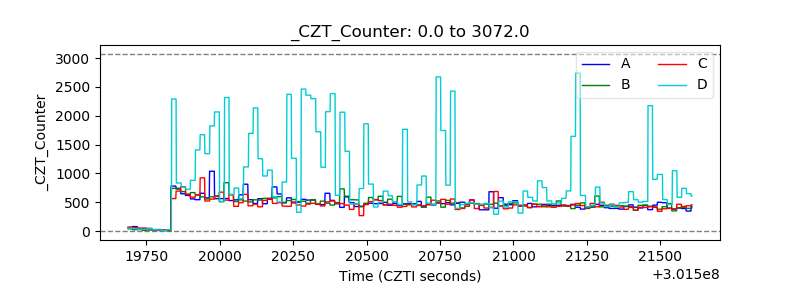 |
| +2.5 Volts monitor |  |
| +5 Volts monitor |  |
| _ROLL_ROT | 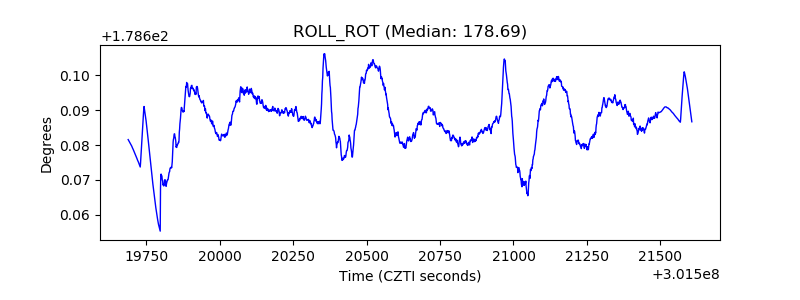 |
| _Roll_DEC | 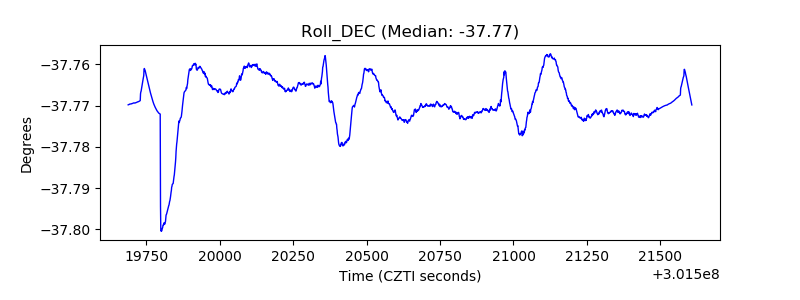 |
| _Roll_RA | 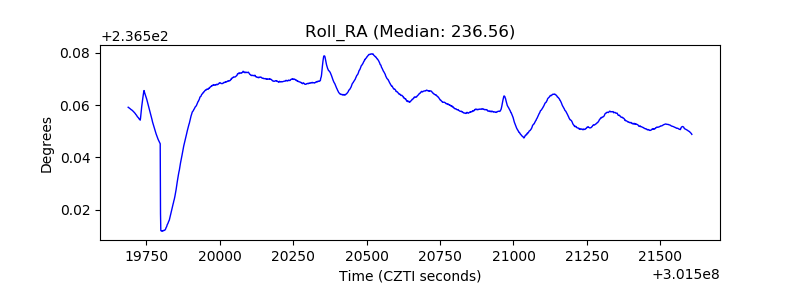 |
| Veto Counter | 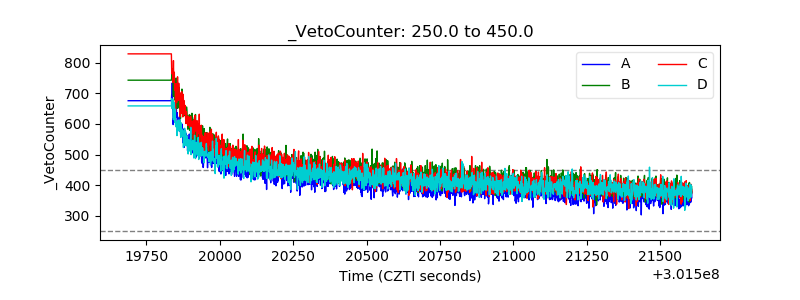 |