| Param | Original file | Final file |
|---|---|---|
| Filename | modeM0/AS1A05_007T06_9000003050cztM0_level2.fits | modeM0/AS1A05_007T06_9000003050cztM0_level2_quad_clean.evt |
| Size (bytes) | 69,120,000 | 39,755,520 |
| Size | 65.9 MB | 37.9 MB |
| Events in quadrant A | 436,096 | 191,223 |
| Events in quadrant B | 412,114 | 189,761 |
| Events in quadrant C | 423,242 | 179,276 |
| Events in quadrant D | 331,050 | 152,797 |
| Mode SS | |||
|---|---|---|---|
| Quadrant | BADHDUFLAG | Total packets | Discarded packets |
| A | 0 | 152 | 0 |
| B | 0 | 142 | 0 |
| C | 0 | 148 | 0 |
| D | 0 | 144 | 0 |
| Mode M9 | |||
|---|---|---|---|
| Quadrant | BADHDUFLAG | Total packets | Discarded packets |
| A | 0 | 16 | 0 |
| B | 0 | 16 | 0 |
| C | 0 | 15 | 0 |
| D | 0 | 16 | 0 |
| Mode M0 | |||
|---|---|---|---|
| Quadrant | BADHDUFLAG | Total packets | Discarded packets |
| A | 0 | 14515 | 0 |
| B | 0 | 15536 | 0 |
| C | 0 | 14810 | 0 |
| D | 0 | 24773 | 0 |
| Quadrant | Total seconds | Saturated seconds | Saturation percentage |
|---|---|---|---|
| A | 7046 | 46 | 0.652853% |
| B | 7053 | 118 | 1.673047% |
| C | 7030 | 133 | 1.891892% |
| D | 6960 | 1040 | 14.942529% |
Noise dominated data is calculated using 1-second bins in cleaned event files. If a bin has >2000 counts, and if more than 50% of those come from <1% of pixels, then it is considered to be noise-dominated and hence unusable.
| Quadrant | # 1 sec bins | Bins with >0 counts | Bins with >2000 counts | High rate bins dominated by noise | Noise dominated (total time) | Noise dominated (detector-on time) | Marked lightcurve |
|---|---|---|---|---|---|---|---|
| A | 16166 | 7570 | 0 | 0 | 0.00% | 0.00% | 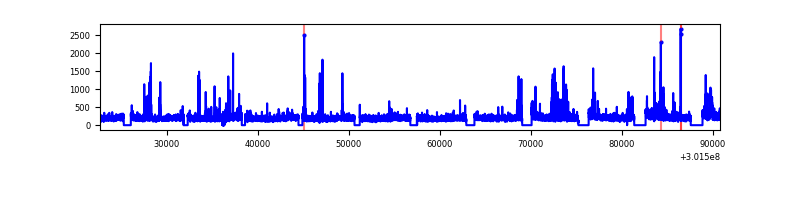 |
| B | 16166 | 7564 | 0 | 0 | 0.00% | 0.00% | 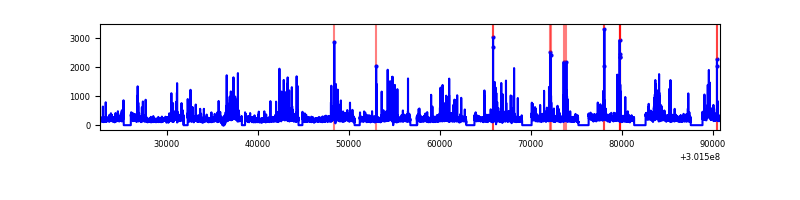 |
| C | 16165 | 7553 | 0 | 0 | 0.00% | 0.00% | 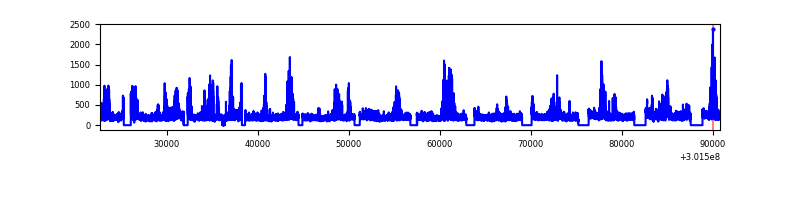 |
| D | 16164 | 7403 | 0 | 0 | 0.00% | 0.00% | 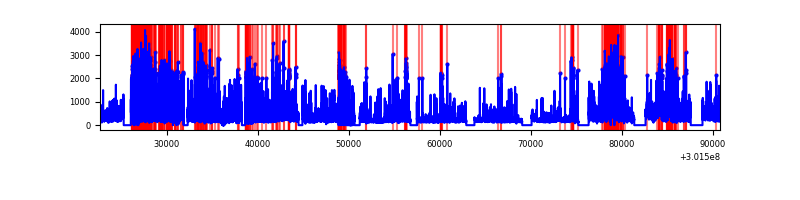 |
Top three noisy pixels from each quadrant. If the there are fewer than three noisy pixels in the level2.evt file, extra rows are filled as -1
| Pixel properties | Quadrant properties | ||||||
|---|---|---|---|---|---|---|---|
| Quadrant | DetID | PixID | Counts | Sigma | Mean | Median | Sigma |
| A | 0 | 29 | 398 | 9.74 | 113 | 107 | 29.9 |
| A | 9 | 19 | 348 | 8.07 | 113 | 107 | 29.9 |
| A | 7 | 110 | 326 | 7.33 | 113 | 107 | 29.9 |
| B | 2 | 9 | 328 | 9.47 | 109 | 104 | 23.6 |
| B | 2 | 8 | 304 | 8.46 | 109 | 104 | 23.6 |
| B | 3 | 17 | 282 | 7.53 | 109 | 104 | 23.6 |
| C | 12 | 241 | 306 | 6.74 | 111 | 105 | 29.8 |
| C | 9 | 209 | 290 | 6.2 | 111 | 105 | 29.8 |
| C | 9 | 242 | 288 | 6.13 | 111 | 105 | 29.8 |
| D | 4 | 246 | 259 | 6.47 | 94 | 86 | 26.7 |
| D | 3 | 14 | 257 | 6.4 | 94 | 86 | 26.7 |
| D | 7 | 3 | 255 | 6.32 | 94 | 86 | 26.7 |
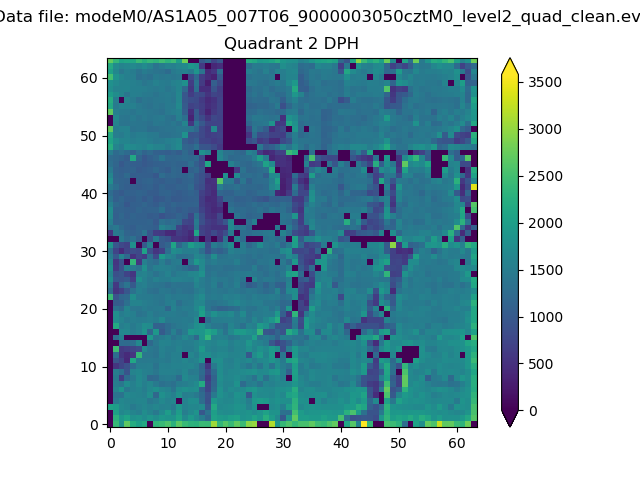
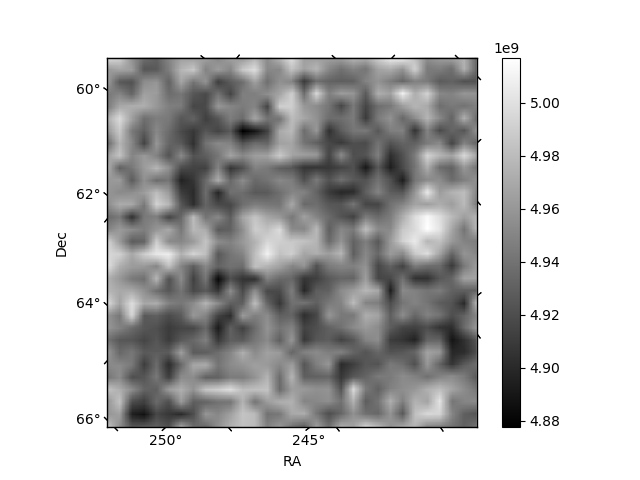
Histogram calculated using DETX and DETY for each event in the final _common_clean file
| Quadrant A | 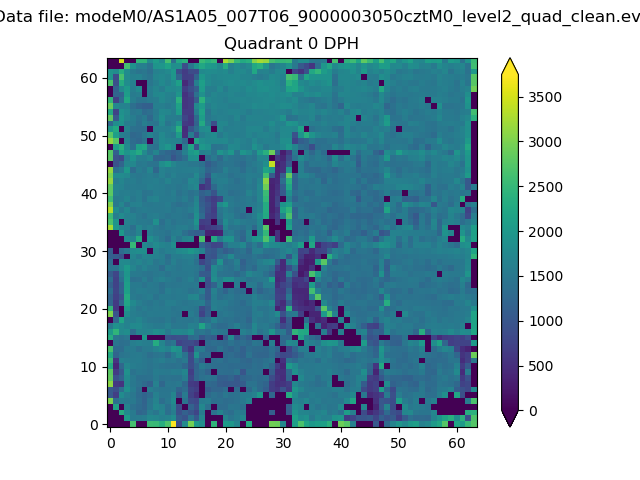 |
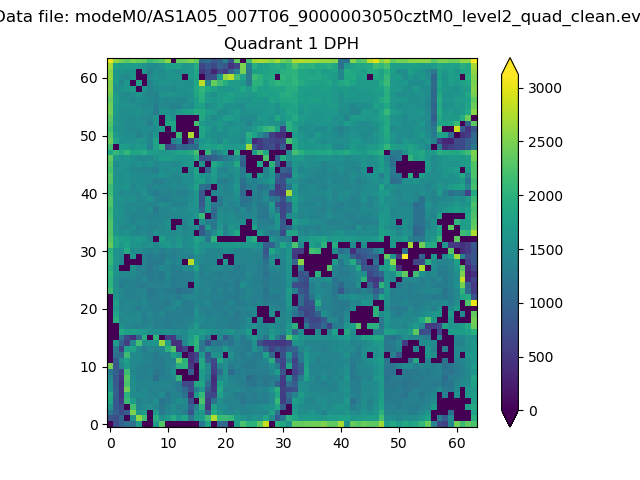 |
Quadrant B |
|---|---|---|---|
| Quadrant D | 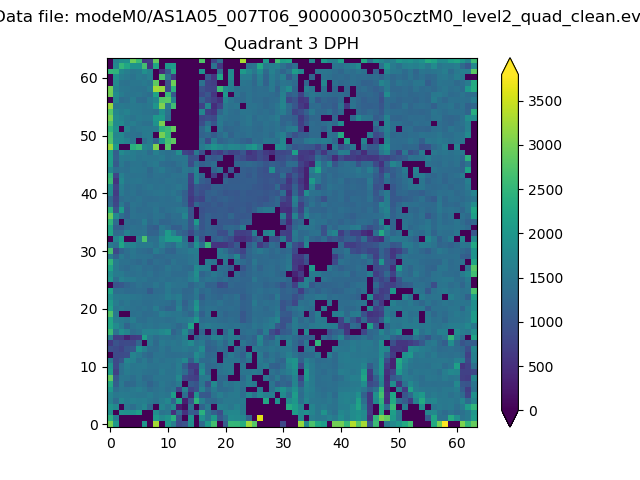 |
 |
Quadrant C |
| Plot type | Count rate plots | Images |
|---|---|---|
| Comparison with Poisson distribution Blue bars denote a histogram of data divided into 1 sec bins. Red curve is a Poisson curve with rate = median count rate of data. |
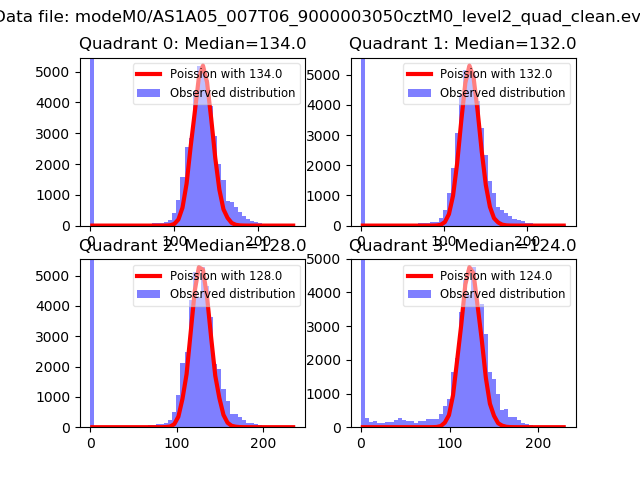 |
 |
| Quadrant-wise count rates Data is divided into 100 sec bins |
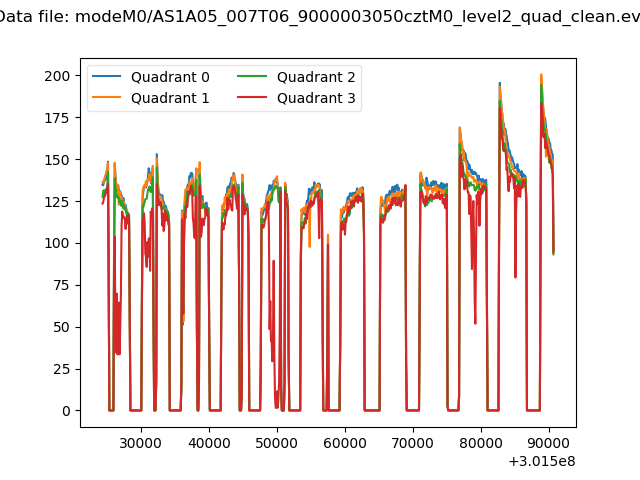 |
|
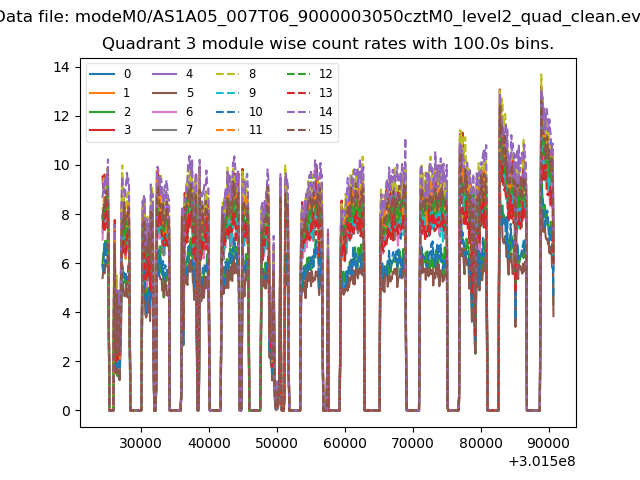
| Module-wise count rates for Quadrant A Data is divided into 100 sec bins |
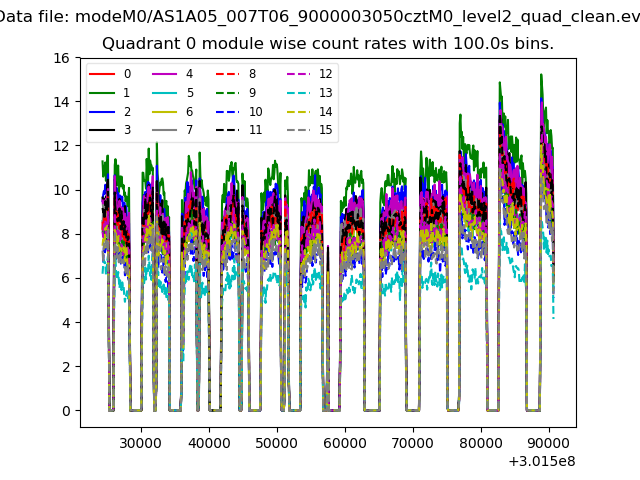 |
 |
| Module-wise count rates for Quadrant B Data is divided into 100 sec bins |
 |
 |
| Module-wise count rates for Quadrant C Data is divided into 100 sec bins |
 |
 |
| Module-wise count rates for Quadrant D Data is divided into 100 sec bins |
 |
 |
| Parameter | Plot |
|---|---|
| CZT HV Monitor | 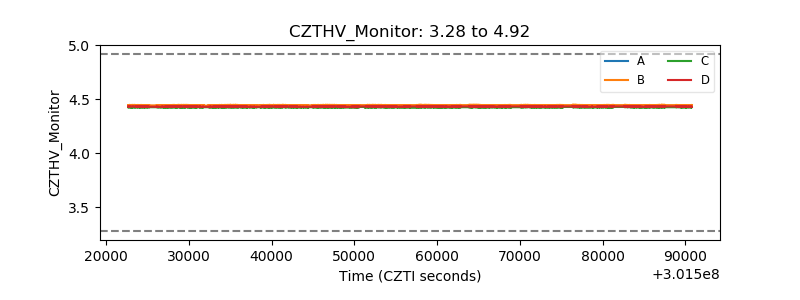 |
| D_VDD | 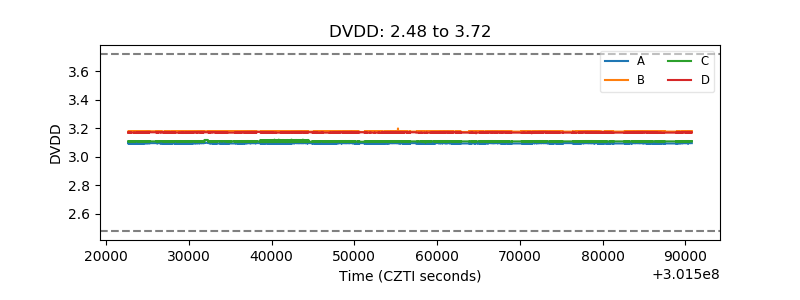 |
| Temperature 1 |  |
| Veto HV Monitor | 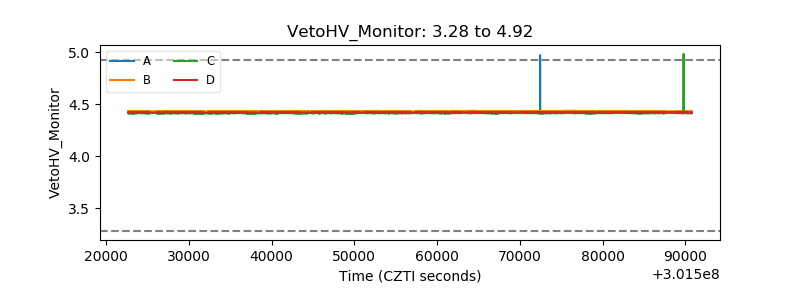 |
| Veto LLD | 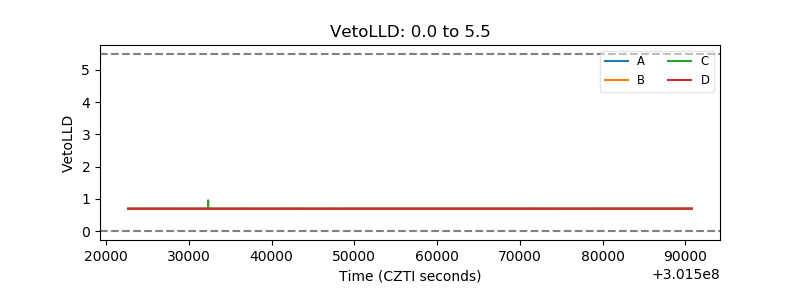 |
| Alpha Counter | 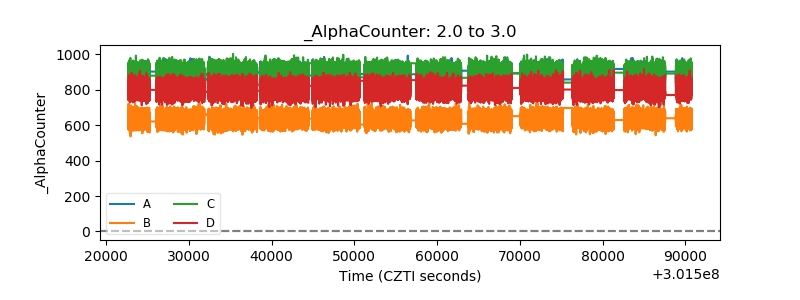 |
| _CPM_Rate | 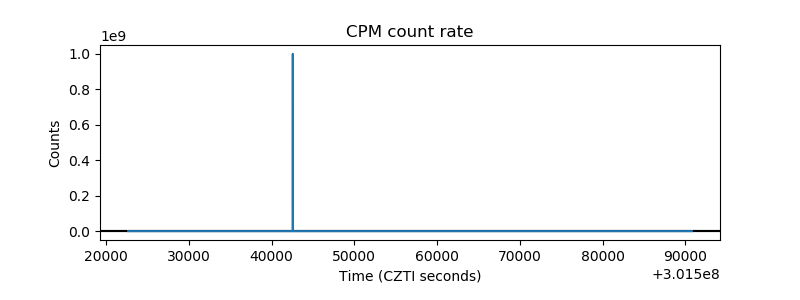 |
| CZT Counter | 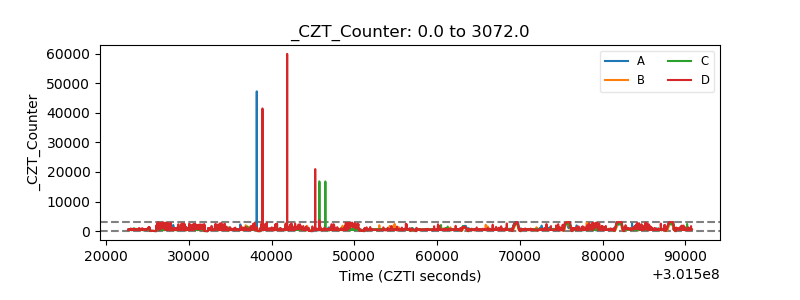 |
| +2.5 Volts monitor | 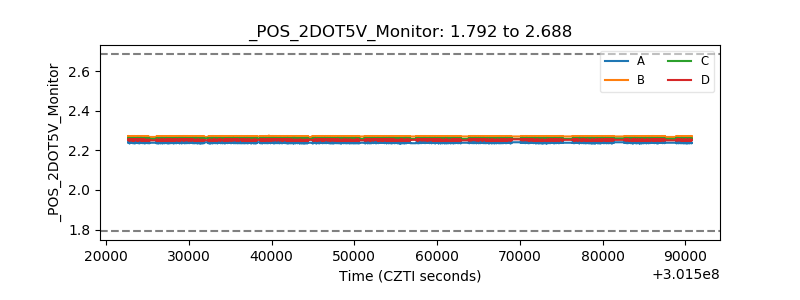 |
| +5 Volts monitor |  |
| _ROLL_ROT | 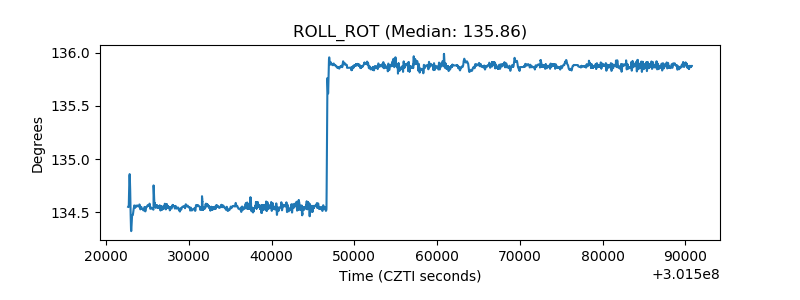 |
| _Roll_DEC | 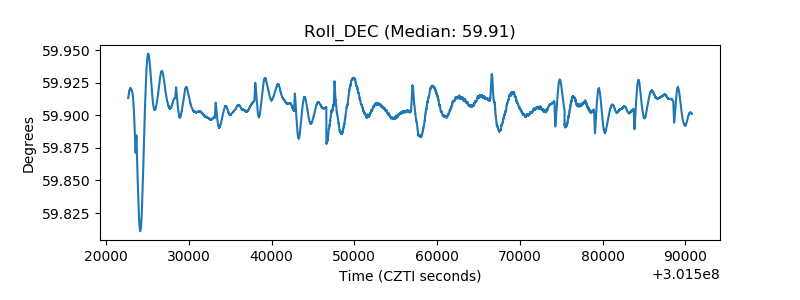 |
| _Roll_RA | 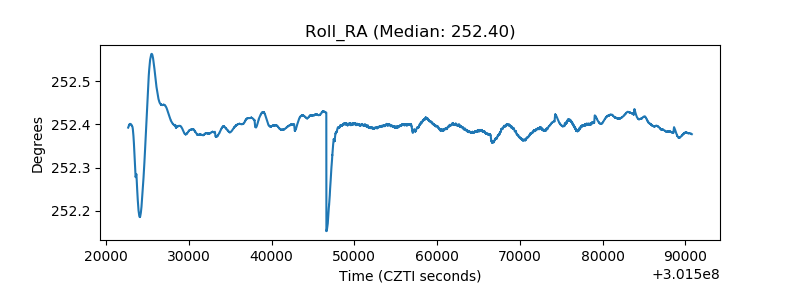 |
| Veto Counter | 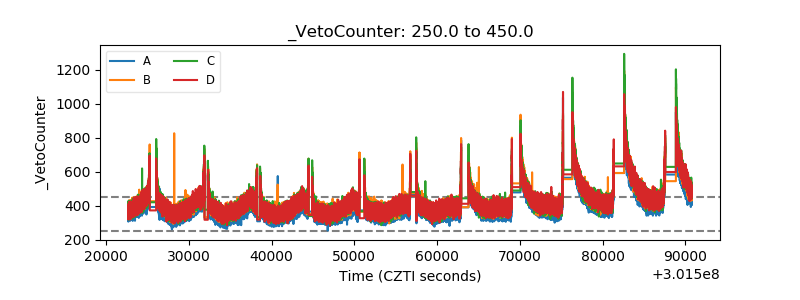 |