| Param | Original file | Final file |
|---|---|---|
| Filename | modeM0/AS1A05_007T06_9000003050_20617cztM0_level2.evt | modeM0/AS1A05_007T06_9000003050_20617cztM0_level2_quad_clean.evt |
| Size (bytes) | 272,882,880 | 43,464,960 |
| Size | 260.2 MB | 41.5 MB |
| Events in quadrant A | 1,434,780 | 304,364 |
| Events in quadrant B | 1,526,597 | 302,360 |
| Events in quadrant C | 1,562,208 | 290,719 |
| Events in quadrant D | 3,537,542 | 207,423 |
| Mode SS | |||
|---|---|---|---|
| Quadrant | BADHDUFLAG | Total packets | Discarded packets |
| A | 0 | 82 | 16 |
| B | 0 | 82 | 20 |
| C | 0 | 82 | 16 |
| D | 0 | 82 | 20 |
| Mode M9 | |||
|---|---|---|---|
| Quadrant | BADHDUFLAG | Total packets | Discarded packets |
| A | 0 | 8 | 0 |
| B | 0 | 8 | 0 |
| C | 0 | 8 | 0 |
| D | 0 | 8 | 0 |
| Mode M0 | |||
|---|---|---|---|
| Quadrant | BADHDUFLAG | Total packets | Discarded packets |
| A | 0 | 8276 | 2102 |
| B | 0 | 8528 | 2110 |
| C | 0 | 8682 | 2214 |
| D | 0 | 15268 | 2808 |
| Quadrant | Total seconds | Saturated seconds | Saturation percentage |
|---|---|---|---|
| A | 2954 | 29 | 0.981720% |
| B | 2958 | 66 | 2.231237% |
| C | 2963 | 91 | 3.071212% |
| D | 2890 | 834 | 28.858131% |
Noise dominated data is calculated using 1-second bins in cleaned event files. If a bin has >2000 counts, and if more than 50% of those come from <1% of pixels, then it is considered to be noise-dominated and hence unusable.
| Quadrant | # 1 sec bins | Bins with >0 counts | Bins with >2000 counts | High rate bins dominated by noise | Noise dominated (total time) | Noise dominated (detector-on time) | Marked lightcurve |
|---|---|---|---|---|---|---|---|
| A | 4788 | 3351 | 0 | 0 | 0.00% | 0.00% | 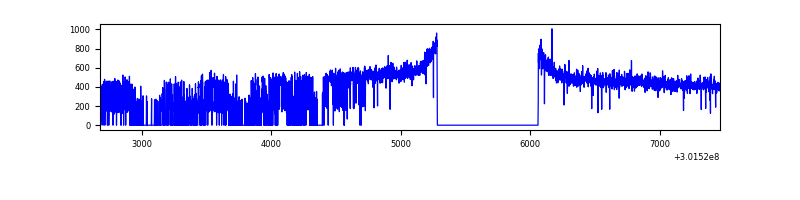 |
| B | 4788 | 3343 | 7 | 7 | 0.15% | 0.21% | 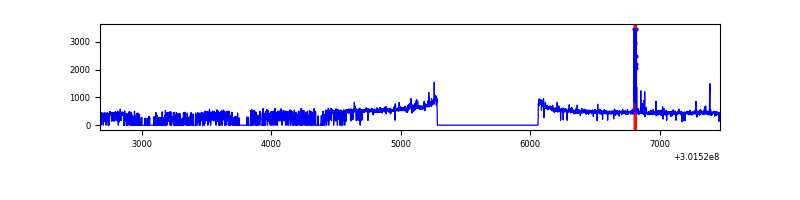 |
| C | 4788 | 3357 | 0 | 0 | 0.00% | 0.00% | 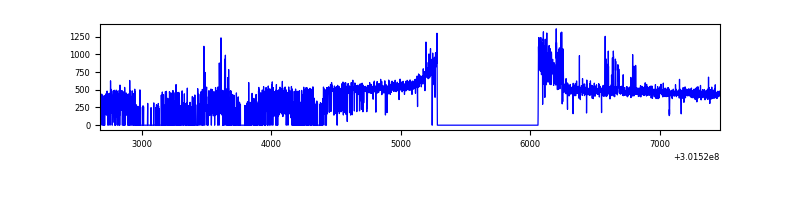 |
| D | 4787 | 3290 | 675 | 675 | 14.10% | 20.52% | 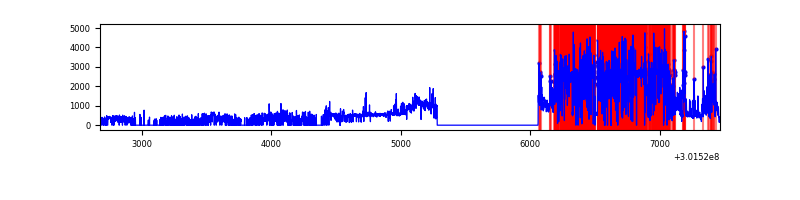 |
Top three noisy pixels from each quadrant. If the there are fewer than three noisy pixels in the level2.evt file, extra rows are filled as -1
| Pixel properties | Quadrant properties | ||||||
|---|---|---|---|---|---|---|---|
| Quadrant | DetID | PixID | Counts | Sigma | Mean | Median | Sigma |
| A | 0 | 226 | 3296 | 38.49 | 372 | 363 | 76.2 |
| A | 3 | 137 | 3121 | 36.2 | 372 | 363 | 76.2 |
| A | 12 | 194 | 2908 | 33.4 | 372 | 363 | 76.2 |
| B | 7 | 220 | 32778 | 453.71 | 370 | 360 | 71.5 |
| B | 0 | 197 | 15412 | 210.66 | 370 | 360 | 71.5 |
| B | 12 | 111 | 8205 | 109.8 | 370 | 360 | 71.5 |
| C | 8 | 208 | 97512 | 1138.18 | 359 | 359 | 85.4 |
| C | 14 | 238 | 57050 | 664.15 | 359 | 359 | 85.4 |
| C | 3 | 233 | 5835 | 64.15 | 359 | 359 | 85.4 |
| D | 1 | 52 | 2180942 | 29744.02 | 294 | 284 | 73.3 |
| D | 7 | 238 | 124264 | 1691.08 | 294 | 284 | 73.3 |
| D | 1 | 20 | 37162 | 503.01 | 294 | 284 | 73.3 |
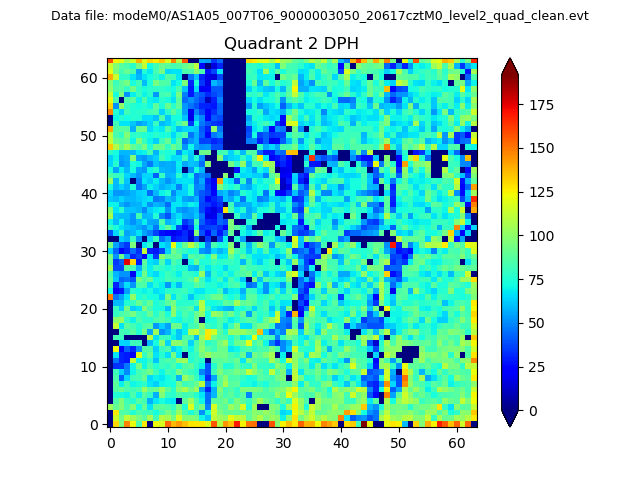
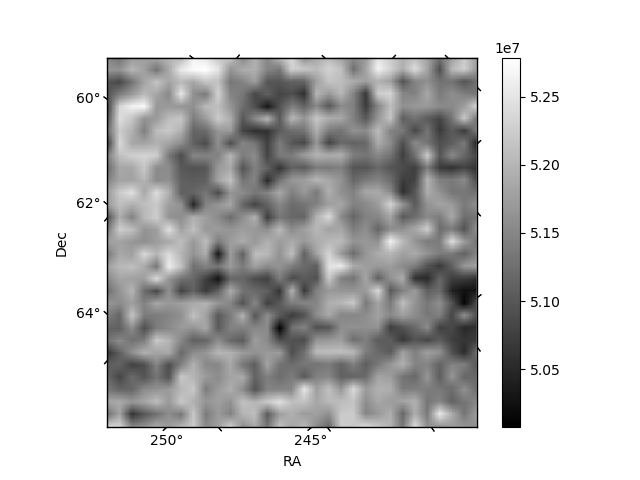
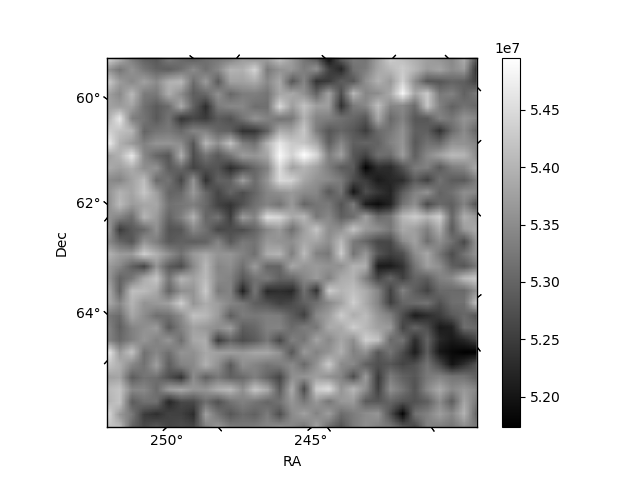
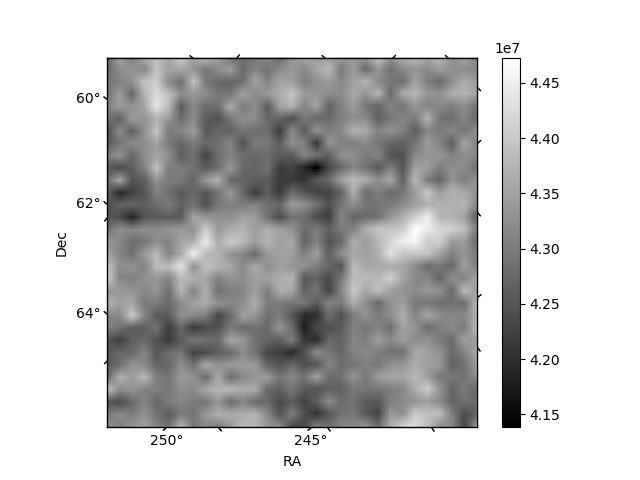
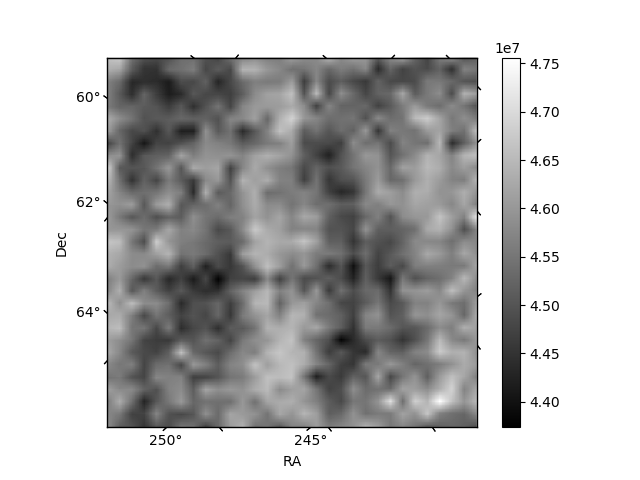
Histogram calculated using DETX and DETY for each event in the final _common_clean file
| Quadrant A |  |
 |
Quadrant B |
|---|---|---|---|
| Quadrant D | 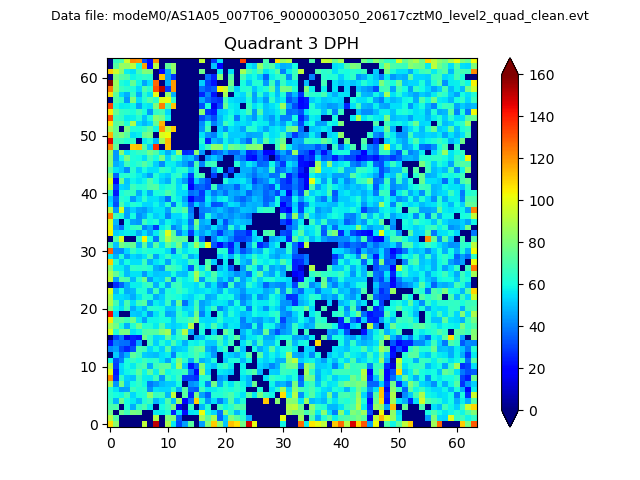 |
 |
Quadrant C |
| Plot type | Count rate plots | Images |
|---|---|---|
| Comparison with Poisson distribution Blue bars denote a histogram of data divided into 1 sec bins. Red curve is a Poisson curve with rate = median count rate of data. |
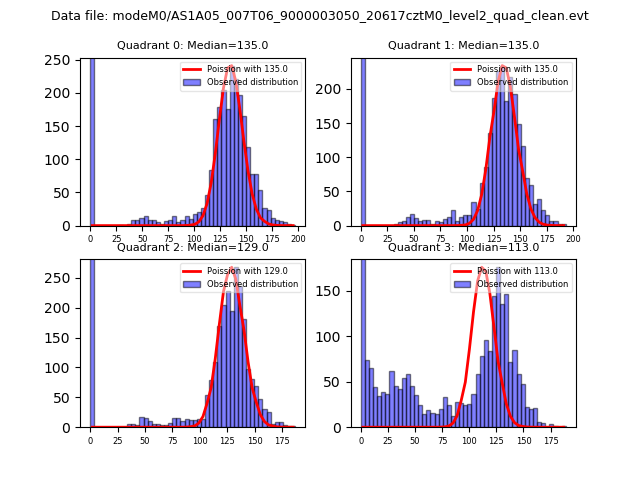 |
 |
| Quadrant-wise count rates Data is divided into 100 sec bins |
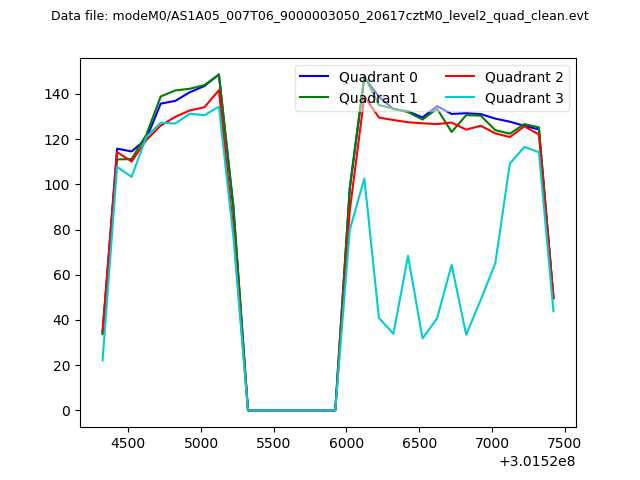 |
|
| Module-wise count rates for Quadrant A Data is divided into 100 sec bins |
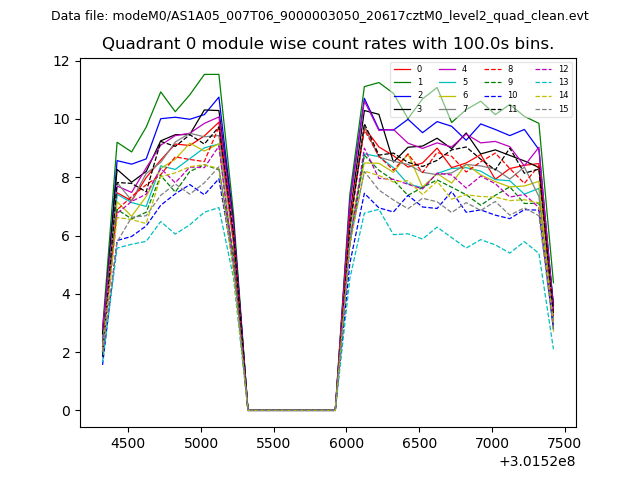 |
 |
| Module-wise count rates for Quadrant B Data is divided into 100 sec bins |
 |
 |
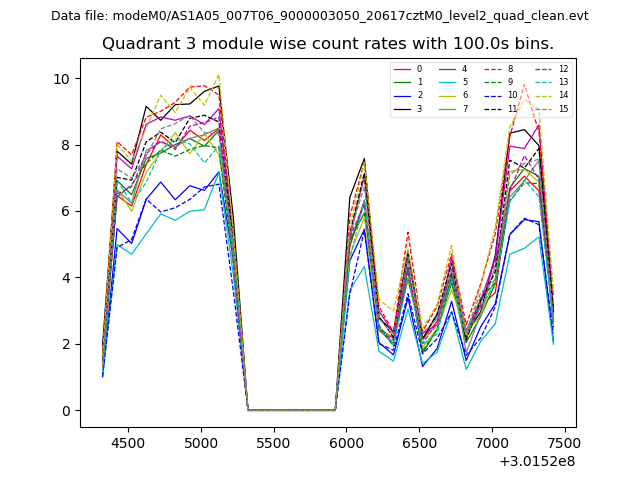
| Module-wise count rates for Quadrant C Data is divided into 100 sec bins |
 |
 |
| Module-wise count rates for Quadrant D Data is divided into 100 sec bins |
 |
 |
| Parameter | Plot |
|---|---|
| CZT HV Monitor |  |
| D_VDD | 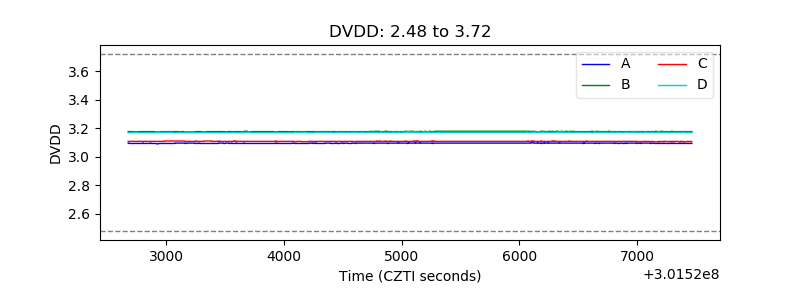 |
| Temperature 1 | 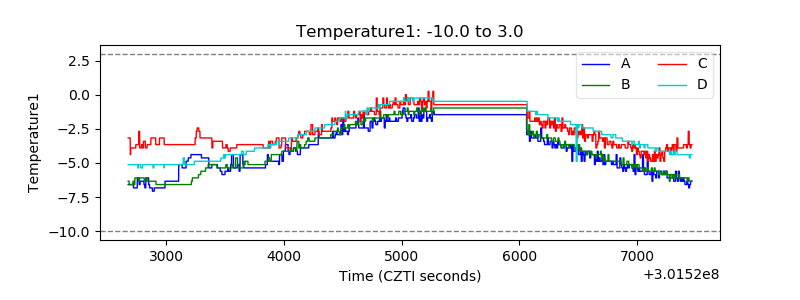 |
| Veto HV Monitor | 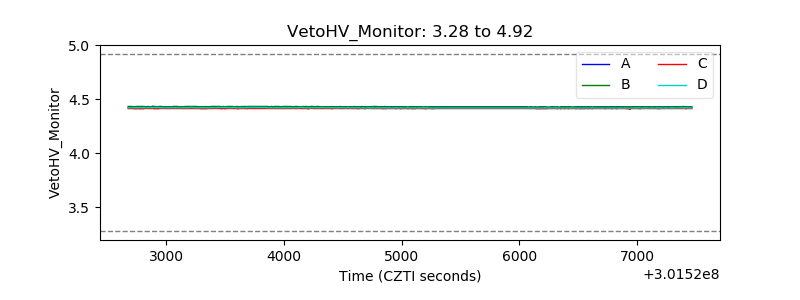 |
| Veto LLD | 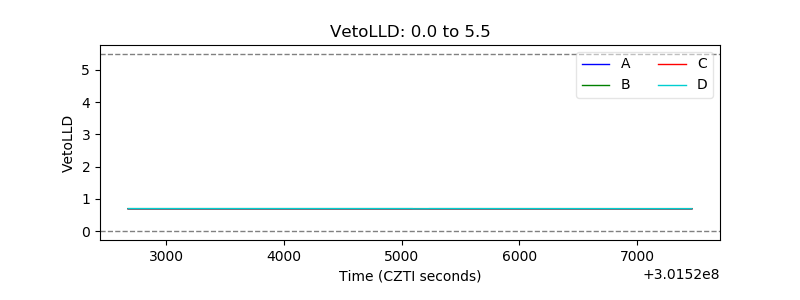 |
| Alpha Counter | 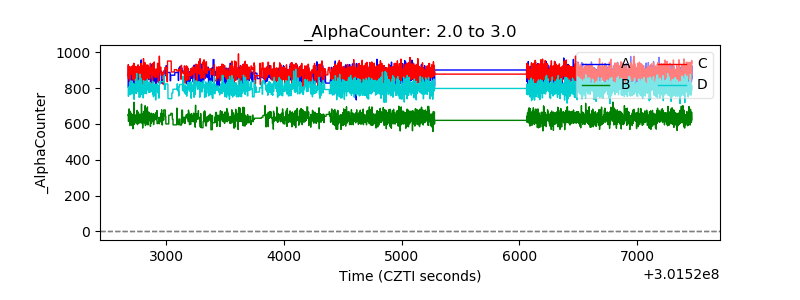 |
| _CPM_Rate | 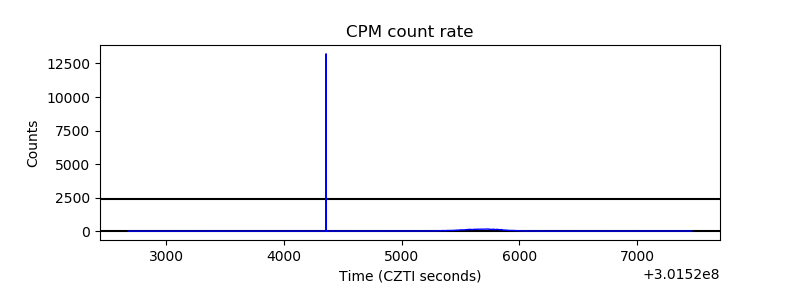 |
| CZT Counter | 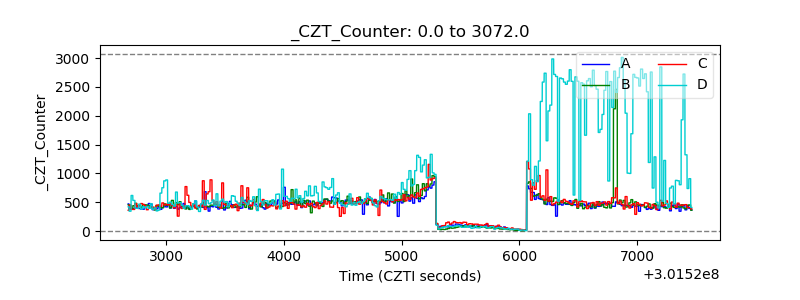 |
| +2.5 Volts monitor |  |
| +5 Volts monitor | 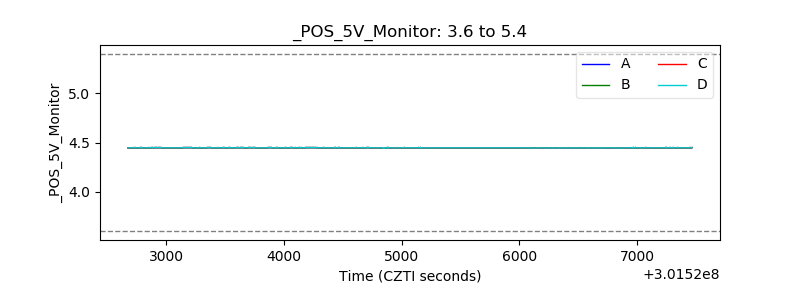 |
| _ROLL_ROT | 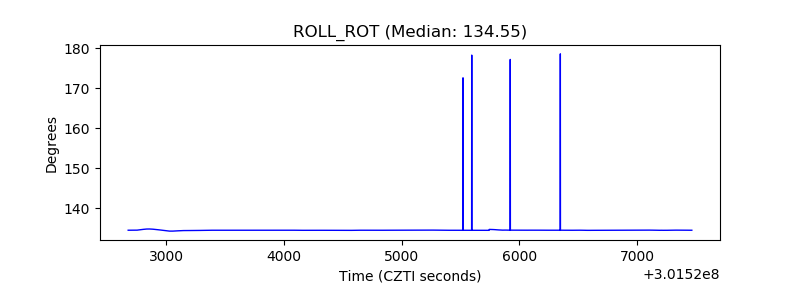 |
| _Roll_DEC | 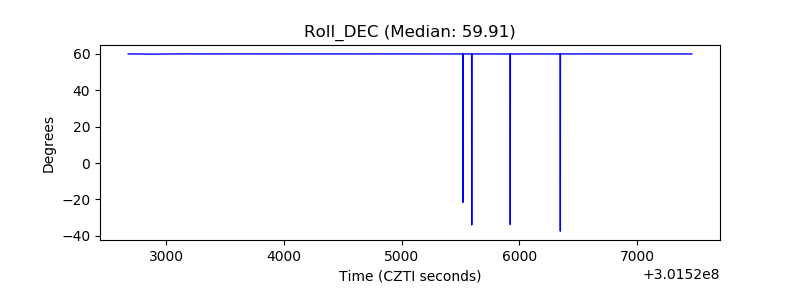 |
| _Roll_RA | 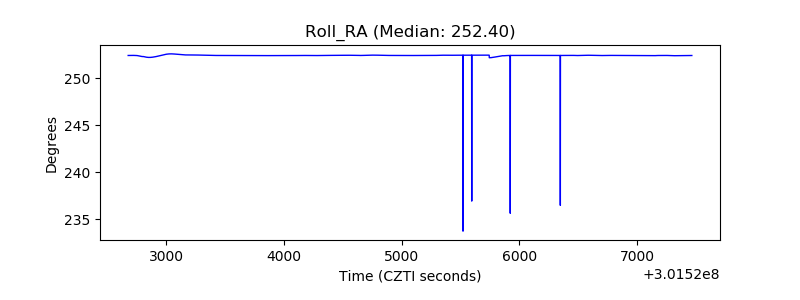 |
| Veto Counter | 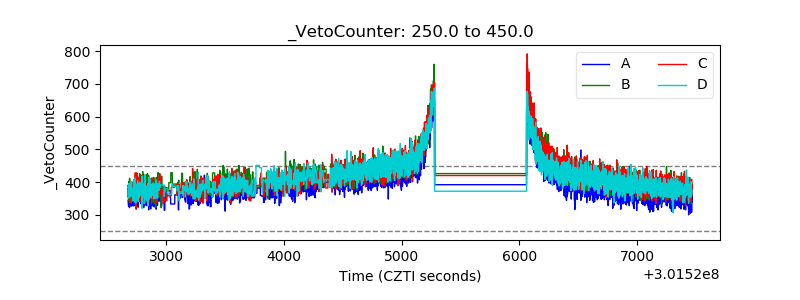 |