| Param | Original file | Final file |
|---|---|---|
| Filename | modeM0/AS1A05_007T06_9000003050_20629cztM0_level2.evt | modeM0/AS1A05_007T06_9000003050_20629cztM0_level2_quad_clean.evt |
| Size (bytes) | 347,135,040 | 48,265,920 |
| Size | 331.1 MB | 46.0 MB |
| Events in quadrant A | 1,911,127 | 322,866 |
| Events in quadrant B | 2,018,240 | 322,003 |
| Events in quadrant C | 2,081,753 | 307,403 |
| Events in quadrant D | 4,228,621 | 225,779 |
| Mode SS | |||
|---|---|---|---|
| Quadrant | BADHDUFLAG | Total packets | Discarded packets |
| A | 0 | 82 | 0 |
| B | 0 | 82 | 0 |
| C | 0 | 82 | 0 |
| D | 0 | 82 | 0 |
| Mode M9 | |||
|---|---|---|---|
| Quadrant | BADHDUFLAG | Total packets | Discarded packets |
| A | 0 | 8 | 0 |
| B | 0 | 8 | 0 |
| C | 0 | 8 | 0 |
| D | 0 | 8 | 0 |
| Mode M0 | |||
|---|---|---|---|
| Quadrant | BADHDUFLAG | Total packets | Discarded packets |
| A | 0 | 8291 | 1 |
| B | 0 | 8548 | 1 |
| C | 0 | 8711 | 1 |
| D | 0 | 15286 | 1 |
| Quadrant | Total seconds | Saturated seconds | Saturation percentage |
|---|---|---|---|
| A | 4008 | 30 | 0.748503% |
| B | 4008 | 67 | 1.671657% |
| C | 4008 | 95 | 2.370259% |
| D | 4008 | 864 | 21.556886% |
Noise dominated data is calculated using 1-second bins in cleaned event files. If a bin has >2000 counts, and if more than 50% of those come from <1% of pixels, then it is considered to be noise-dominated and hence unusable.
| Quadrant | # 1 sec bins | Bins with >0 counts | Bins with >2000 counts | High rate bins dominated by noise | Noise dominated (total time) | Noise dominated (detector-on time) | Marked lightcurve |
|---|---|---|---|---|---|---|---|
| A | 4788 | 4009 | 0 | 0 | 0.00% | 0.00% | 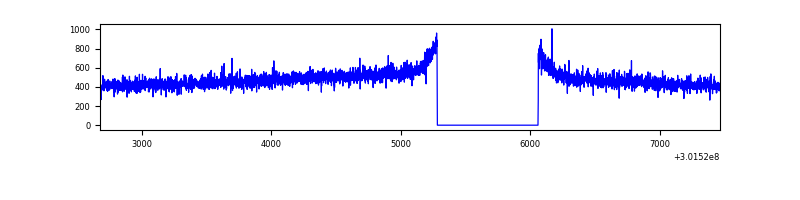 |
| B | 4788 | 4009 | 7 | 7 | 0.15% | 0.17% | 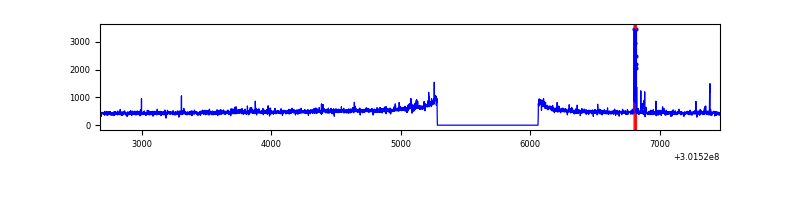 |
| C | 4788 | 4009 | 0 | 0 | 0.00% | 0.00% | 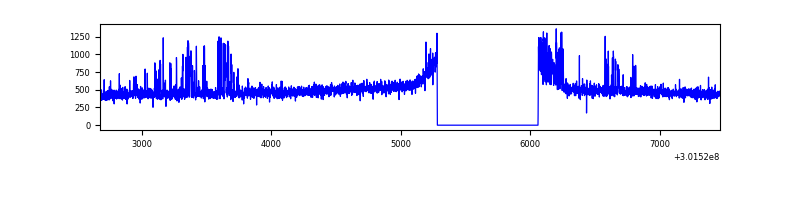 |
| D | 4788 | 4009 | 698 | 698 | 14.58% | 17.41% | 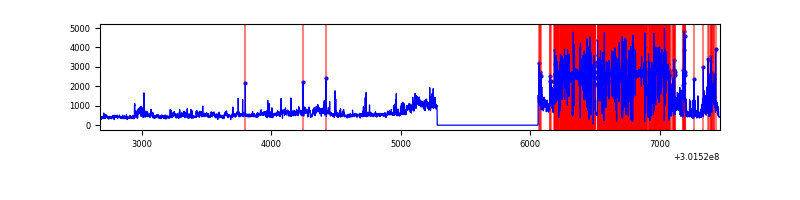 |
Top three noisy pixels from each quadrant. If the there are fewer than three noisy pixels in the level2.evt file, extra rows are filled as -1
| Pixel properties | Quadrant properties | ||||||
|---|---|---|---|---|---|---|---|
| Quadrant | DetID | PixID | Counts | Sigma | Mean | Median | Sigma |
| A | 0 | 226 | 4386 | 38.76 | 495 | 483 | 100.7 |
| A | 3 | 137 | 4152 | 36.44 | 495 | 483 | 100.7 |
| A | 12 | 194 | 3765 | 32.59 | 495 | 483 | 100.7 |
| B | 7 | 220 | 32928 | 342.81 | 492 | 479 | 94.7 |
| B | 0 | 197 | 15470 | 158.37 | 492 | 479 | 94.7 |
| B | 12 | 111 | 11027 | 111.43 | 492 | 479 | 94.7 |
| C | 8 | 208 | 150015 | 1341.41 | 474 | 475 | 111.5 |
| C | 14 | 238 | 75305 | 671.24 | 474 | 475 | 111.5 |
| C | 3 | 233 | 8587 | 72.77 | 474 | 475 | 111.5 |
| D | 1 | 52 | 2310415 | 22792.77 | 416 | 404 | 101.3 |
| D | 7 | 238 | 203181 | 2000.79 | 416 | 404 | 101.3 |
| D | 1 | 20 | 48512 | 474.68 | 416 | 404 | 101.3 |
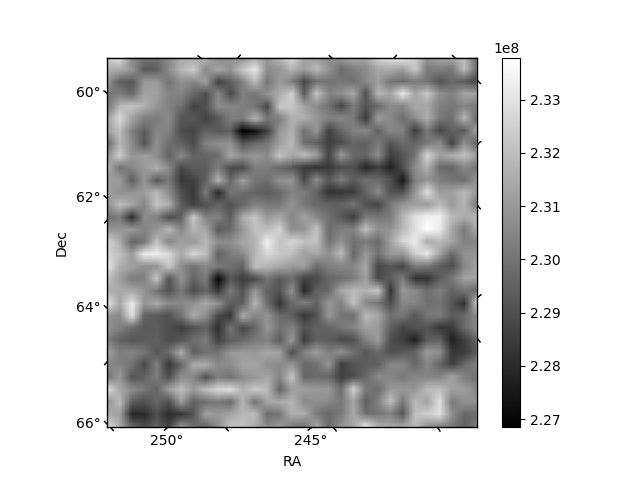
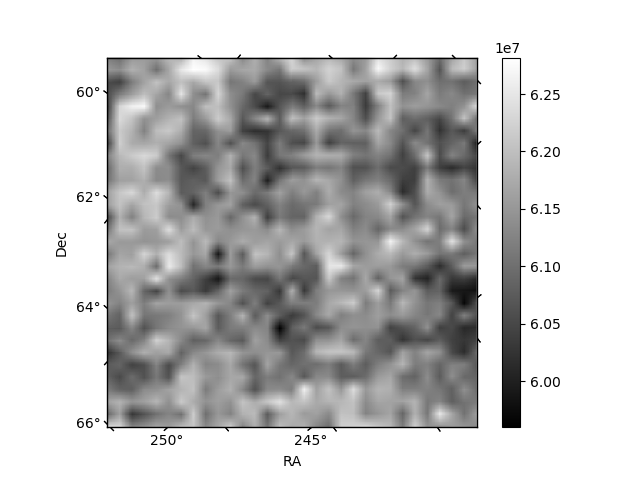
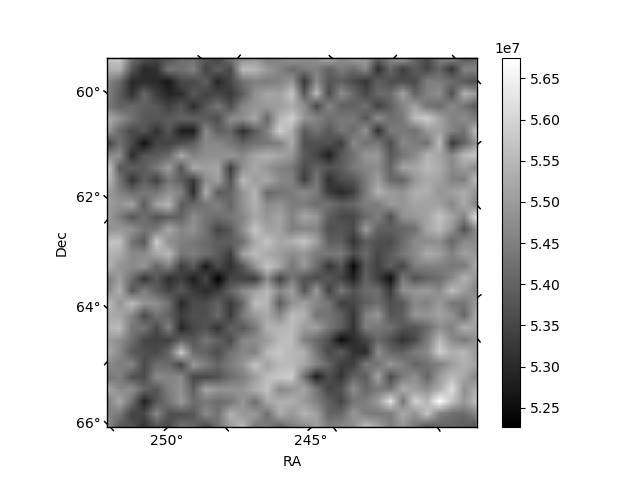
Histogram calculated using DETX and DETY for each event in the final _common_clean file
| Quadrant A | 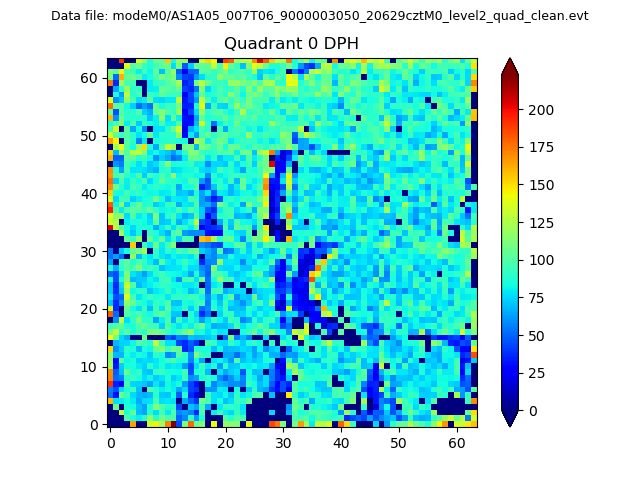 |
 |
Quadrant B |
|---|---|---|---|
| Quadrant D | 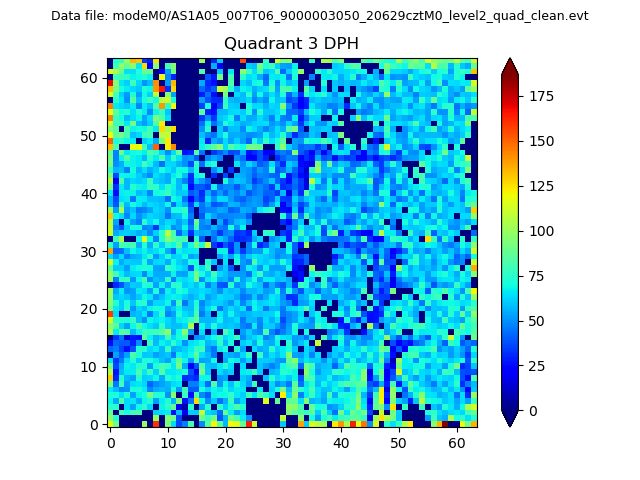 |
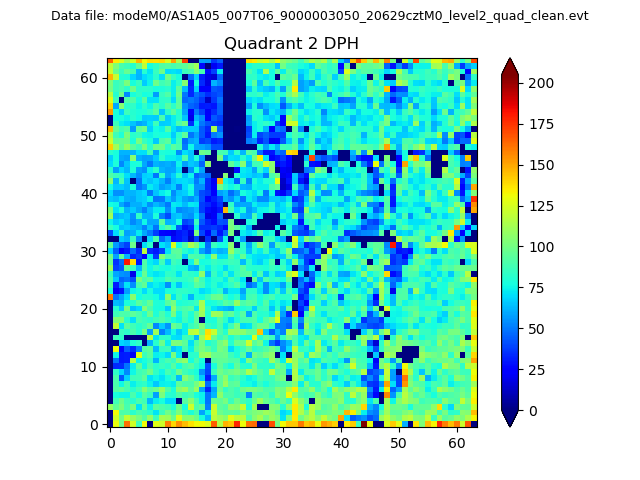 |
Quadrant C |
| Plot type | Count rate plots | Images |
|---|---|---|
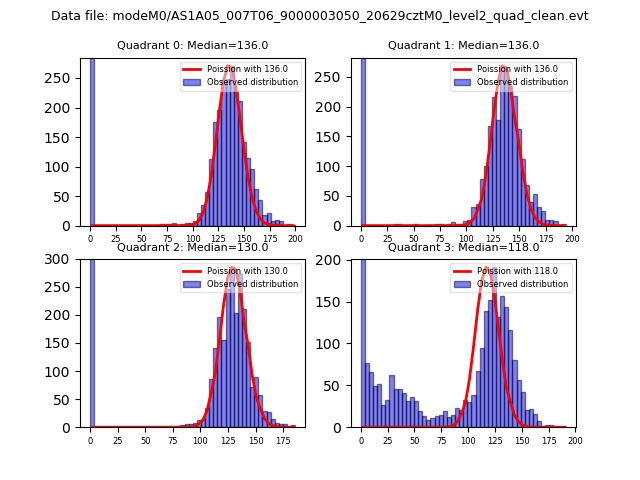
| Comparison with Poisson distribution Blue bars denote a histogram of data divided into 1 sec bins. Red curve is a Poisson curve with rate = median count rate of data. |
 |
 |
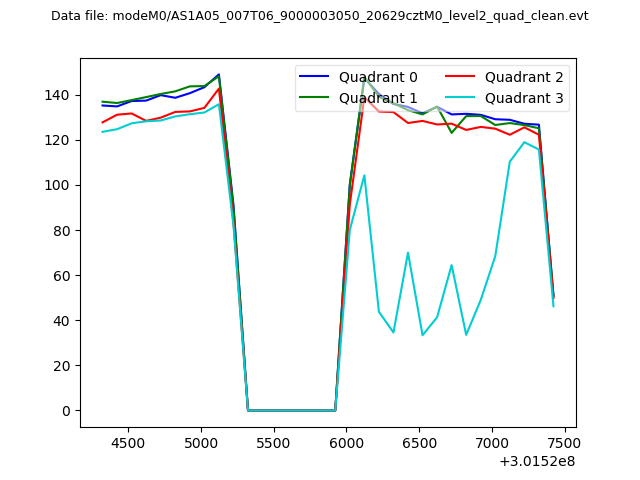
| Quadrant-wise count rates Data is divided into 100 sec bins |
 |
|
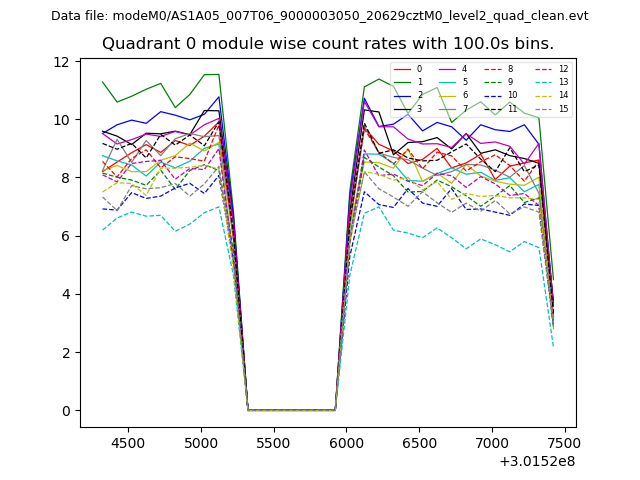
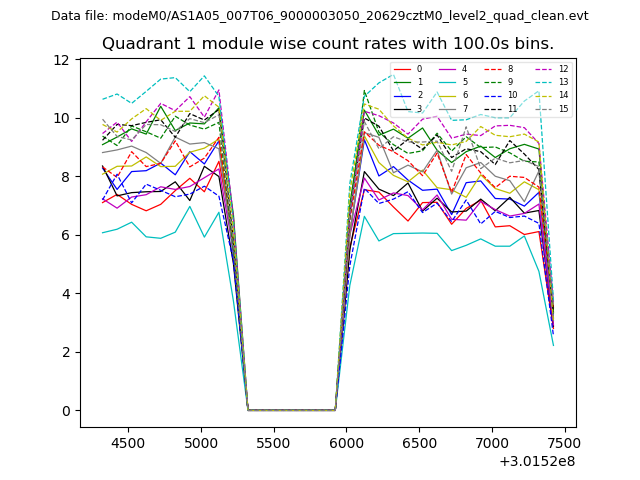
| Module-wise count rates for Quadrant A Data is divided into 100 sec bins |
 |
 |
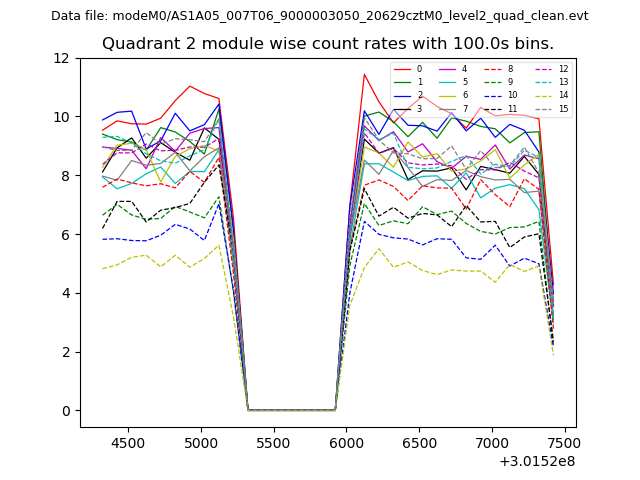
| Module-wise count rates for Quadrant B Data is divided into 100 sec bins |
 |
 |
| Module-wise count rates for Quadrant C Data is divided into 100 sec bins |
 |
 |
| Module-wise count rates for Quadrant D Data is divided into 100 sec bins |
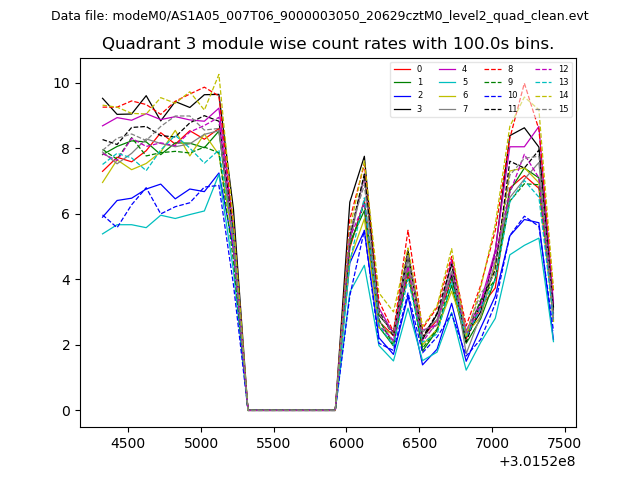 |
 |
| Parameter | Plot |
|---|---|
| CZT HV Monitor | 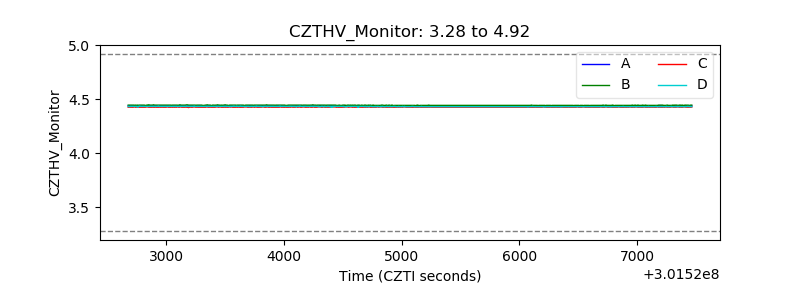 |
| D_VDD | 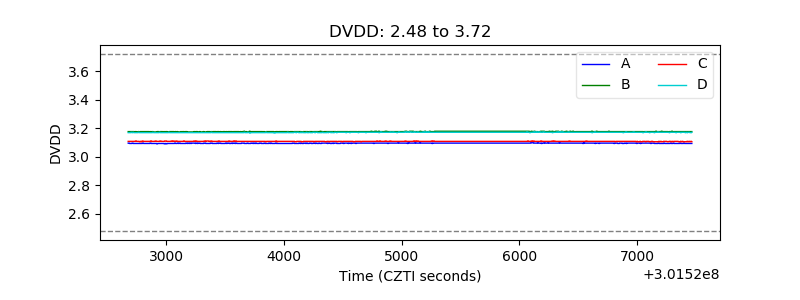 |
| Temperature 1 |  |
| Veto HV Monitor | 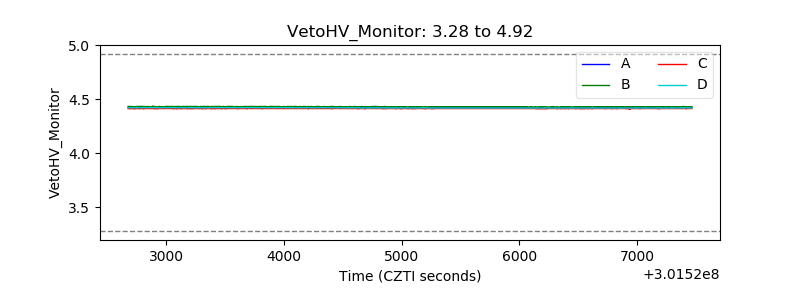 |
| Veto LLD |  |
| Alpha Counter | 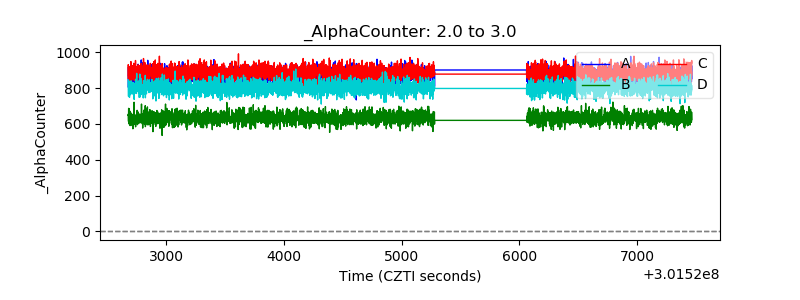 |
| _CPM_Rate | 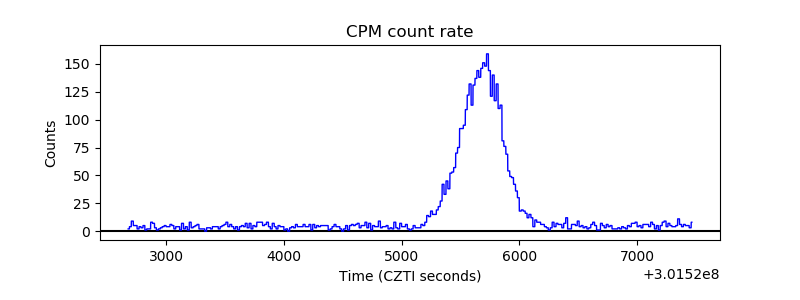 |
| CZT Counter | 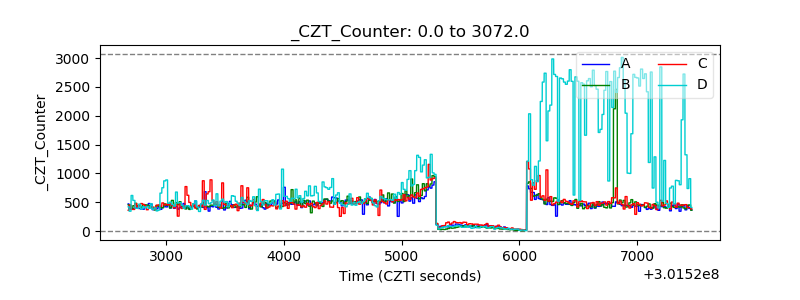 |
| +2.5 Volts monitor | 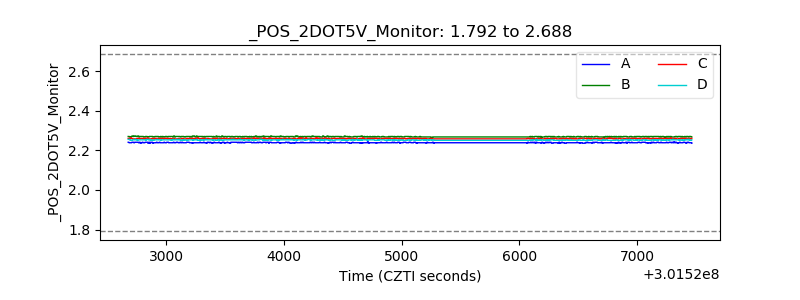 |
| +5 Volts monitor |  |
| _ROLL_ROT | 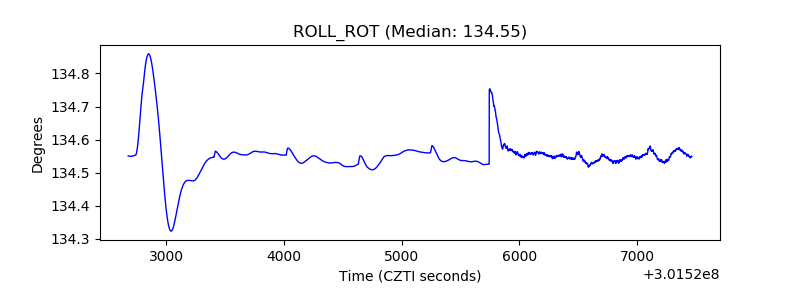 |
| _Roll_DEC | 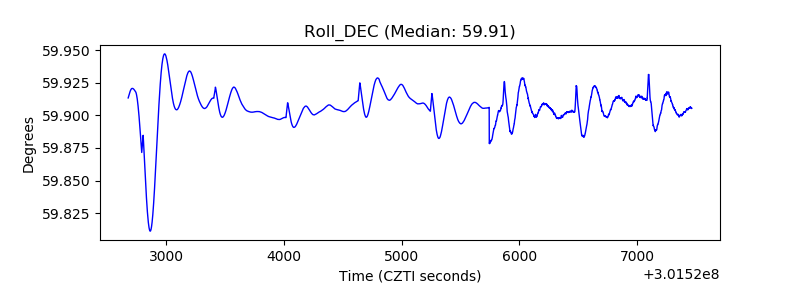 |
| _Roll_RA |  |
| Veto Counter | 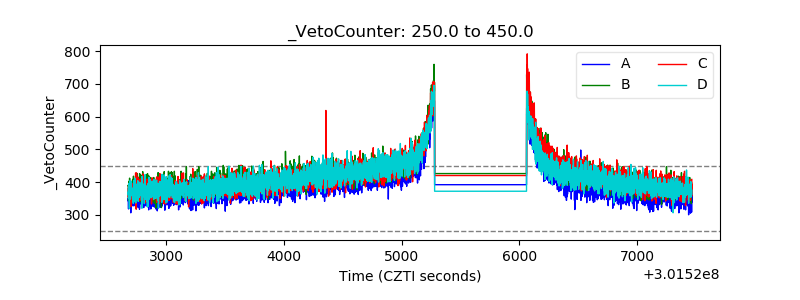 |