| Param | Original file | Final file |
|---|---|---|
| Filename | modeM0/AS1A05_007T06_9000003050_20630cztM0_level2.evt | modeM0/AS1A05_007T06_9000003050_20630cztM0_level2_quad_clean.evt |
| Size (bytes) | 650,949,120 | 105,439,680 |
| Size | 620.8 MB | 100.6 MB |
| Events in quadrant A | 3,421,237 | 721,077 |
| Events in quadrant B | 3,495,695 | 713,861 |
| Events in quadrant C | 3,639,215 | 689,729 |
| Events in quadrant D | 8,664,974 | 561,522 |
| Mode SS | |||
|---|---|---|---|
| Quadrant | BADHDUFLAG | Total packets | Discarded packets |
| A | 0 | 148 | 0 |
| B | 0 | 148 | 0 |
| C | 0 | 148 | 0 |
| D | 0 | 148 | 0 |
| Mode M9 | |||
|---|---|---|---|
| Quadrant | BADHDUFLAG | Total packets | Discarded packets |
| A | 0 | 5 | 0 |
| B | 0 | 6 | 0 |
| C | 0 | 6 | 0 |
| D | 0 | 6 | 0 |
| Mode M0 | |||
|---|---|---|---|
| Quadrant | BADHDUFLAG | Total packets | Discarded packets |
| A | 0 | 15123 | 3 |
| B | 0 | 15352 | 3 |
| C | 0 | 15745 | 3 |
| D | 0 | 30816 | 3 |
| Quadrant | Total seconds | Saturated seconds | Saturation percentage |
|---|---|---|---|
| A | 7270 | 35 | 0.481431% |
| B | 7270 | 79 | 1.086657% |
| C | 7270 | 116 | 1.595598% |
| D | 7270 | 1846 | 25.392022% |
Noise dominated data is calculated using 1-second bins in cleaned event files. If a bin has >2000 counts, and if more than 50% of those come from <1% of pixels, then it is considered to be noise-dominated and hence unusable.
| Quadrant | # 1 sec bins | Bins with >0 counts | Bins with >2000 counts | High rate bins dominated by noise | Noise dominated (total time) | Noise dominated (detector-on time) | Marked lightcurve |
|---|---|---|---|---|---|---|---|
| A | 7715 | 7272 | 4 | 4 | 0.05% | 0.06% | 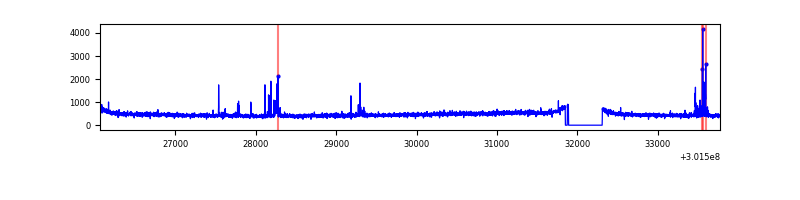 |
| B | 7715 | 7272 | 11 | 11 | 0.14% | 0.15% | 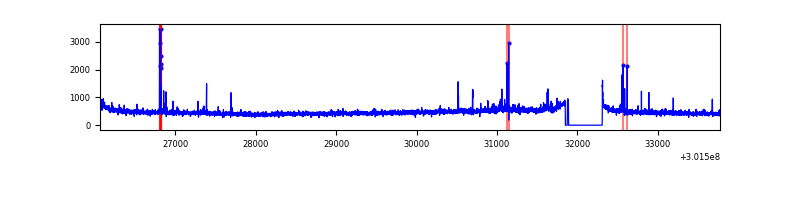 |
| C | 7715 | 7272 | 0 | 0 | 0.00% | 0.00% |  |
| D | 7715 | 7272 | 1379 | 1379 | 17.87% | 18.96% | 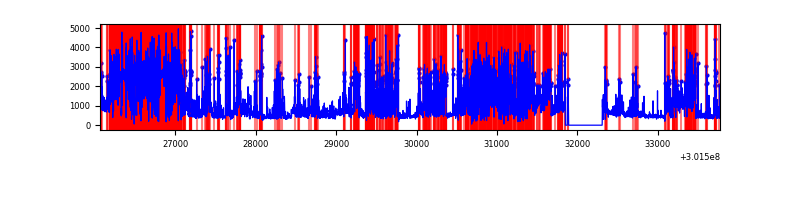 |
Top three noisy pixels from each quadrant. If the there are fewer than three noisy pixels in the level2.evt file, extra rows are filled as -1
| Pixel properties | Quadrant properties | ||||||
|---|---|---|---|---|---|---|---|
| Quadrant | DetID | PixID | Counts | Sigma | Mean | Median | Sigma |
| A | 5 | 16 | 107600 | 618.24 | 860 | 840 | 172.7 |
| A | 0 | 226 | 7524 | 38.71 | 860 | 840 | 172.7 |
| A | 12 | 194 | 6839 | 34.74 | 860 | 840 | 172.7 |
| B | 7 | 220 | 37940 | 228.96 | 855 | 831 | 162.1 |
| B | 0 | 190 | 25957 | 155.03 | 855 | 831 | 162.1 |
| B | 12 | 111 | 19011 | 112.17 | 855 | 831 | 162.1 |
| C | 8 | 208 | 252915 | 1292.01 | 831 | 835 | 195.1 |
| C | 14 | 238 | 131054 | 667.42 | 831 | 835 | 195.1 |
| C | 3 | 233 | 8347 | 38.5 | 831 | 835 | 195.1 |
| D | 1 | 52 | 5183895 | 28949.5 | 731 | 708 | 179.0 |
| D | 1 | 20 | 421949 | 2352.75 | 731 | 708 | 179.0 |
| D | 13 | 153 | 120603 | 669.65 | 731 | 708 | 179.0 |
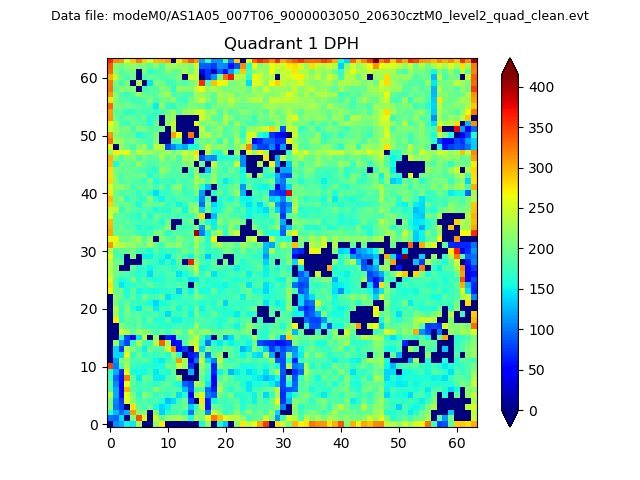
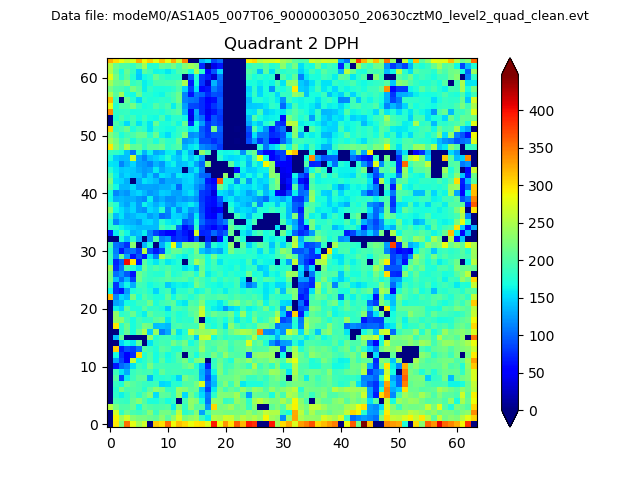
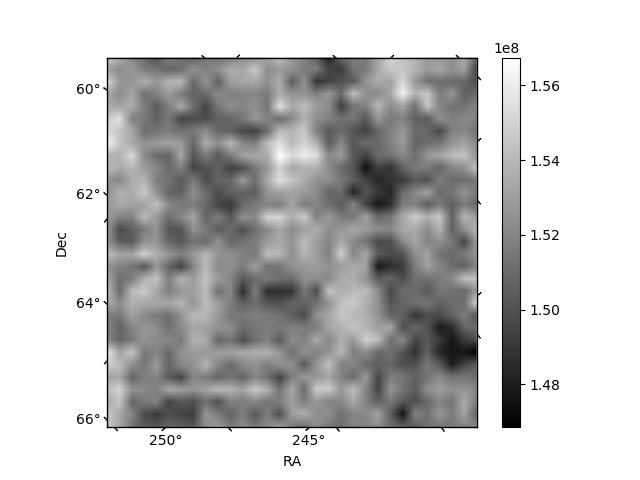
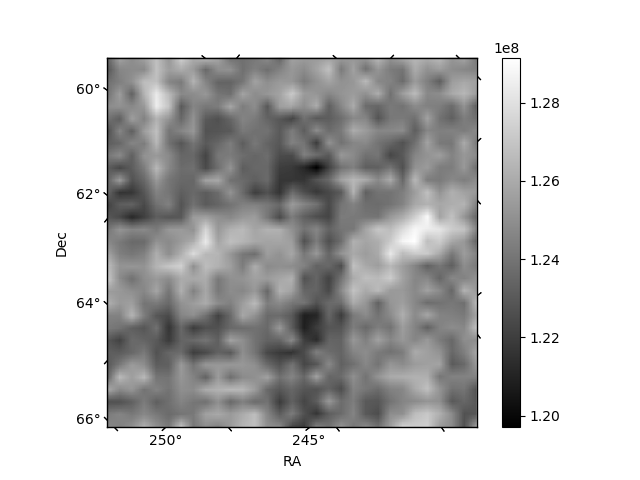
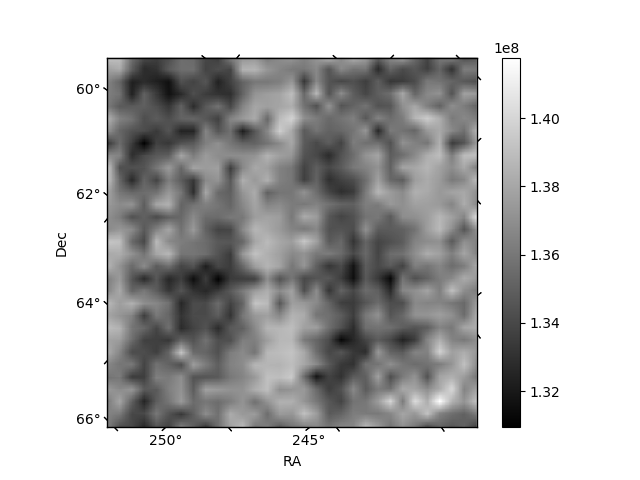
Histogram calculated using DETX and DETY for each event in the final _common_clean file
| Quadrant A |  |
 |
Quadrant B |
|---|---|---|---|
| Quadrant D | 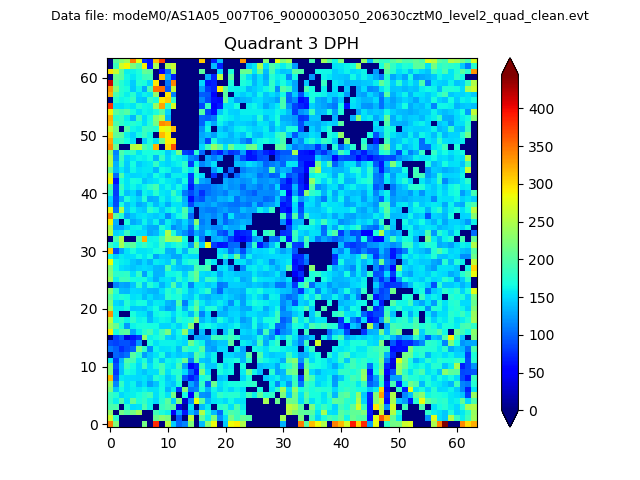 |
 |
Quadrant C |
| Plot type | Count rate plots | Images |
|---|---|---|
| Comparison with Poisson distribution Blue bars denote a histogram of data divided into 1 sec bins. Red curve is a Poisson curve with rate = median count rate of data. |
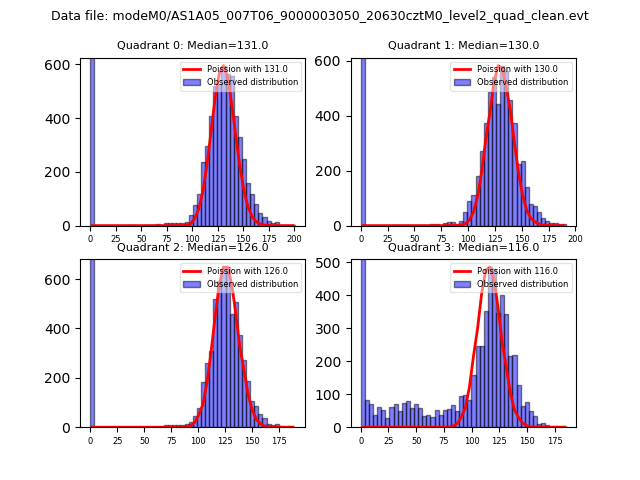 |
 |
| Quadrant-wise count rates Data is divided into 100 sec bins |
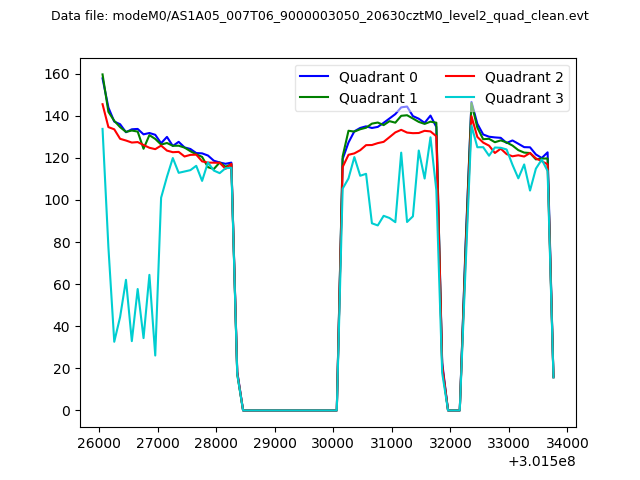 |
|
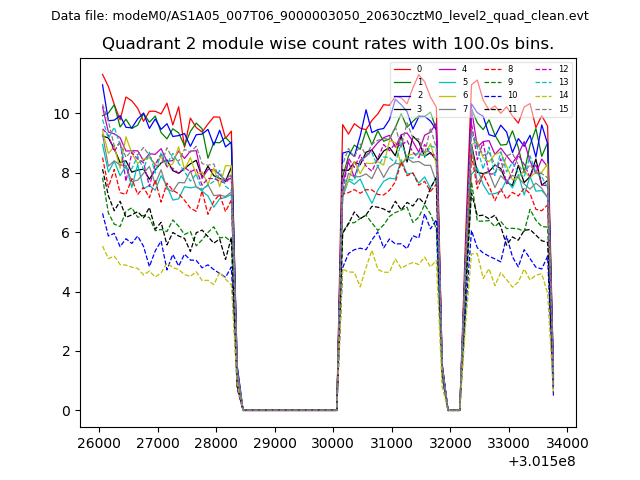
| Module-wise count rates for Quadrant A Data is divided into 100 sec bins |
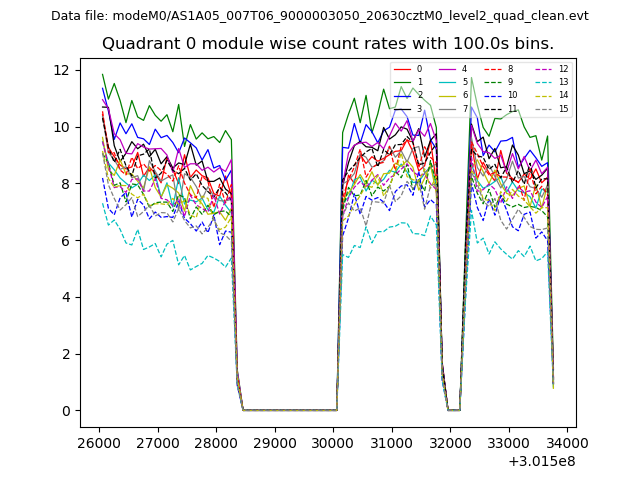 |
 |
| Module-wise count rates for Quadrant B Data is divided into 100 sec bins |
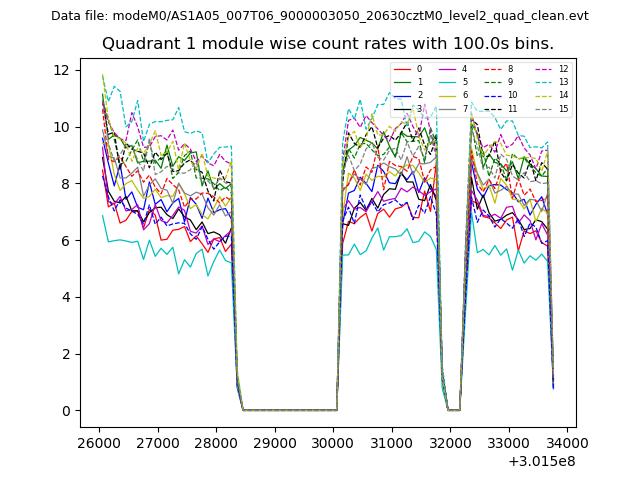 |
 |
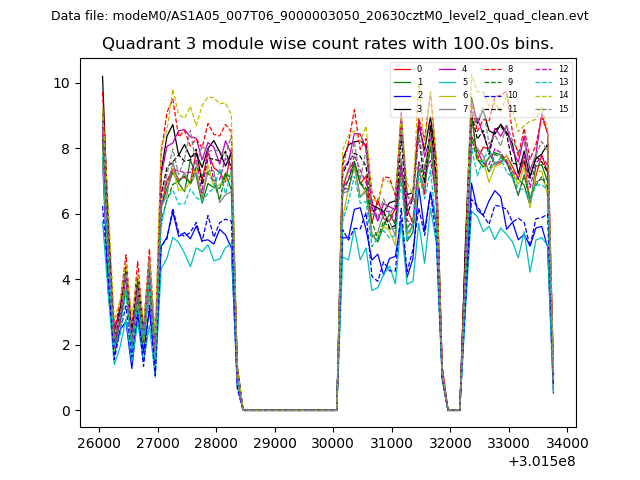
| Module-wise count rates for Quadrant C Data is divided into 100 sec bins |
 |
 |
| Module-wise count rates for Quadrant D Data is divided into 100 sec bins |
 |
 |
| Parameter | Plot |
|---|---|
| CZT HV Monitor | 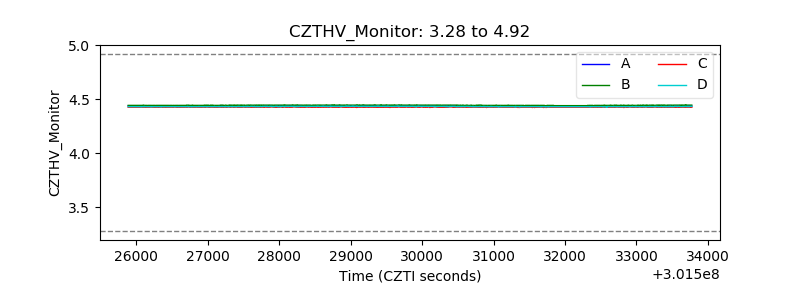 |
| D_VDD | 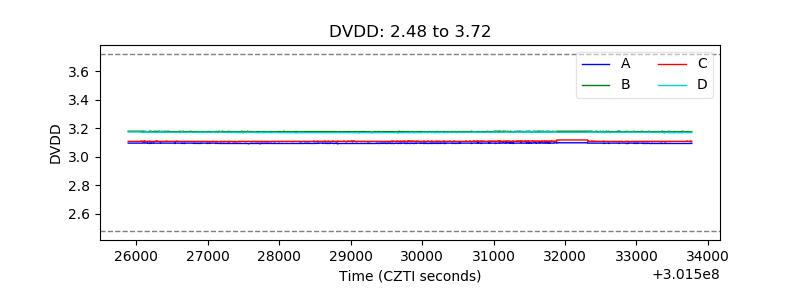 |
| Temperature 1 | 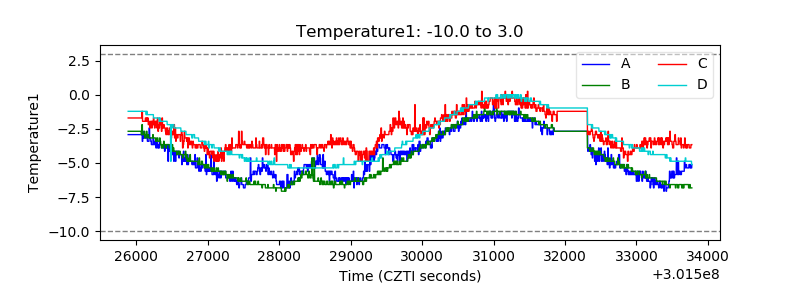 |
| Veto HV Monitor | 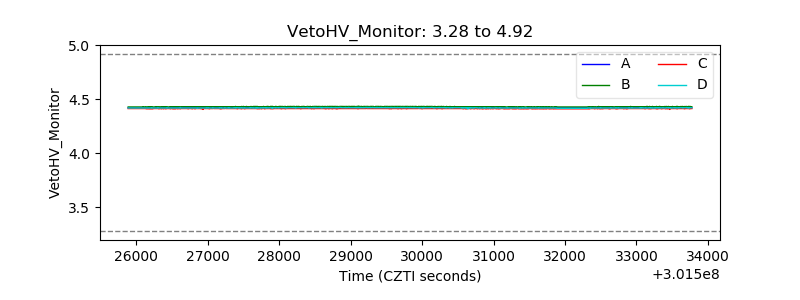 |
| Veto LLD | 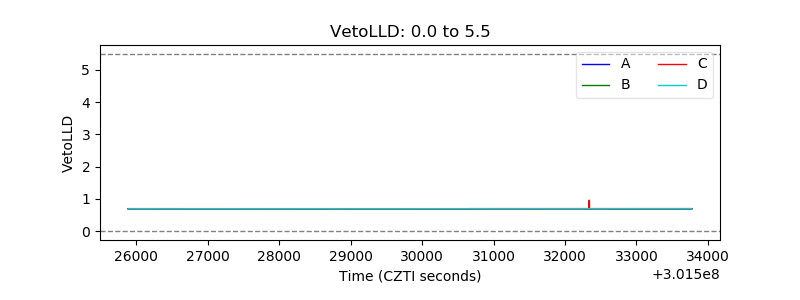 |
| Alpha Counter | 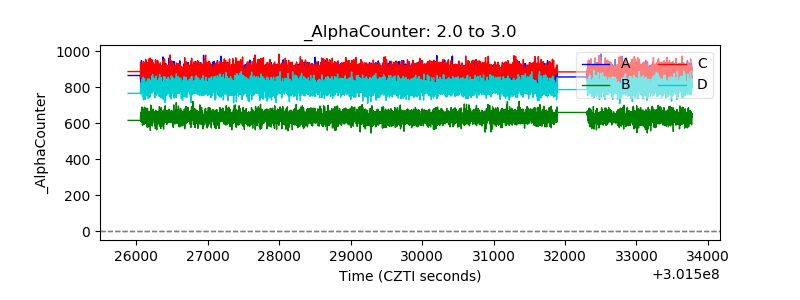 |
| _CPM_Rate | 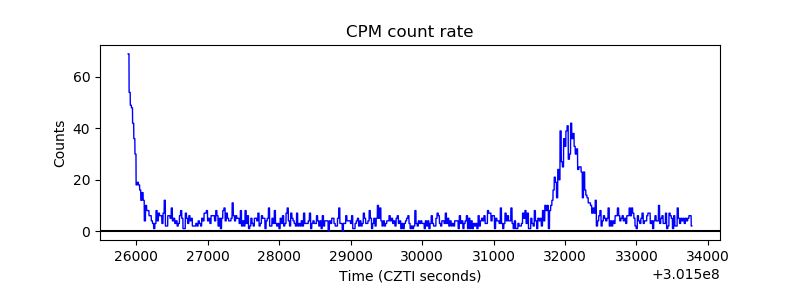 |
| CZT Counter | 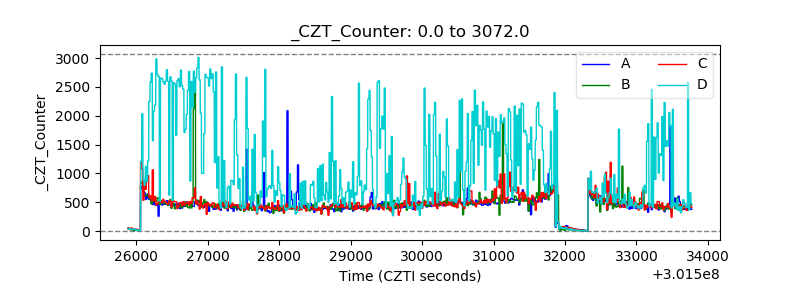 |
| +2.5 Volts monitor | 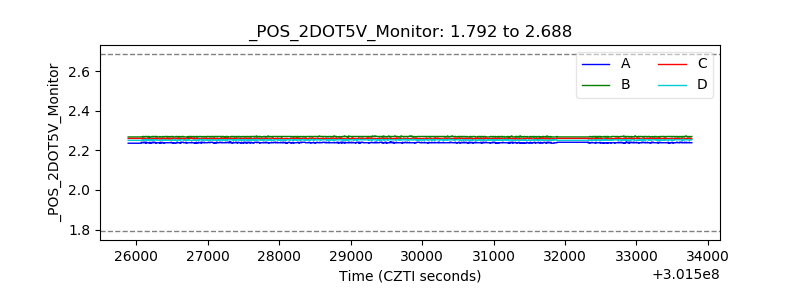 |
| +5 Volts monitor |  |
| _ROLL_ROT | 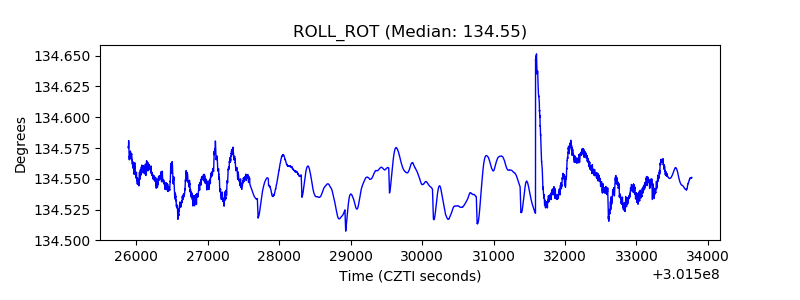 |
| _Roll_DEC | 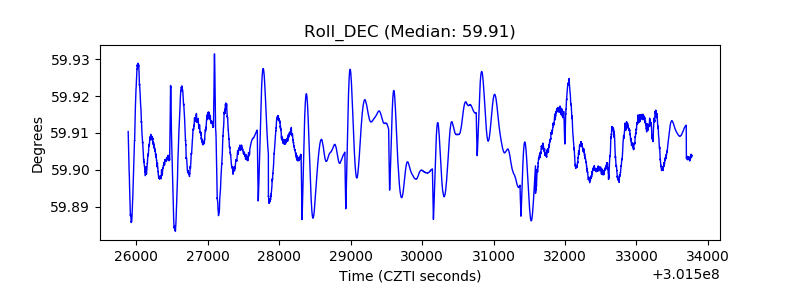 |
| _Roll_RA | 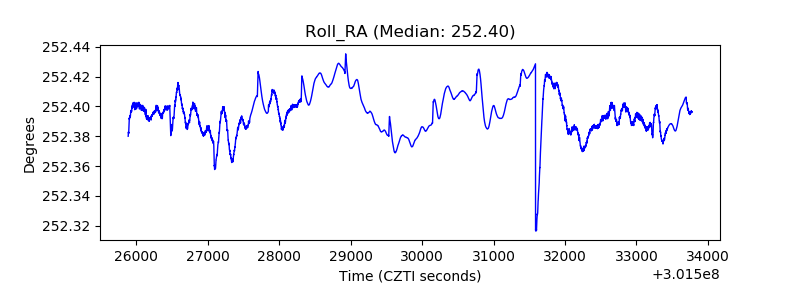 |
| Veto Counter | 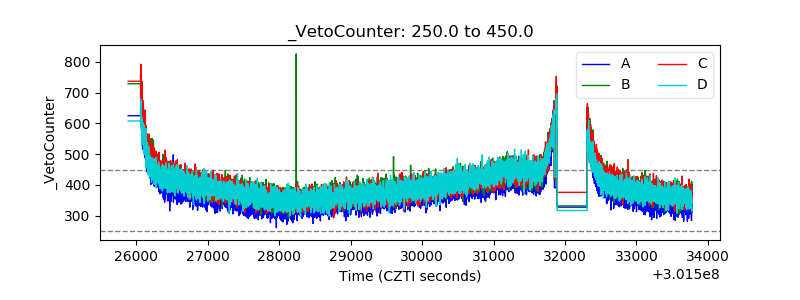 |