| Param | Original file | Final file |
|---|---|---|
| Filename | modeM0/AS1A05_007T06_9000003050_20631cztM0_level2.evt | modeM0/AS1A05_007T06_9000003050_20631cztM0_level2_quad_clean.evt |
| Size (bytes) | 586,716,480 | 114,215,040 |
| Size | 559.5 MB | 108.9 MB |
| Events in quadrant A | 3,576,917 | 754,024 |
| Events in quadrant B | 3,907,980 | 748,324 |
| Events in quadrant C | 3,831,894 | 729,449 |
| Events in quadrant D | 5,932,084 | 693,876 |
| Mode SS | |||
|---|---|---|---|
| Quadrant | BADHDUFLAG | Total packets | Discarded packets |
| A | 0 | 160 | 4 |
| B | 0 | 160 | 2 |
| C | 0 | 160 | 4 |
| D | 0 | 160 | 0 |
| Mode M9 | |||
|---|---|---|---|
| Quadrant | BADHDUFLAG | Total packets | Discarded packets |
| A | 0 | 8 | 0 |
| B | 0 | 8 | 0 |
| C | 0 | 8 | 0 |
| D | 0 | 8 | 0 |
| Mode M0 | |||
|---|---|---|---|
| Quadrant | BADHDUFLAG | Total packets | Discarded packets |
| A | 0 | 16342 | 403 |
| B | 0 | 17188 | 228 |
| C | 0 | 16747 | 220 |
| D | 0 | 23264 | 277 |
| Quadrant | Total seconds | Saturated seconds | Saturation percentage |
|---|---|---|---|
| A | 7652 | 47 | 0.614219% |
| B | 7669 | 87 | 1.134437% |
| C | 7670 | 116 | 1.512386% |
| D | 7667 | 620 | 8.086605% |
Noise dominated data is calculated using 1-second bins in cleaned event files. If a bin has >2000 counts, and if more than 50% of those come from <1% of pixels, then it is considered to be noise-dominated and hence unusable.
| Quadrant | # 1 sec bins | Bins with >0 counts | Bins with >2000 counts | High rate bins dominated by noise | Noise dominated (total time) | Noise dominated (detector-on time) | Marked lightcurve |
|---|---|---|---|---|---|---|---|
| A | 8581 | 7708 | 4 | 4 | 0.05% | 0.05% | 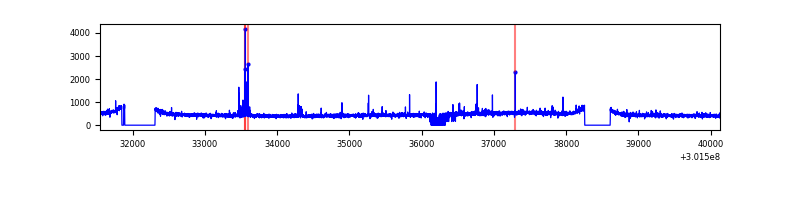 |
| B | 8581 | 7726 | 10 | 10 | 0.12% | 0.13% | 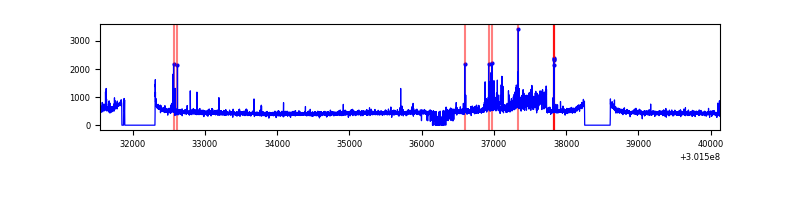 |
| C | 8580 | 7739 | 1 | 1 | 0.01% | 0.01% | 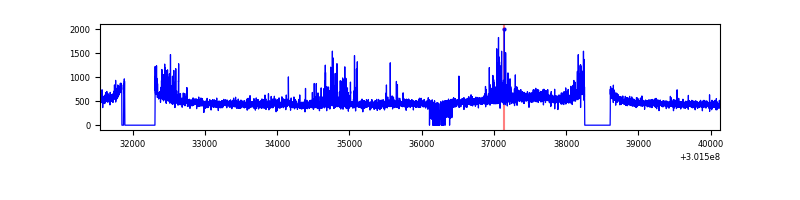 |
| D | 8580 | 7736 | 470 | 470 | 5.48% | 6.08% | 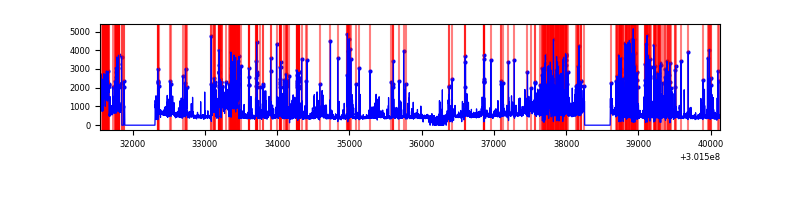 |
Top three noisy pixels from each quadrant. If the there are fewer than three noisy pixels in the level2.evt file, extra rows are filled as -1
| Pixel properties | Quadrant properties | ||||||
|---|---|---|---|---|---|---|---|
| Quadrant | DetID | PixID | Counts | Sigma | Mean | Median | Sigma |
| A | 5 | 16 | 68042 | 366.16 | 907 | 885 | 183.4 |
| A | 12 | 16 | 11981 | 60.5 | 907 | 885 | 183.4 |
| A | 12 | 194 | 8569 | 41.9 | 907 | 885 | 183.4 |
| B | 4 | 216 | 153498 | 880.35 | 906 | 881 | 173.4 |
| B | 7 | 220 | 75853 | 432.47 | 906 | 881 | 173.4 |
| B | 0 | 190 | 27315 | 152.48 | 906 | 881 | 173.4 |
| C | 8 | 208 | 232661 | 1115.35 | 882 | 886 | 207.8 |
| C | 14 | 238 | 136030 | 650.34 | 882 | 886 | 207.8 |
| C | 3 | 233 | 15144 | 68.61 | 882 | 886 | 207.8 |
| D | 1 | 52 | 2001561 | 9485.64 | 864 | 837 | 210.9 |
| D | 1 | 20 | 429729 | 2033.42 | 864 | 837 | 210.9 |
| D | 13 | 153 | 123989 | 583.88 | 864 | 837 | 210.9 |
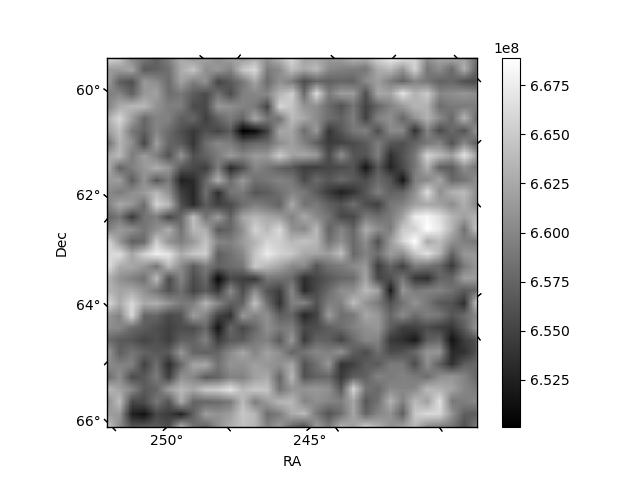
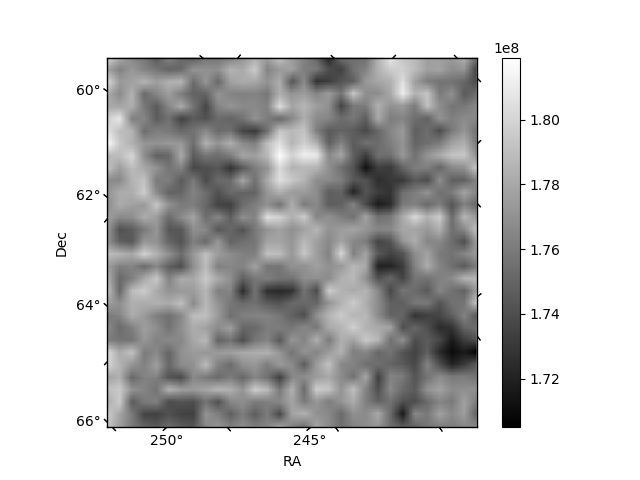
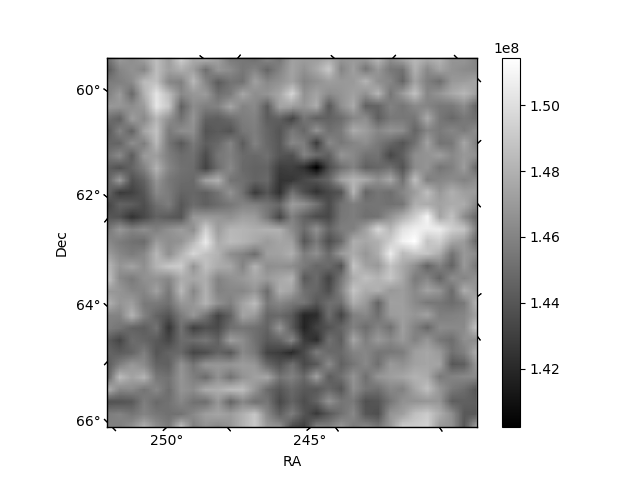
Histogram calculated using DETX and DETY for each event in the final _common_clean file
| Quadrant A | 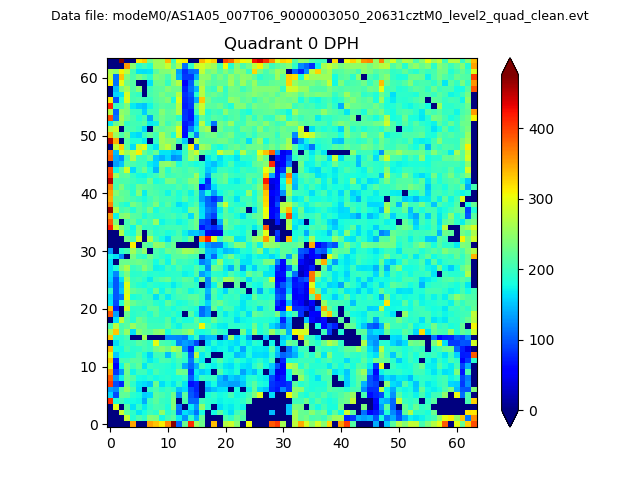 |
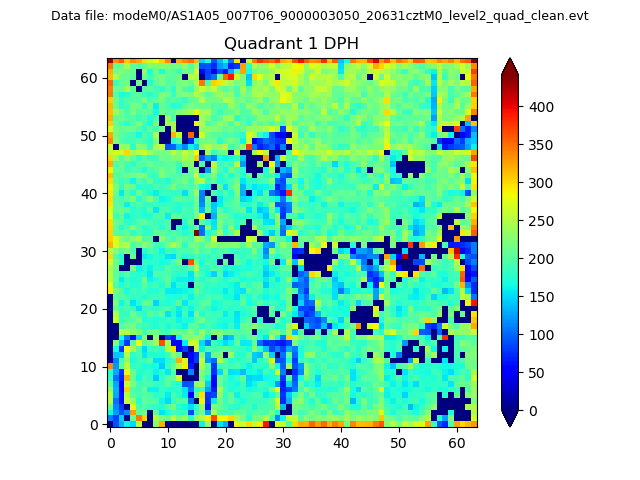 |
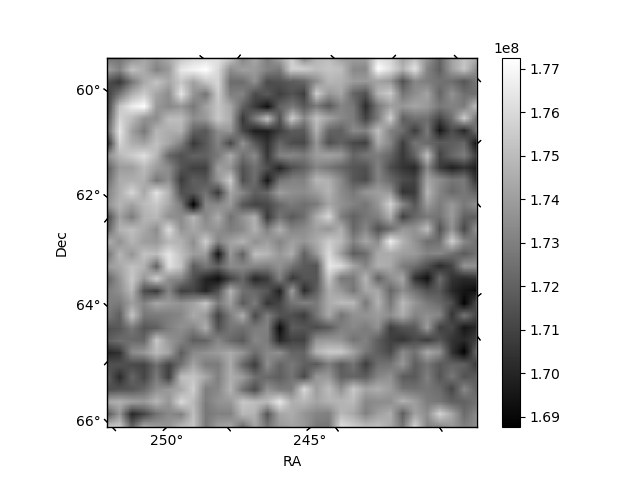
Quadrant B |
|---|---|---|---|
| Quadrant D | 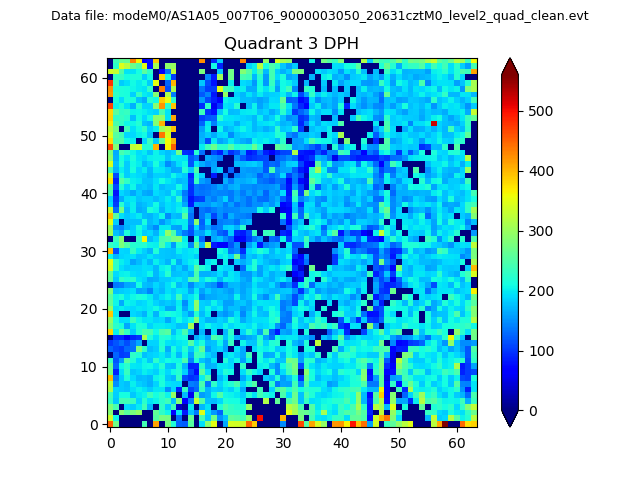 |
 |
Quadrant C |
| Plot type | Count rate plots | Images |
|---|---|---|
| Comparison with Poisson distribution Blue bars denote a histogram of data divided into 1 sec bins. Red curve is a Poisson curve with rate = median count rate of data. |
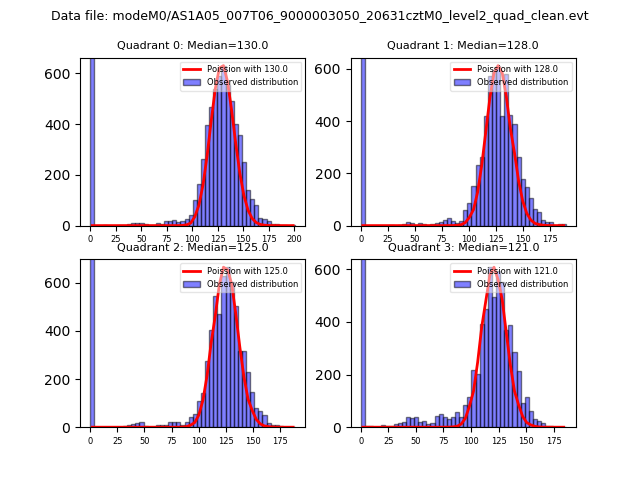 |
 |
| Quadrant-wise count rates Data is divided into 100 sec bins |
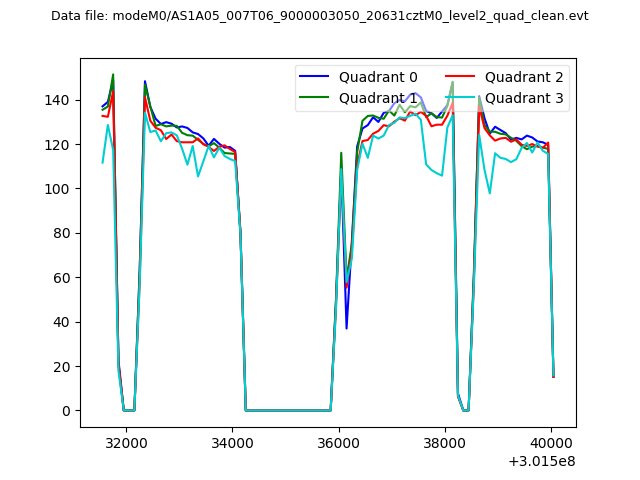 |
|
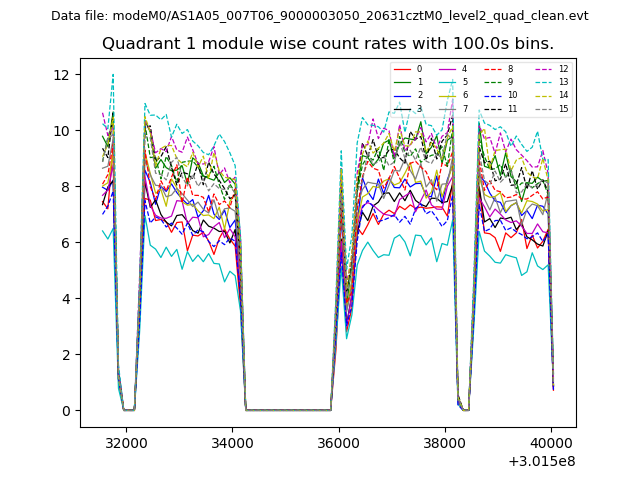
| Module-wise count rates for Quadrant A Data is divided into 100 sec bins |
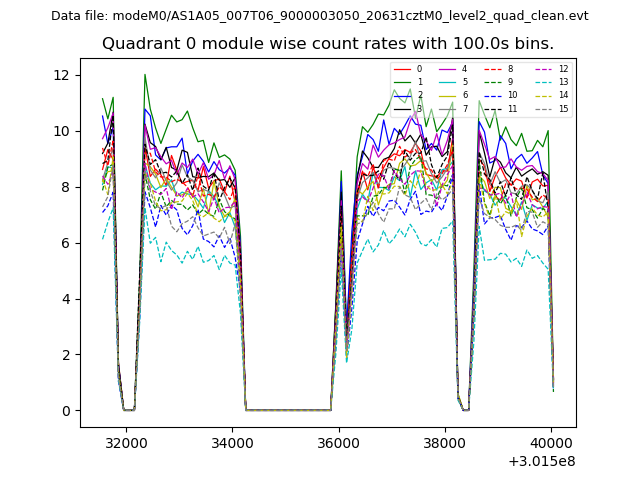 |
 |
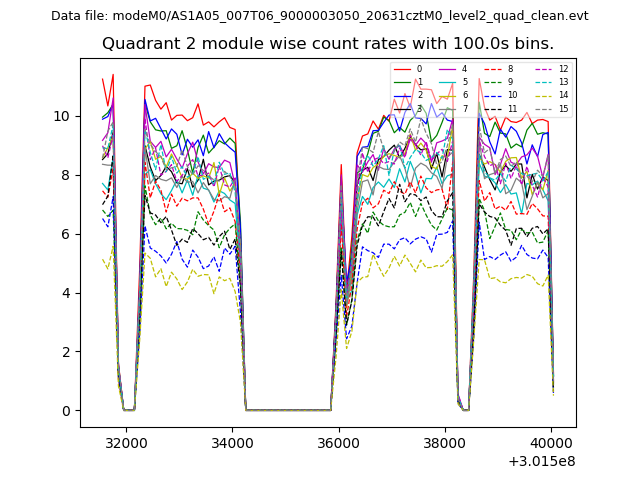
| Module-wise count rates for Quadrant B Data is divided into 100 sec bins |
 |
 |
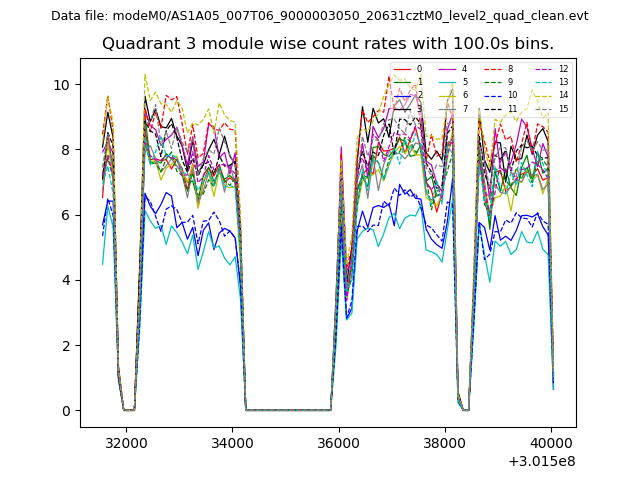
| Module-wise count rates for Quadrant C Data is divided into 100 sec bins |
 |
 |
| Module-wise count rates for Quadrant D Data is divided into 100 sec bins |
 |
 |
| Parameter | Plot |
|---|---|
| CZT HV Monitor | 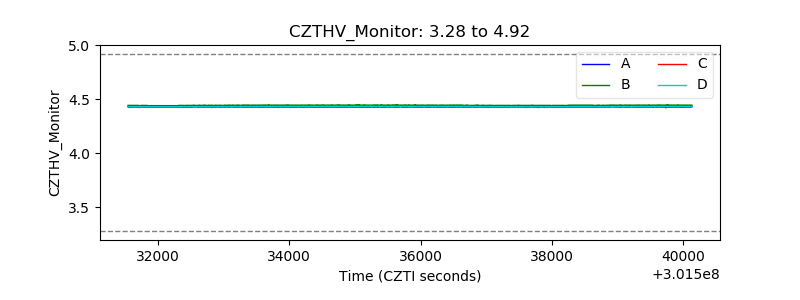 |
| D_VDD | 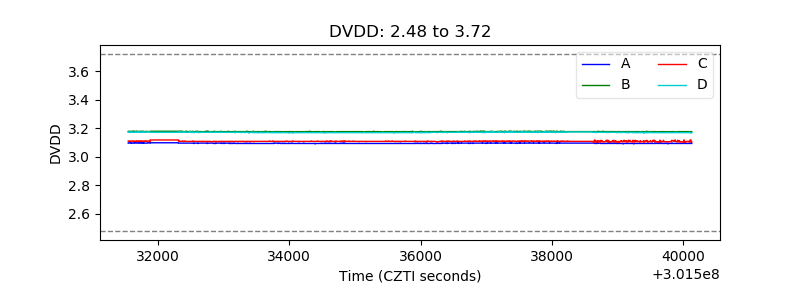 |
| Temperature 1 |  |
| Veto HV Monitor | 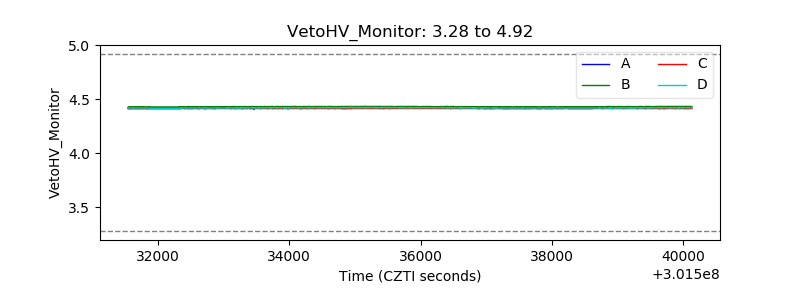 |
| Veto LLD | 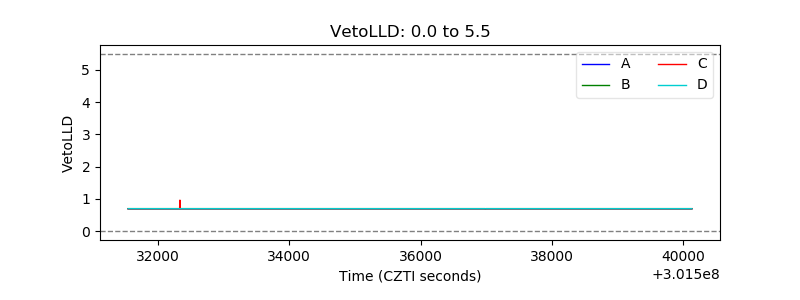 |
| Alpha Counter | 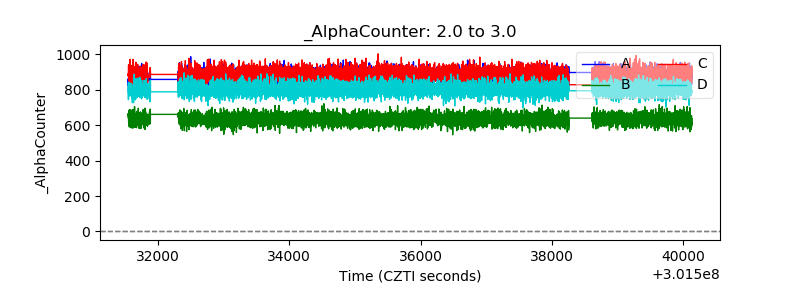 |
| _CPM_Rate | 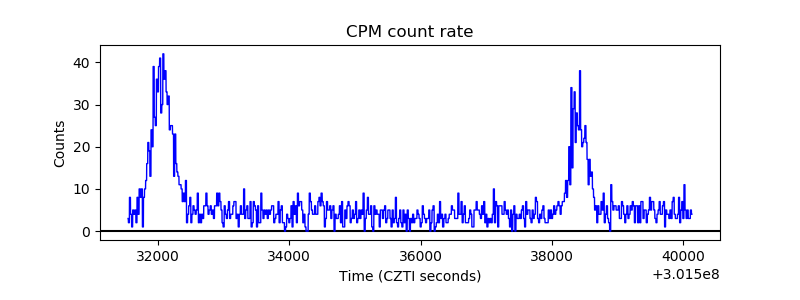 |
| CZT Counter |  |
| +2.5 Volts monitor |  |
| +5 Volts monitor |  |
| _ROLL_ROT | 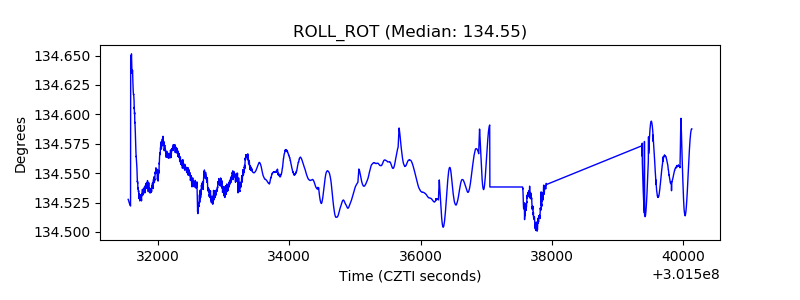 |
| _Roll_DEC | 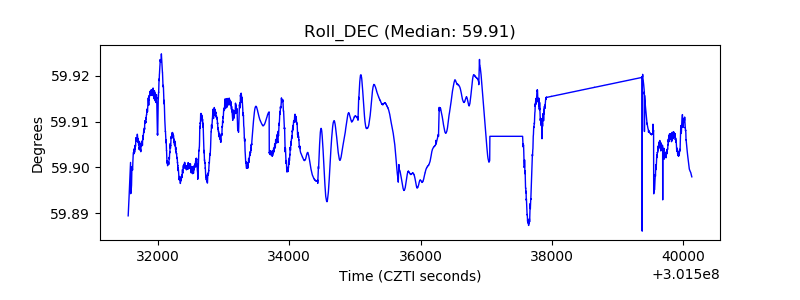 |
| _Roll_RA | 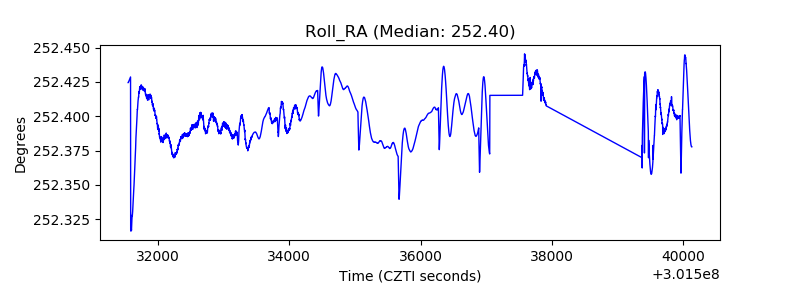 |
| Veto Counter | 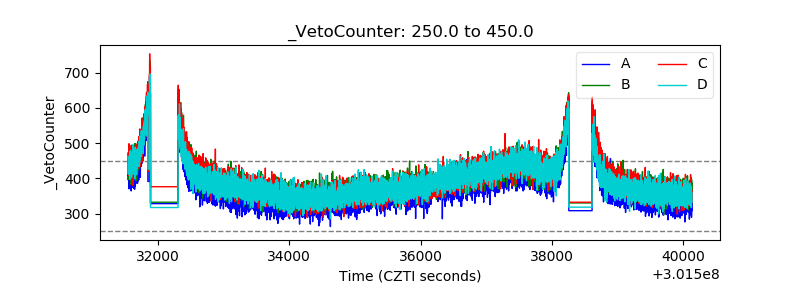 |