| Param | Original file | Final file |
|---|---|---|
| Filename | modeM0/AS1A05_007T06_9000003050_20632cztM0_level2.evt | modeM0/AS1A05_007T06_9000003050_20632cztM0_level2_quad_clean.evt |
| Size (bytes) | 95,123,520 | 14,817,600 |
| Size | 90.7 MB | 14.1 MB |
| Events in quadrant A | 629,176 | 92,246 |
| Events in quadrant B | 623,269 | 86,136 |
| Events in quadrant C | 640,160 | 87,555 |
| Events in quadrant D | 888,080 | 76,221 |
| Mode SS | |||
|---|---|---|---|
| Quadrant | BADHDUFLAG | Total packets | Discarded packets |
| A | 0 | 112 | 78 |
| B | 0 | 110 | 78 |
| C | 0 | 110 | 78 |
| D | 0 | 109 | 79 |
| Mode M9 | |||
|---|---|---|---|
| Quadrant | BADHDUFLAG | Total packets | Discarded packets |
| A | 0 | 6 | 5 |
| B | 0 | 8 | 8 |
| C | 0 | 6 | 5 |
| D | 0 | 8 | 8 |
| Mode M0 | |||
|---|---|---|---|
| Quadrant | BADHDUFLAG | Total packets | Discarded packets |
| A | 0 | 10815 | 7839 |
| B | 0 | 11164 | 8297 |
| C | 0 | 10920 | 7963 |
| D | 0 | 14272 | 10662 |
| Quadrant | Total seconds | Saturated seconds | Saturation percentage |
|---|---|---|---|
| A | 1471 | 10 | 0.679810% |
| B | 1399 | 11 | 0.786276% |
| C | 1455 | 17 | 1.168385% |
| D | 1326 | 40 | 3.016591% |
Noise dominated data is calculated using 1-second bins in cleaned event files. If a bin has >2000 counts, and if more than 50% of those come from <1% of pixels, then it is considered to be noise-dominated and hence unusable.
| Quadrant | # 1 sec bins | Bins with >0 counts | Bins with >2000 counts | High rate bins dominated by noise | Noise dominated (total time) | Noise dominated (detector-on time) | Marked lightcurve |
|---|---|---|---|---|---|---|---|
| A | 4806 | 1717 | 0 | 0 | 0.00% | 0.00% | 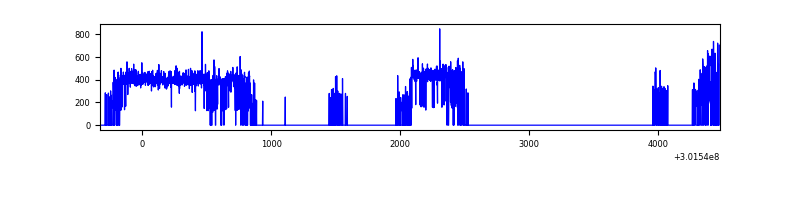 |
| B | 4796 | 1643 | 0 | 0 | 0.00% | 0.00% | 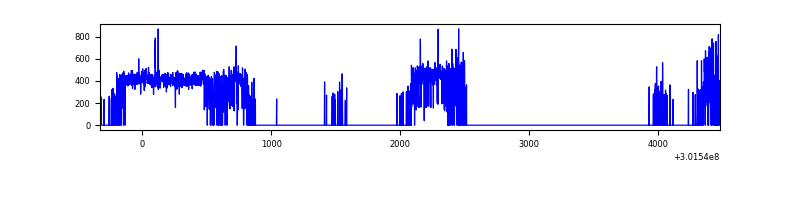 |
| C | 4798 | 1704 | 0 | 0 | 0.00% | 0.00% | 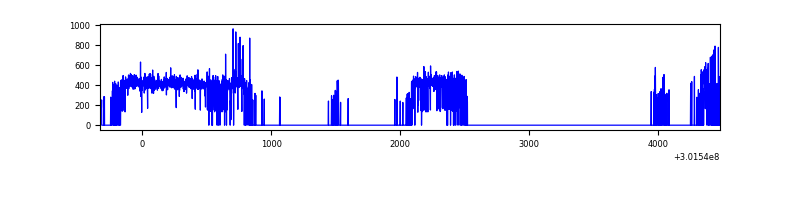 |
| D | 4770 | 1578 | 36 | 36 | 0.75% | 2.28% | 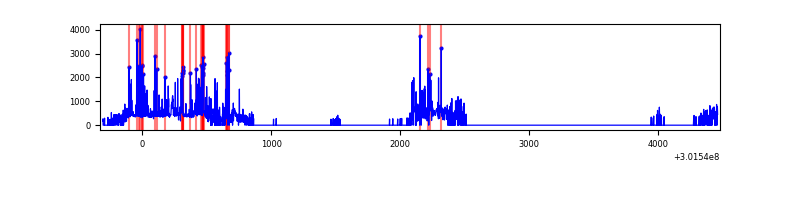 |
Top three noisy pixels from each quadrant. If the there are fewer than three noisy pixels in the level2.evt file, extra rows are filled as -1
| Pixel properties | Quadrant properties | ||||||
|---|---|---|---|---|---|---|---|
| Quadrant | DetID | PixID | Counts | Sigma | Mean | Median | Sigma |
| A | 5 | 16 | 1517 | 38.42 | 163 | 159 | 35.3 |
| A | 0 | 226 | 1396 | 35.0 | 163 | 159 | 35.3 |
| A | 3 | 137 | 1371 | 34.29 | 163 | 159 | 35.3 |
| B | 7 | 220 | 5346 | 161.8 | 153 | 149 | 32.1 |
| B | 0 | 219 | 3793 | 113.45 | 153 | 149 | 32.1 |
| B | 12 | 111 | 3679 | 109.9 | 153 | 149 | 32.1 |
| C | 14 | 238 | 23662 | 622.3 | 153 | 154 | 37.8 |
| C | 8 | 208 | 12881 | 336.91 | 153 | 154 | 37.8 |
| C | 8 | 128 | 3067 | 77.11 | 153 | 154 | 37.8 |
| D | 1 | 52 | 175990 | 4903.78 | 139 | 135 | 35.9 |
| D | 13 | 153 | 72330 | 2013.18 | 139 | 135 | 35.9 |
| D | 1 | 20 | 66857 | 1860.57 | 139 | 135 | 35.9 |
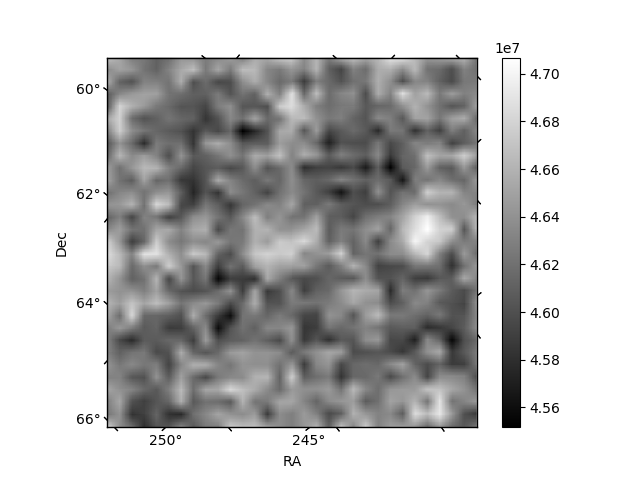
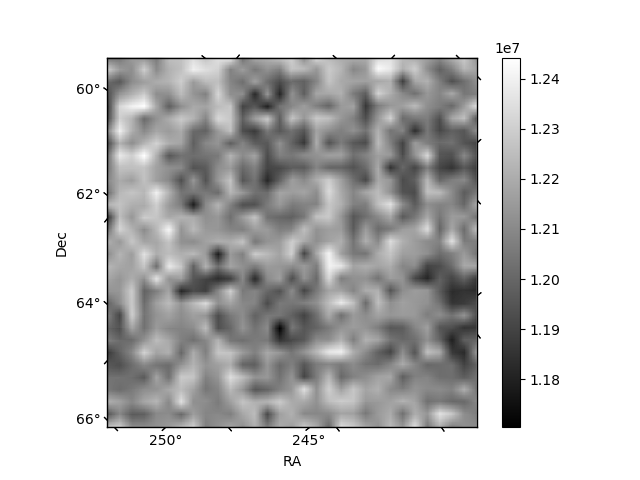
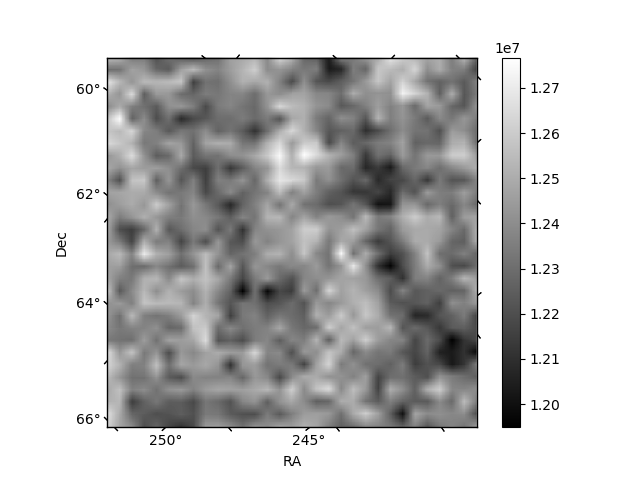
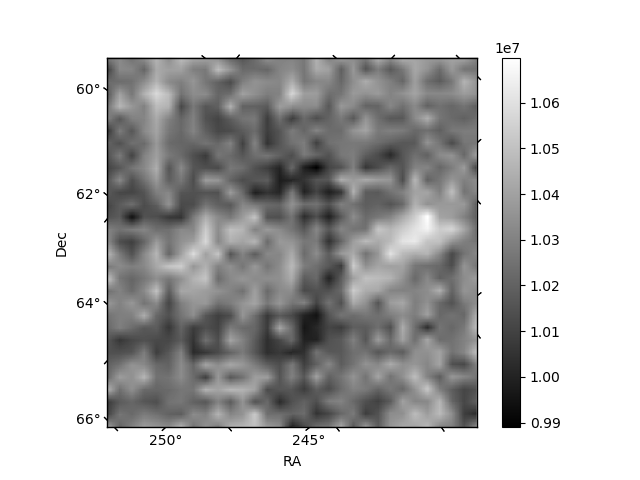
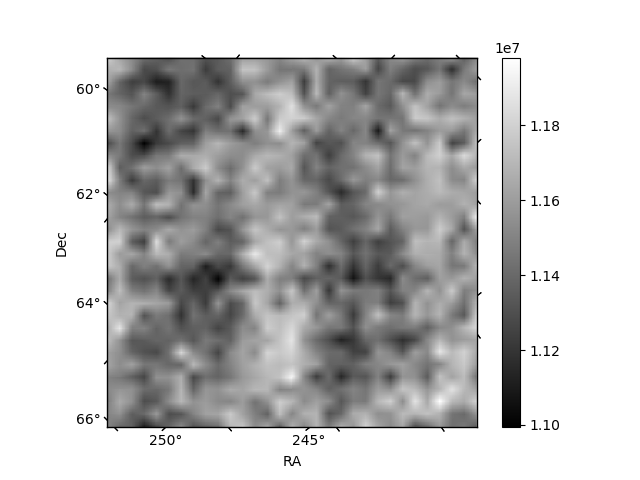
Histogram calculated using DETX and DETY for each event in the final _common_clean file
| Quadrant A | 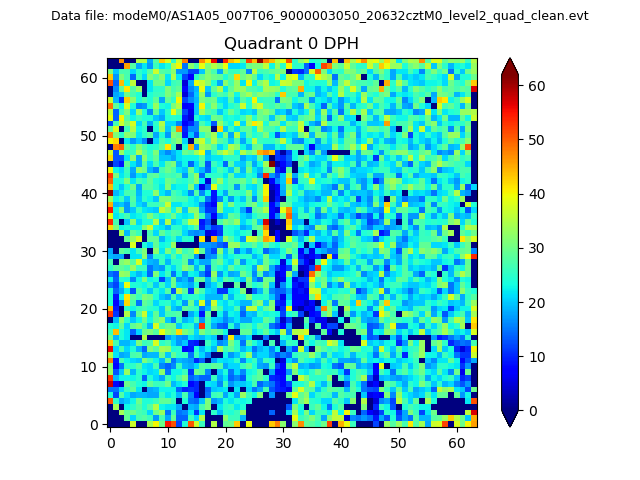 |
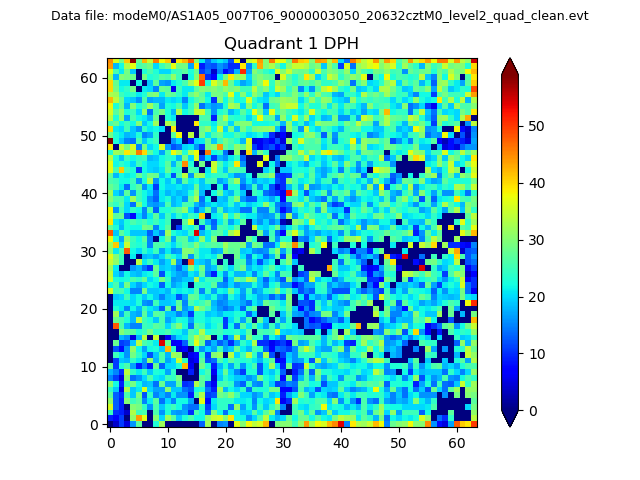 |
Quadrant B |
|---|---|---|---|
| Quadrant D |  |
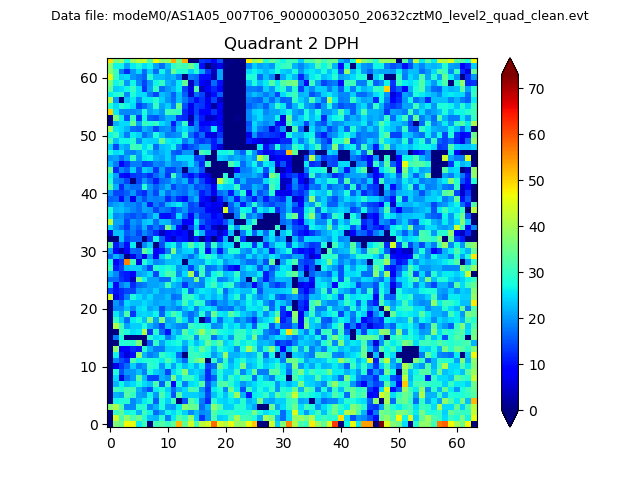 |
Quadrant C |
| Plot type | Count rate plots | Images |
|---|---|---|
| Comparison with Poisson distribution Blue bars denote a histogram of data divided into 1 sec bins. Red curve is a Poisson curve with rate = median count rate of data. |
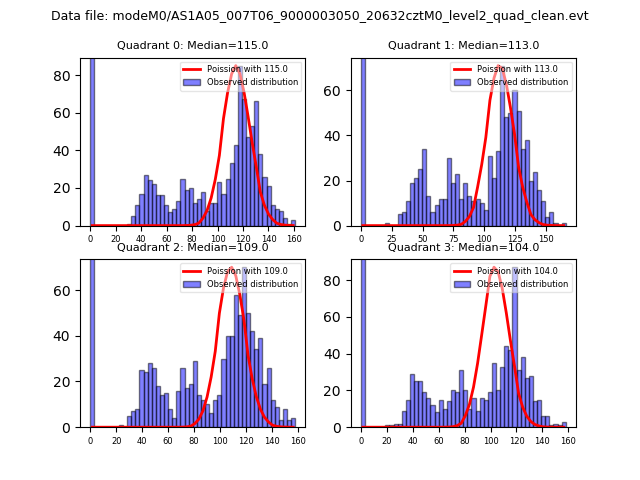 |
 |
| Quadrant-wise count rates Data is divided into 100 sec bins |
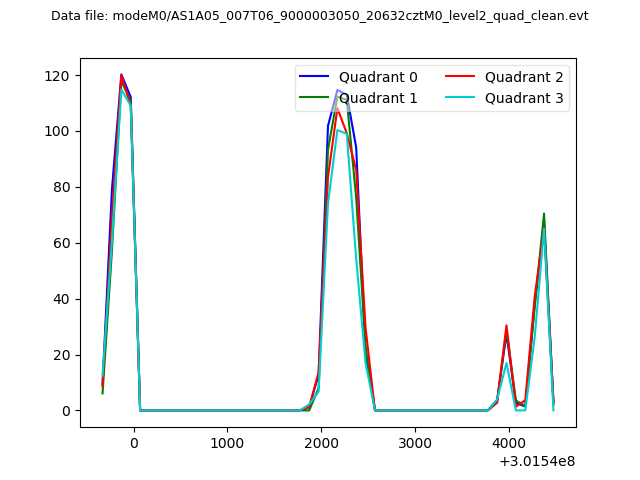 |
|
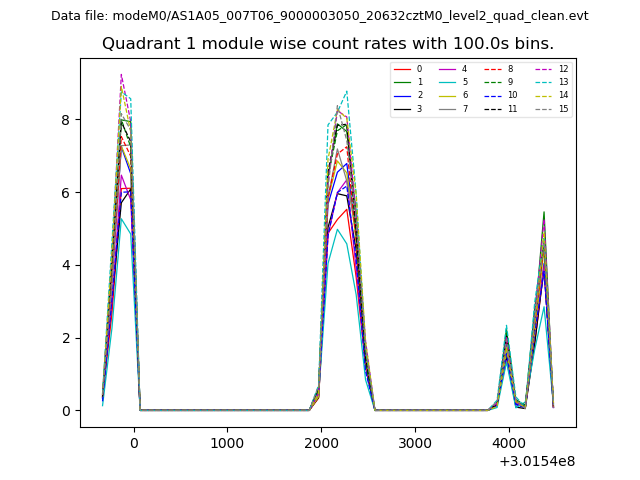
| Module-wise count rates for Quadrant A Data is divided into 100 sec bins |
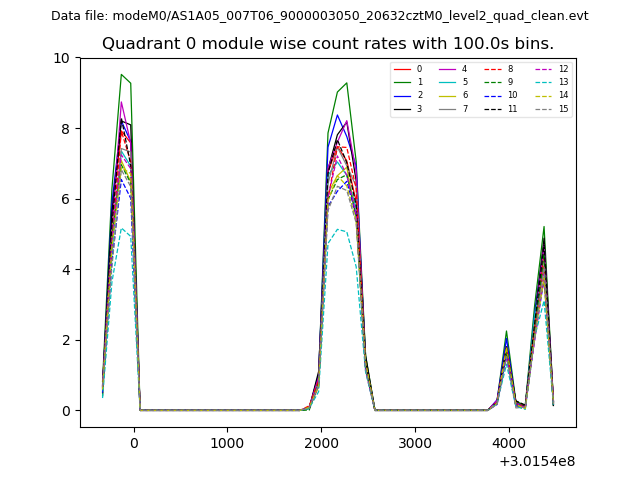 |
 |
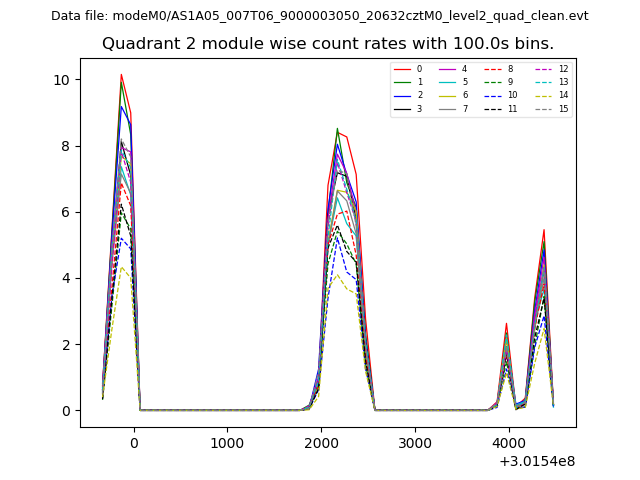
| Module-wise count rates for Quadrant B Data is divided into 100 sec bins |
 |
 |
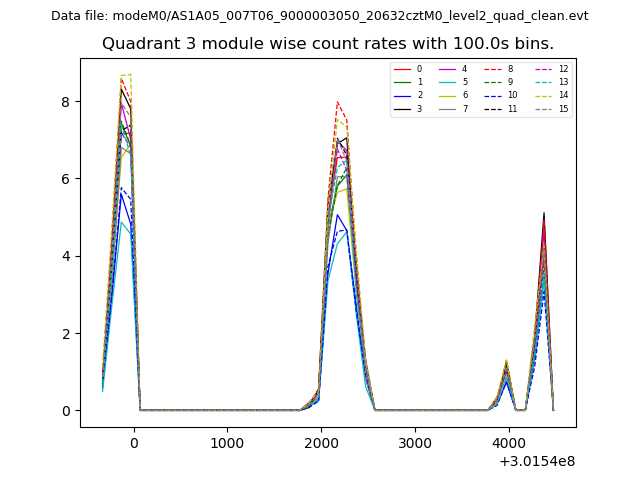
| Module-wise count rates for Quadrant C Data is divided into 100 sec bins |
 |
 |
| Module-wise count rates for Quadrant D Data is divided into 100 sec bins |
 |
 |
| Parameter | Plot |
|---|---|
| CZT HV Monitor | 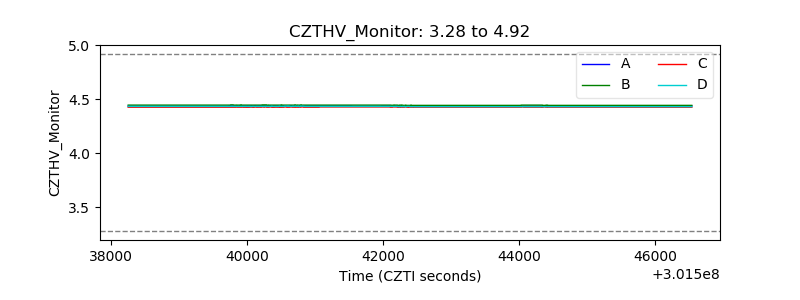 |
| D_VDD | 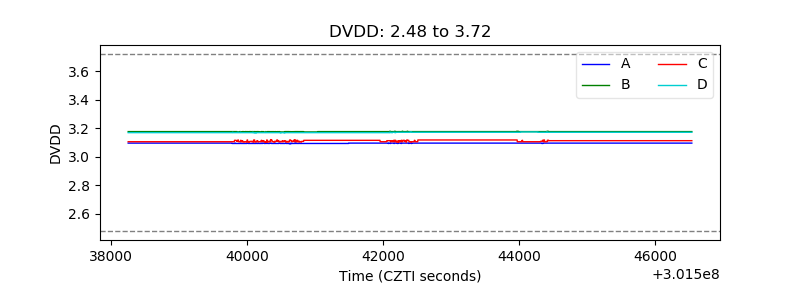 |
| Temperature 1 | 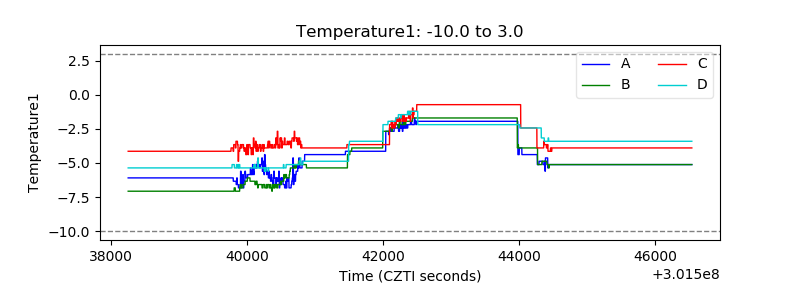 |
| Veto HV Monitor | 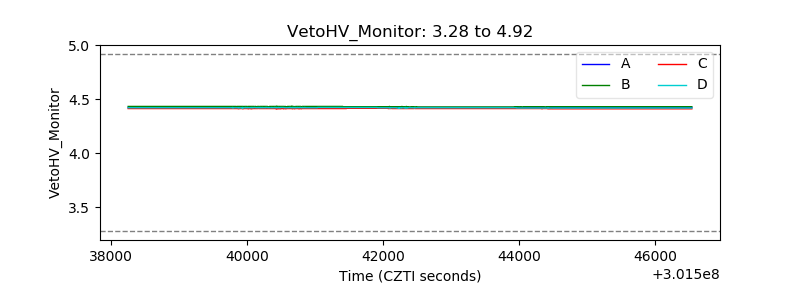 |
| Veto LLD | 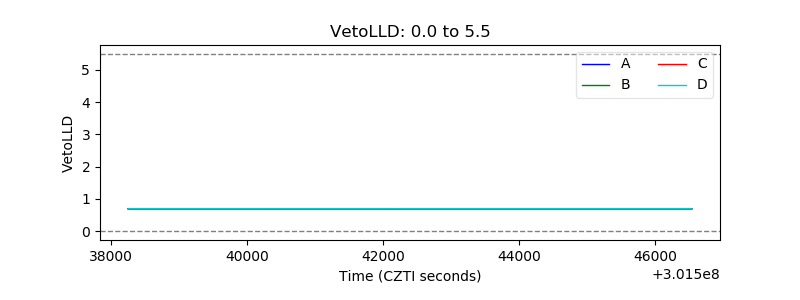 |
| Alpha Counter | 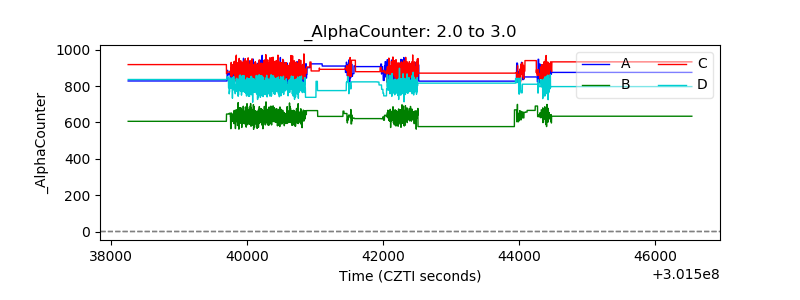 |
| _CPM_Rate | 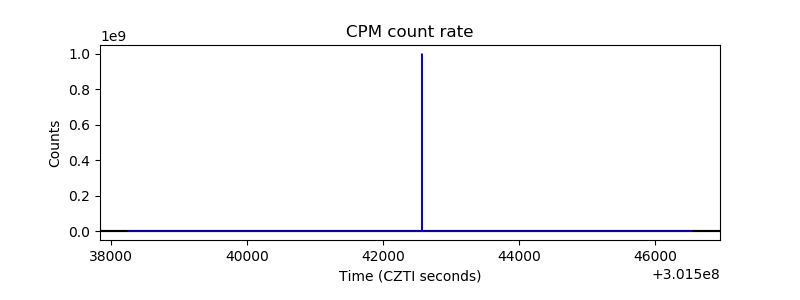 |
| CZT Counter |  |
| +2.5 Volts monitor |  |
| +5 Volts monitor |  |
| _ROLL_ROT | 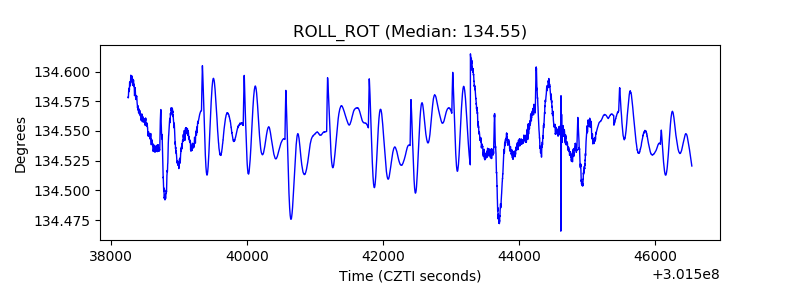 |
| _Roll_DEC | 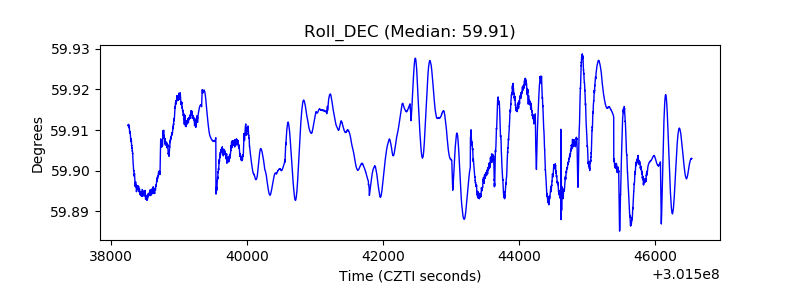 |
| _Roll_RA | 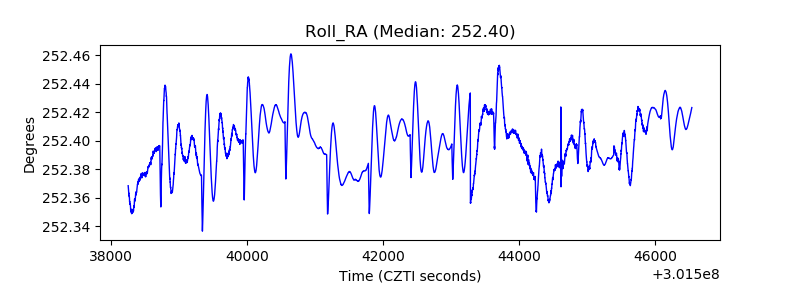 |
| Veto Counter | 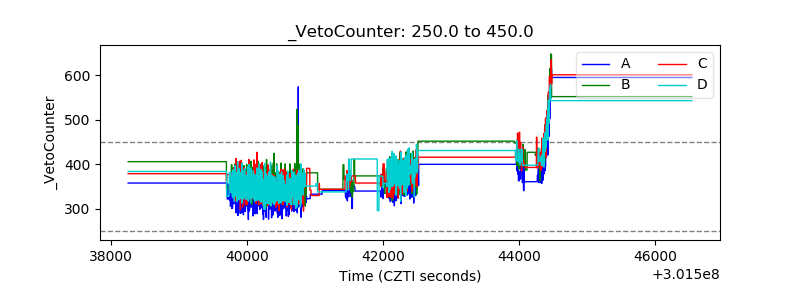 |