| Param | Original file | Final file |
|---|---|---|
| Filename | modeM0/AS1A05_007T06_9000003050_20634cztM0_level2.evt | modeM0/AS1A05_007T06_9000003050_20634cztM0_level2_quad_clean.evt |
| Size (bytes) | 681,762,240 | 105,154,560 |
| Size | 650.2 MB | 100.3 MB |
| Events in quadrant A | 4,064,958 | 700,037 |
| Events in quadrant B | 4,371,511 | 691,358 |
| Events in quadrant C | 4,334,701 | 674,781 |
| Events in quadrant D | 7,283,485 | 511,215 |
| Mode SS | |||
|---|---|---|---|
| Quadrant | BADHDUFLAG | Total packets | Discarded packets |
| A | 0 | 178 | 0 |
| B | 0 | 178 | 0 |
| C | 0 | 178 | 0 |
| D | 0 | 178 | 0 |
| Mode M9 | |||
|---|---|---|---|
| Quadrant | BADHDUFLAG | Total packets | Discarded packets |
| A | 0 | 11 | 0 |
| B | 0 | 11 | 0 |
| C | 0 | 11 | 0 |
| D | 0 | 11 | 0 |
| Mode M0 | |||
|---|---|---|---|
| Quadrant | BADHDUFLAG | Total packets | Discarded packets |
| A | 0 | 17924 | 3 |
| B | 0 | 18703 | 2 |
| C | 0 | 18514 | 2 |
| D | 0 | 27785 | 2 |
| Quadrant | Total seconds | Saturated seconds | Saturation percentage |
|---|---|---|---|
| A | 8737 | 89 | 1.018656% |
| B | 8737 | 144 | 1.648163% |
| C | 8737 | 130 | 1.487925% |
| D | 8737 | 1636 | 18.724963% |
Noise dominated data is calculated using 1-second bins in cleaned event files. If a bin has >2000 counts, and if more than 50% of those come from <1% of pixels, then it is considered to be noise-dominated and hence unusable.
| Quadrant | # 1 sec bins | Bins with >0 counts | Bins with >2000 counts | High rate bins dominated by noise | Noise dominated (total time) | Noise dominated (detector-on time) | Marked lightcurve |
|---|---|---|---|---|---|---|---|
| A | 9742 | 8739 | 6 | 6 | 0.06% | 0.07% | 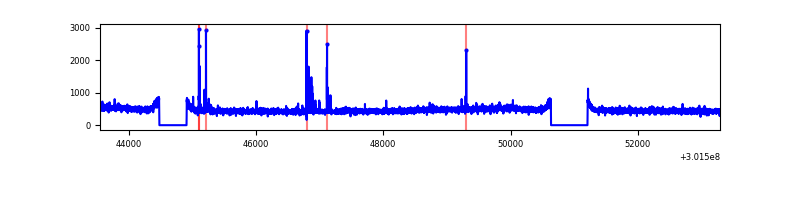 |
| B | 9742 | 8739 | 18 | 18 | 0.18% | 0.21% | 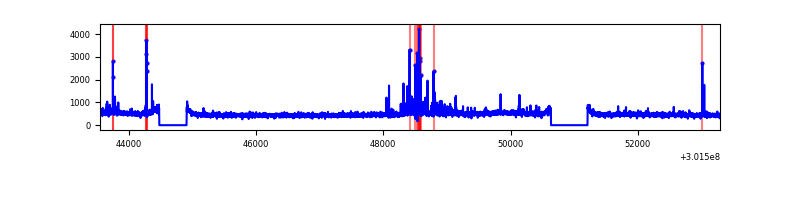 |
| C | 9742 | 8739 | 0 | 0 | 0.00% | 0.00% | 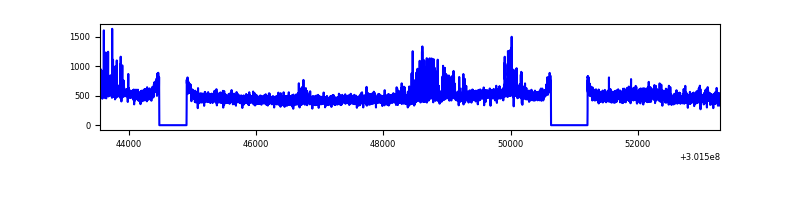 |
| D | 9742 | 8739 | 955 | 955 | 9.80% | 10.93% | 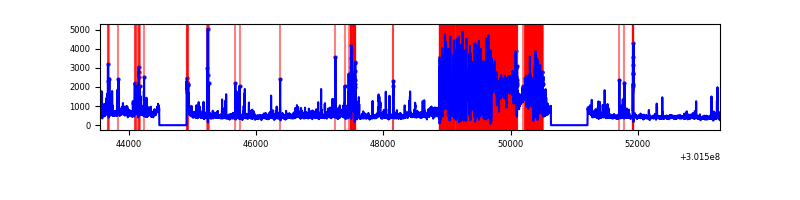 |
Top three noisy pixels from each quadrant. If the there are fewer than three noisy pixels in the level2.evt file, extra rows are filled as -1
| Pixel properties | Quadrant properties | ||||||
|---|---|---|---|---|---|---|---|
| Quadrant | DetID | PixID | Counts | Sigma | Mean | Median | Sigma |
| A | 5 | 16 | 57982 | 271.39 | 1037 | 1013 | 209.9 |
| A | 15 | 174 | 12112 | 52.87 | 1037 | 1013 | 209.9 |
| A | 8 | 205 | 10021 | 42.91 | 1037 | 1013 | 209.9 |
| B | 7 | 220 | 147309 | 742.87 | 1030 | 1003 | 196.9 |
| B | 4 | 216 | 48341 | 240.36 | 1030 | 1003 | 196.9 |
| B | 12 | 111 | 24022 | 116.88 | 1030 | 1003 | 196.9 |
| C | 8 | 208 | 265134 | 1123.34 | 999 | 1005 | 235.1 |
| C | 14 | 238 | 154263 | 651.81 | 999 | 1005 | 235.1 |
| C | 3 | 233 | 9722 | 37.07 | 999 | 1005 | 235.1 |
| D | 1 | 20 | 3117242 | 14977.34 | 858 | 832 | 208.1 |
| D | 1 | 52 | 437958 | 2100.81 | 858 | 832 | 208.1 |
| D | 5 | 222 | 201756 | 965.63 | 858 | 832 | 208.1 |
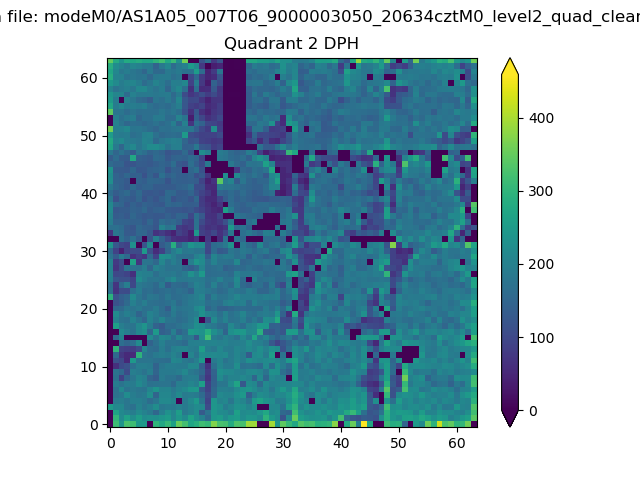
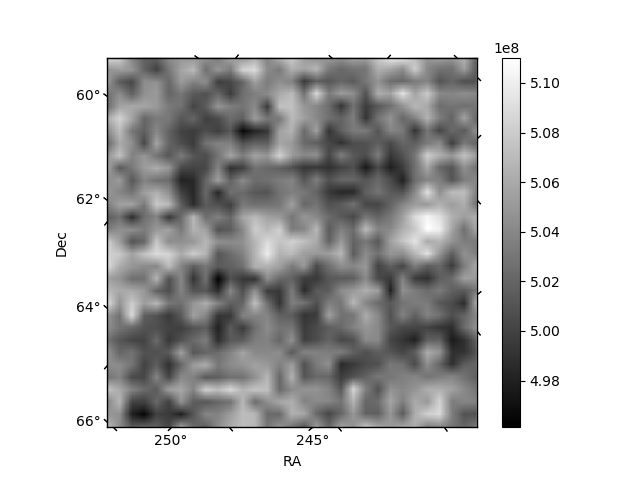
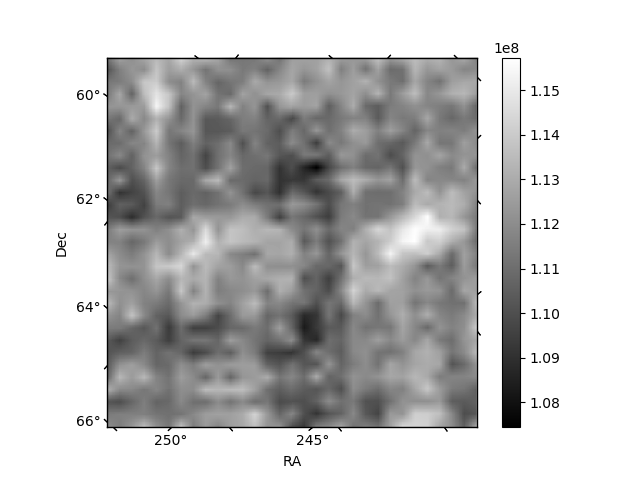
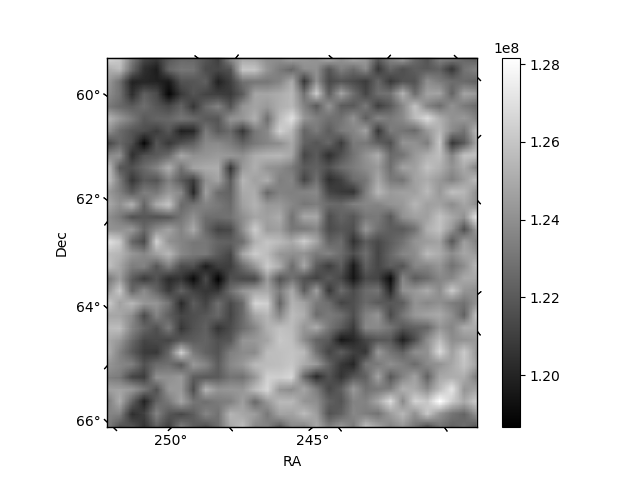
Histogram calculated using DETX and DETY for each event in the final _common_clean file
| Quadrant A | 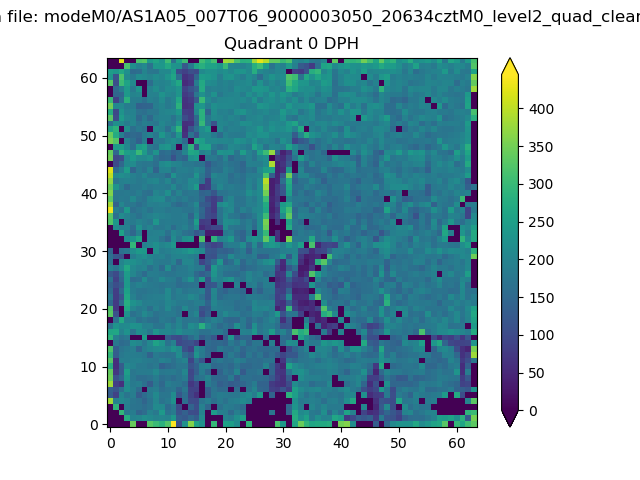 |
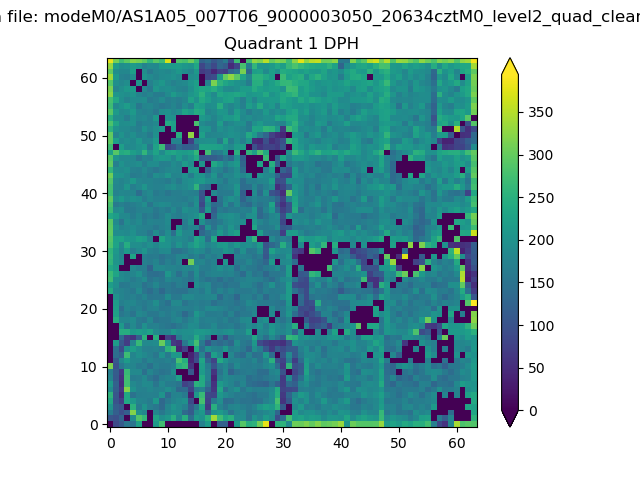 |
Quadrant B |
|---|---|---|---|
| Quadrant D | 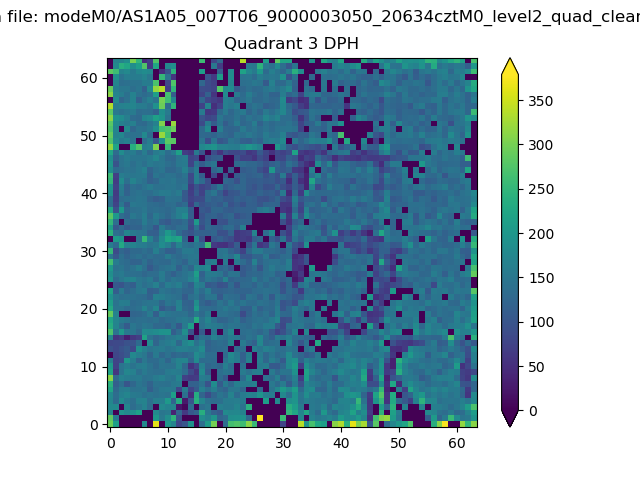 |
 |
Quadrant C |
| Plot type | Count rate plots | Images |
|---|---|---|
| Comparison with Poisson distribution Blue bars denote a histogram of data divided into 1 sec bins. Red curve is a Poisson curve with rate = median count rate of data. |
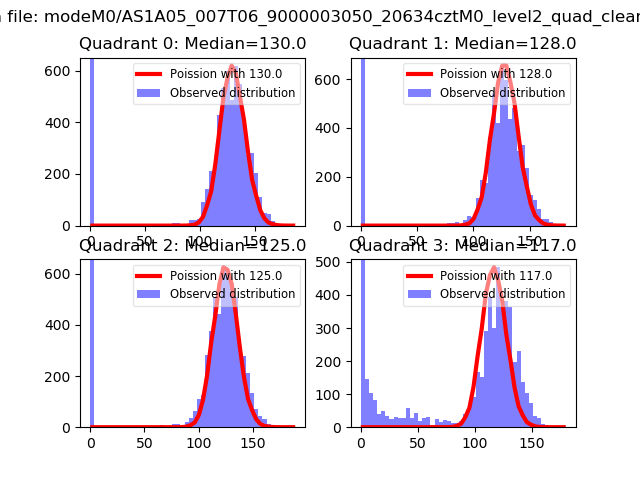 |
 |
| Quadrant-wise count rates Data is divided into 100 sec bins |
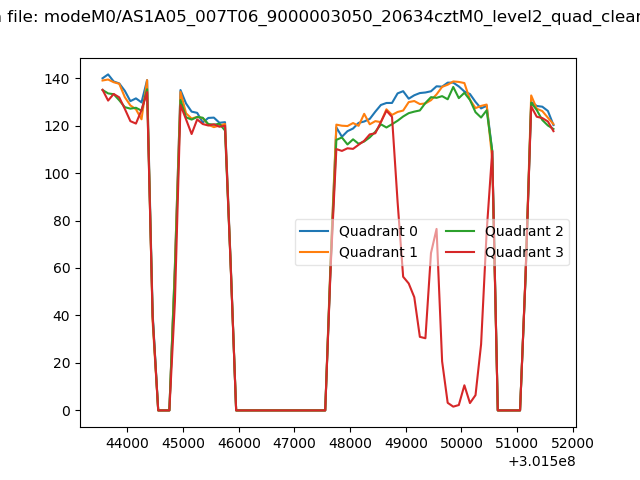 |
|
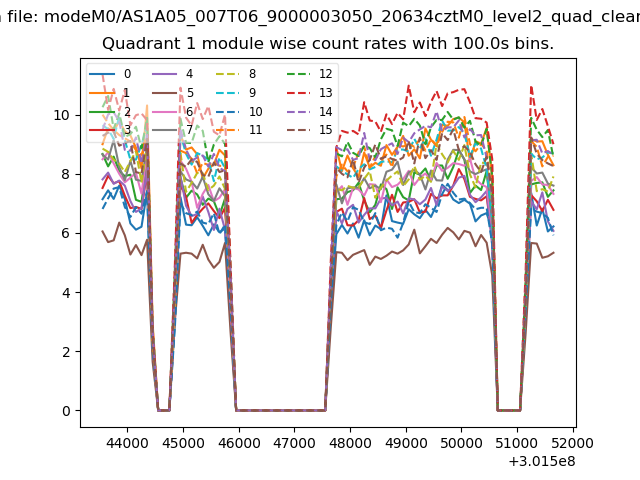
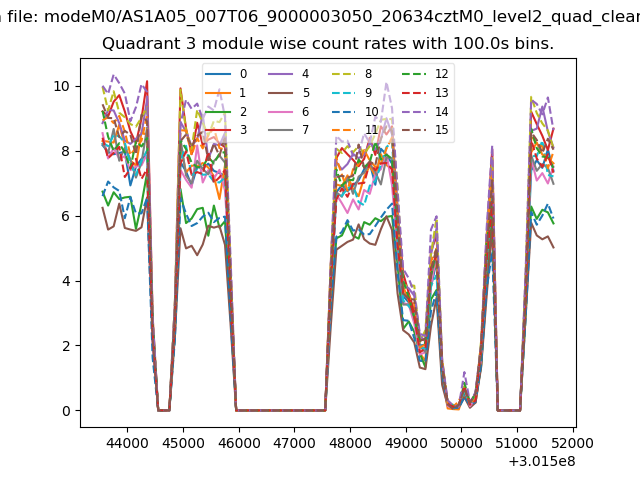
| Module-wise count rates for Quadrant A Data is divided into 100 sec bins |
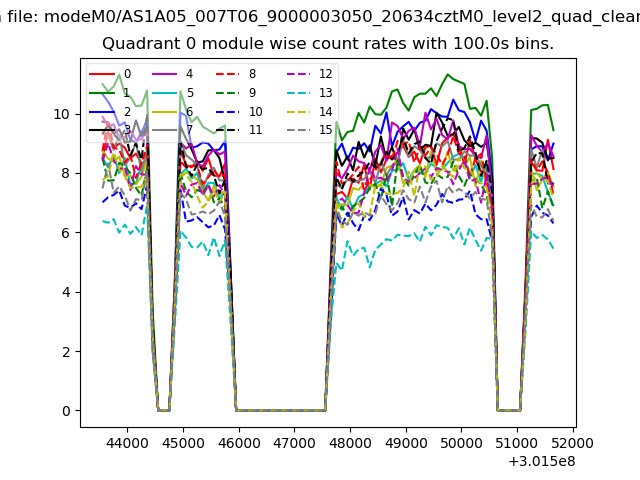 |
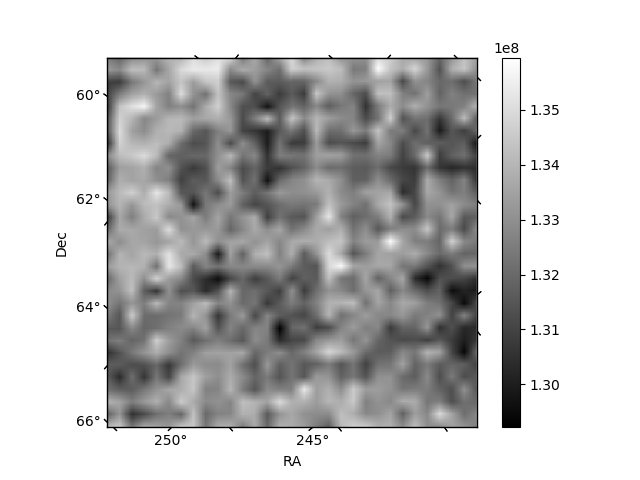 |
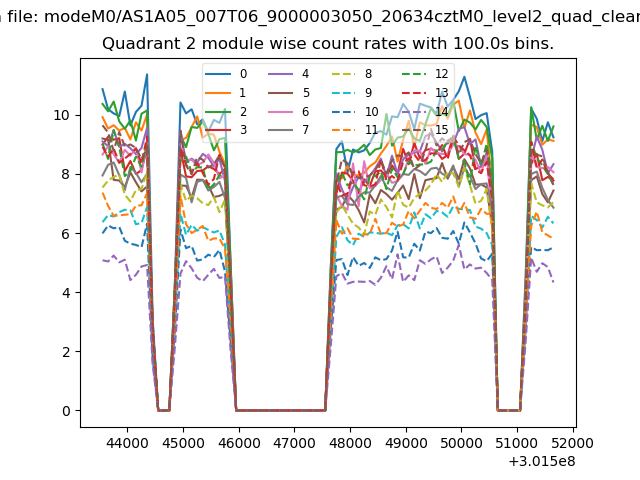
| Module-wise count rates for Quadrant B Data is divided into 100 sec bins |
 |
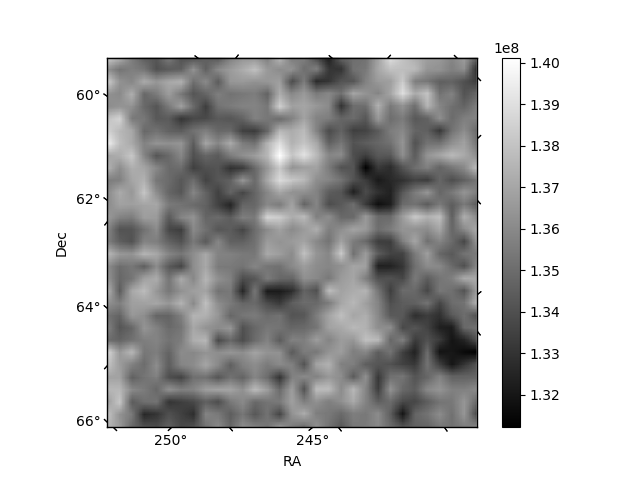 |
| Module-wise count rates for Quadrant C Data is divided into 100 sec bins |
 |
 |
| Module-wise count rates for Quadrant D Data is divided into 100 sec bins |
 |
 |
| Parameter | Plot |
|---|---|
| CZT HV Monitor | 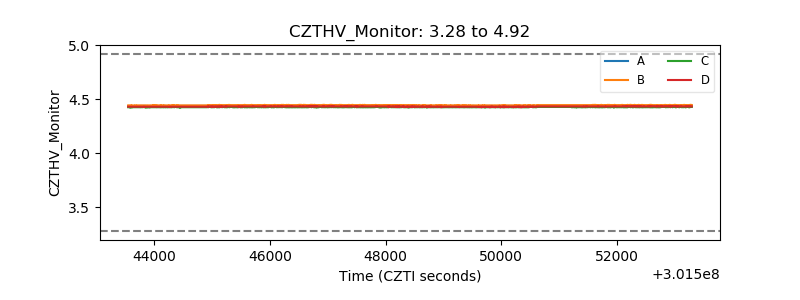 |
| D_VDD | 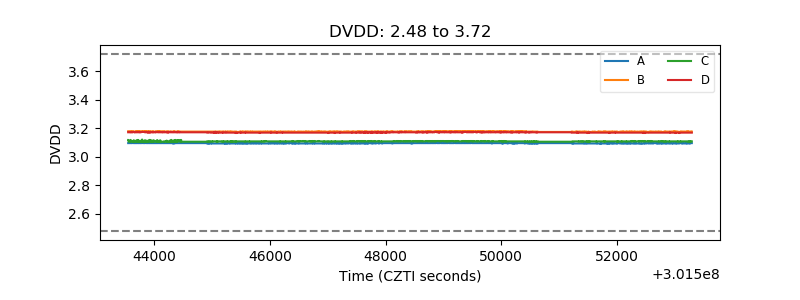 |
| Temperature 1 | 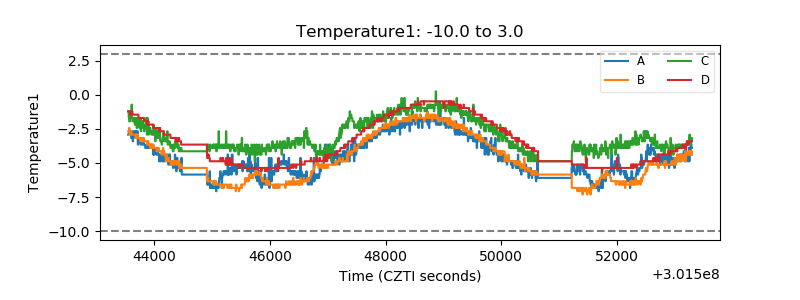 |
| Veto HV Monitor |  |
| Veto LLD | 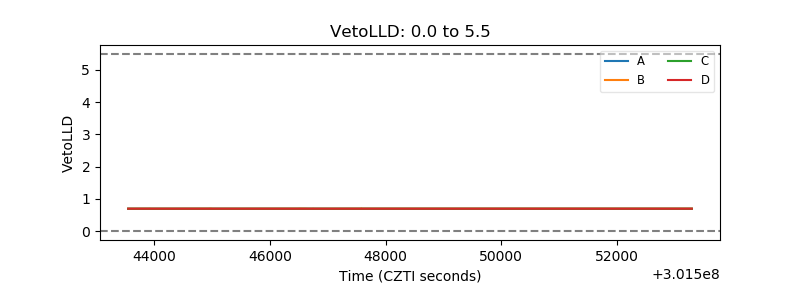 |
| Alpha Counter | 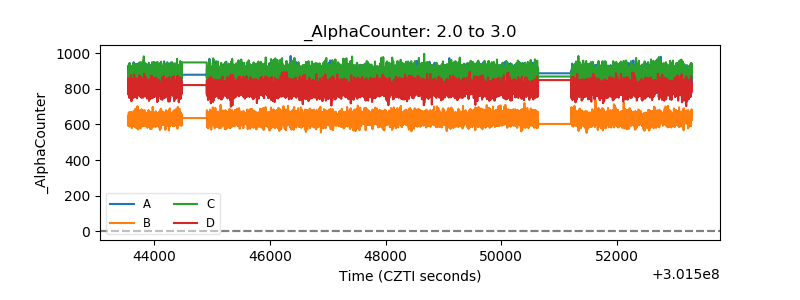 |
| _CPM_Rate | 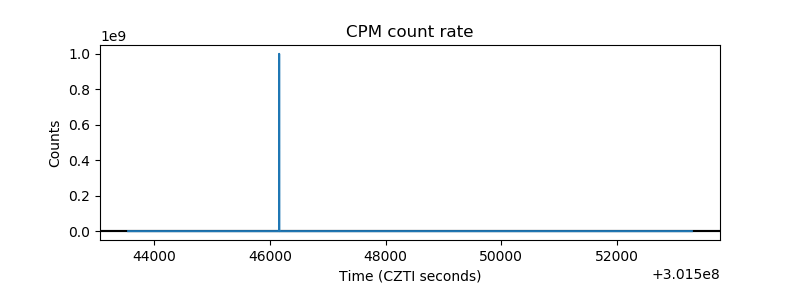 |
| CZT Counter | 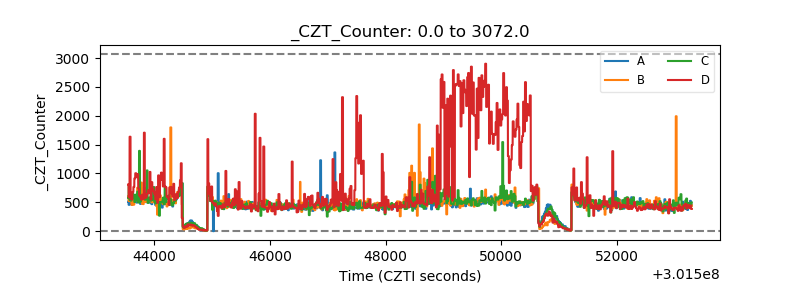 |
| +2.5 Volts monitor |  |
| +5 Volts monitor | 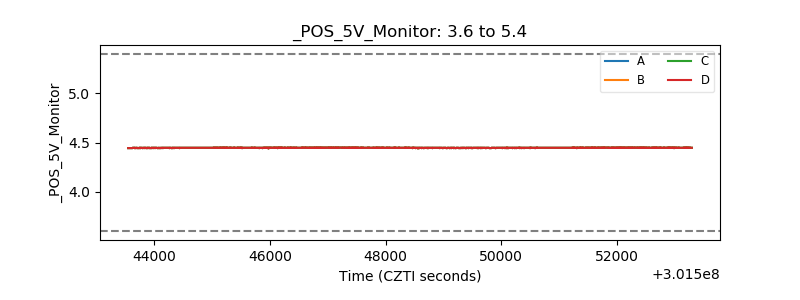 |
| _ROLL_ROT | 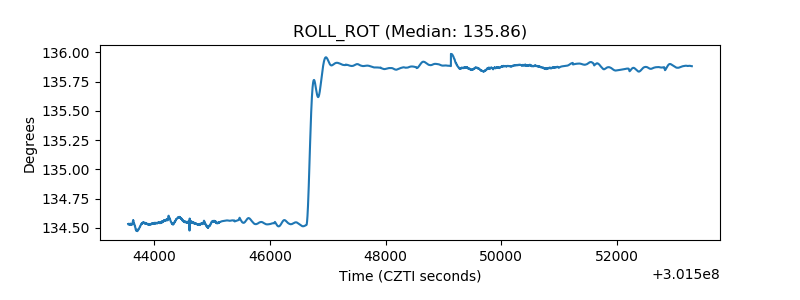 |
| _Roll_DEC | 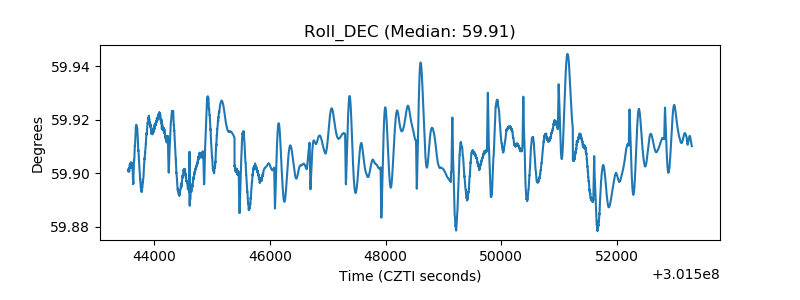 |
| _Roll_RA | 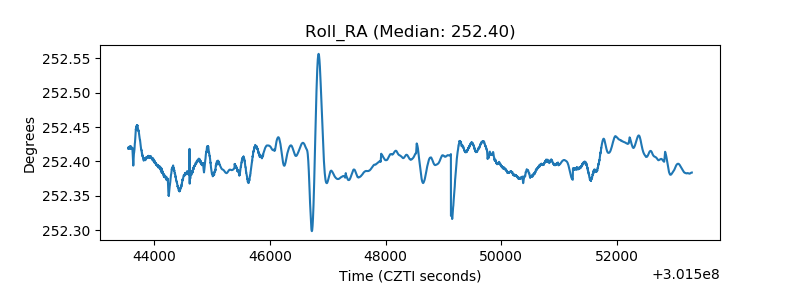 |
| Veto Counter | 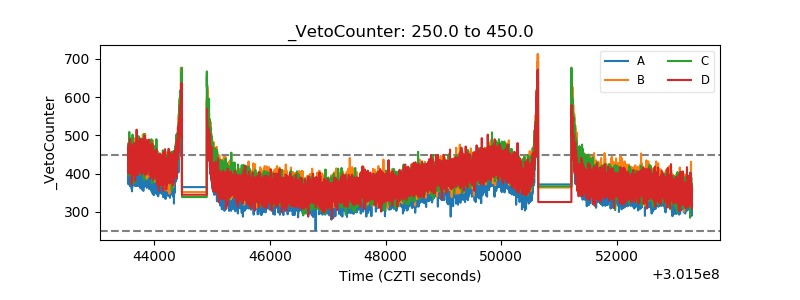 |