| Param | Original file | Final file |
|---|---|---|
| Filename | modeM0/AS1A05_007T06_9000003050_20635cztM0_level2.evt | modeM0/AS1A05_007T06_9000003050_20635cztM0_level2_quad_clean.evt |
| Size (bytes) | 1,017,411,840 | 180,941,760 |
| Size | 970.3 MB | 172.6 MB |
| Events in quadrant A | 6,848,280 | 1,142,702 |
| Events in quadrant B | 7,412,745 | 1,134,361 |
| Events in quadrant C | 7,191,579 | 1,096,525 |
| Events in quadrant D | 8,355,038 | 1,081,340 |
| Mode SS | |||
|---|---|---|---|
| Quadrant | BADHDUFLAG | Total packets | Discarded packets |
| A | 0 | 300 | 0 |
| B | 0 | 300 | 0 |
| C | 0 | 300 | 0 |
| D | 0 | 300 | 0 |
| Mode M9 | |||
|---|---|---|---|
| Quadrant | BADHDUFLAG | Total packets | Discarded packets |
| A | 0 | 16 | 0 |
| B | 0 | 16 | 0 |
| C | 0 | 16 | 0 |
| D | 0 | 16 | 0 |
| Mode M0 | |||
|---|---|---|---|
| Quadrant | BADHDUFLAG | Total packets | Discarded packets |
| A | 0 | 30333 | 5 |
| B | 0 | 31634 | 3 |
| C | 0 | 30877 | 3 |
| D | 0 | 35012 | 3 |
| Quadrant | Total seconds | Saturated seconds | Saturation percentage |
|---|---|---|---|
| A | 14853 | 139 | 0.935838% |
| B | 14853 | 203 | 1.366727% |
| C | 14853 | 151 | 1.016630% |
| D | 14853 | 364 | 2.450683% |
Noise dominated data is calculated using 1-second bins in cleaned event files. If a bin has >2000 counts, and if more than 50% of those come from <1% of pixels, then it is considered to be noise-dominated and hence unusable.
| Quadrant | # 1 sec bins | Bins with >0 counts | Bins with >2000 counts | High rate bins dominated by noise | Noise dominated (total time) | Noise dominated (detector-on time) | Marked lightcurve |
|---|---|---|---|---|---|---|---|
| A | 32218 | 14857 | 16 | 16 | 0.05% | 0.11% | 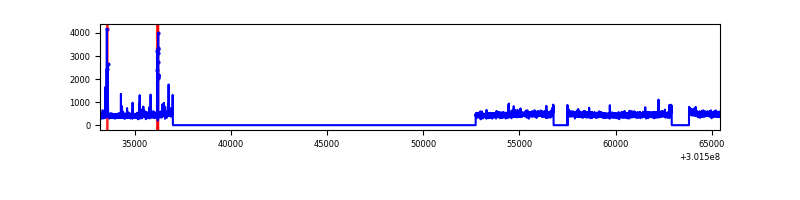 |
| B | 32218 | 14857 | 47 | 47 | 0.15% | 0.32% | 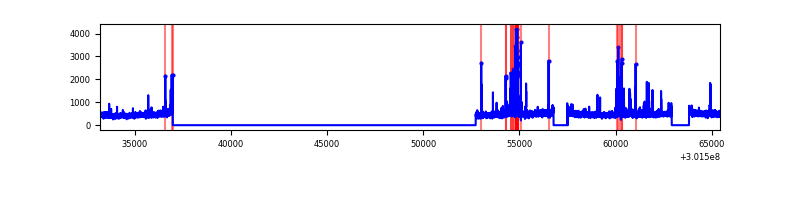 |
| C | 32218 | 14856 | 0 | 0 | 0.00% | 0.00% | 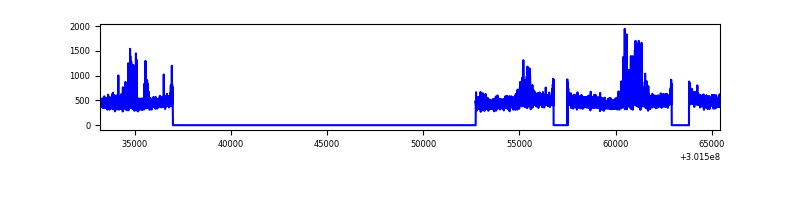 |
| D | 32218 | 14857 | 308 | 308 | 0.96% | 2.07% | 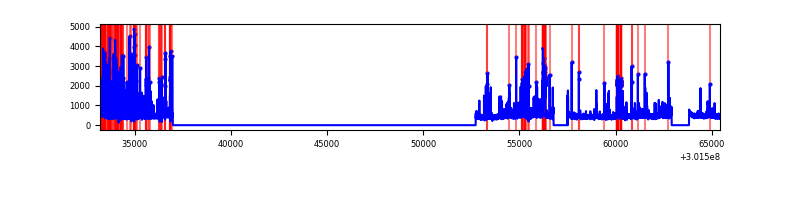 |
Top three noisy pixels from each quadrant. If the there are fewer than three noisy pixels in the level2.evt file, extra rows are filled as -1
| Pixel properties | Quadrant properties | ||||||
|---|---|---|---|---|---|---|---|
| Quadrant | DetID | PixID | Counts | Sigma | Mean | Median | Sigma |
| A | 5 | 16 | 120684 | 339.22 | 1745 | 1708 | 350.7 |
| A | 2 | 79 | 15475 | 39.25 | 1745 | 1708 | 350.7 |
| A | 0 | 226 | 15232 | 38.56 | 1745 | 1708 | 350.7 |
| B | 7 | 220 | 302937 | 924.23 | 1729 | 1684 | 325.9 |
| B | 0 | 197 | 94873 | 285.9 | 1729 | 1684 | 325.9 |
| B | 0 | 183 | 45454 | 134.28 | 1729 | 1684 | 325.9 |
| C | 8 | 208 | 403071 | 1037.45 | 1664 | 1671 | 386.9 |
| C | 14 | 238 | 260104 | 667.94 | 1664 | 1671 | 386.9 |
| C | 3 | 233 | 33990 | 83.53 | 1664 | 1671 | 386.9 |
| D | 1 | 52 | 786014 | 1928.43 | 1687 | 1642 | 406.7 |
| D | 5 | 222 | 353961 | 866.2 | 1687 | 1642 | 406.7 |
| D | 1 | 20 | 294309 | 719.54 | 1687 | 1642 | 406.7 |
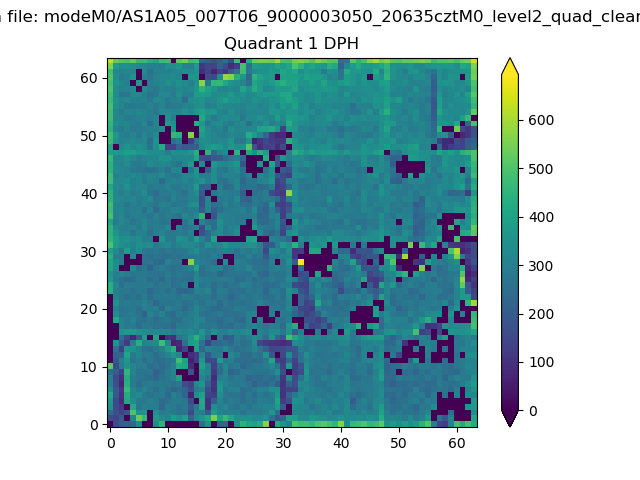
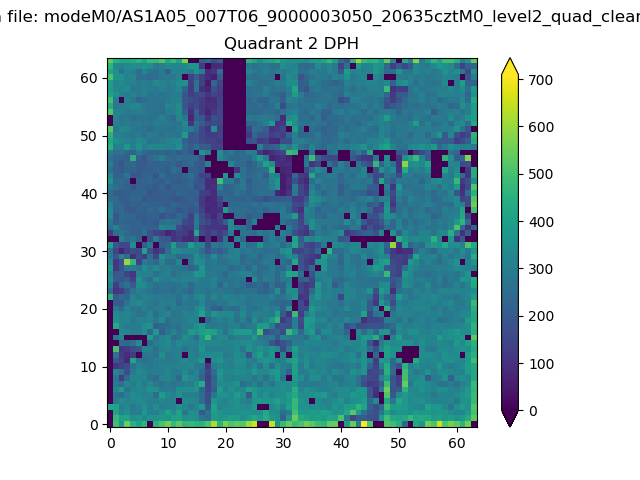
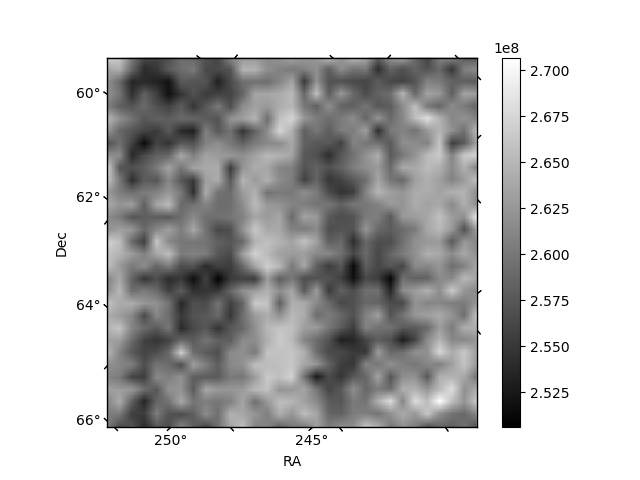
Histogram calculated using DETX and DETY for each event in the final _common_clean file
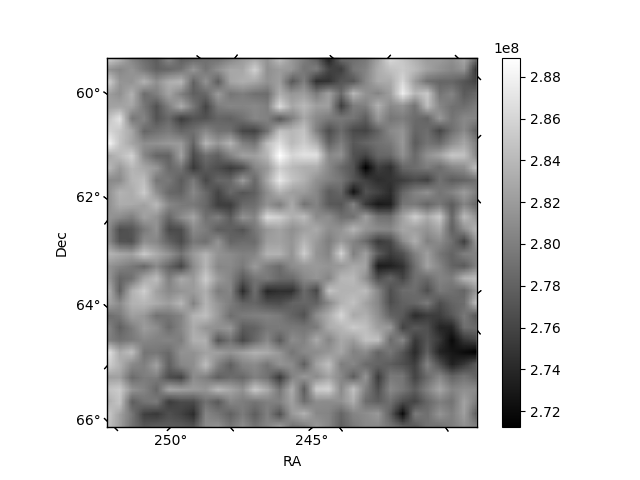
| Quadrant A |  |
 |
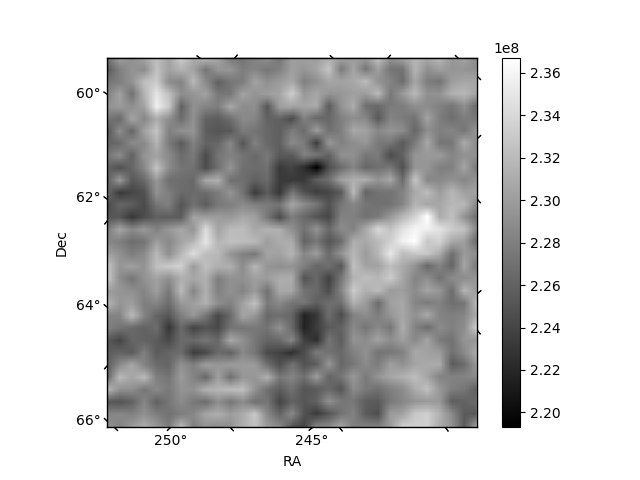
Quadrant B |
|---|---|---|---|
| Quadrant D | 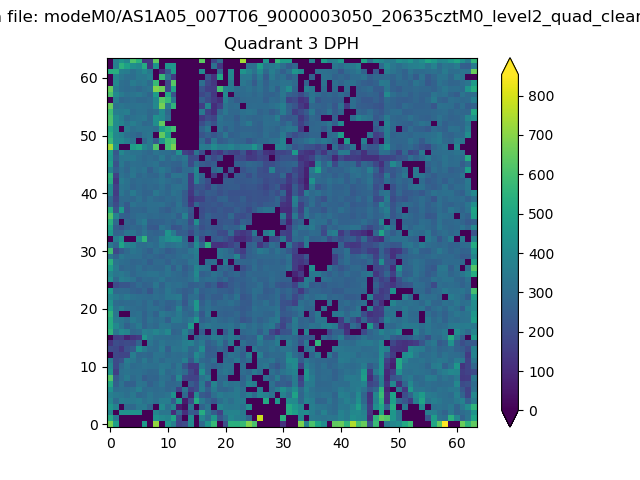 |
 |
Quadrant C |
| Plot type | Count rate plots | Images |
|---|---|---|
| Comparison with Poisson distribution Blue bars denote a histogram of data divided into 1 sec bins. Red curve is a Poisson curve with rate = median count rate of data. |
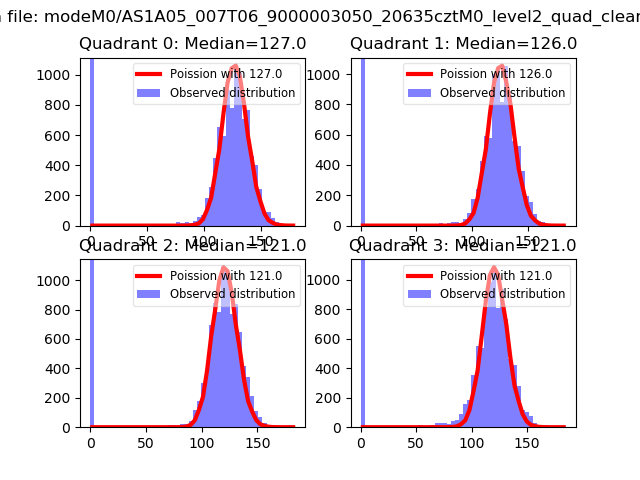 |
 |
| Quadrant-wise count rates Data is divided into 100 sec bins |
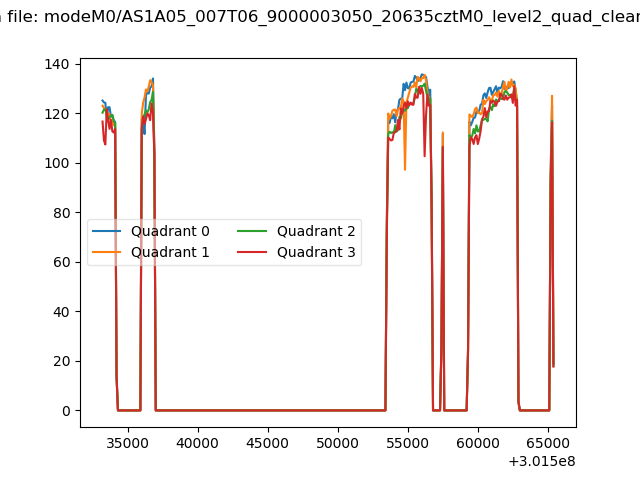 |
|
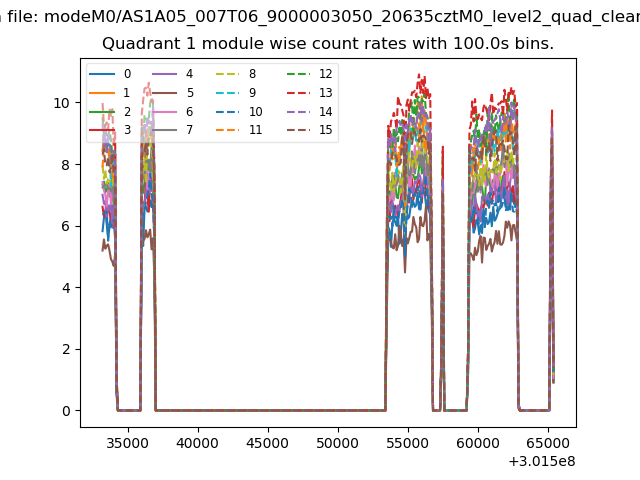
| Module-wise count rates for Quadrant A Data is divided into 100 sec bins |
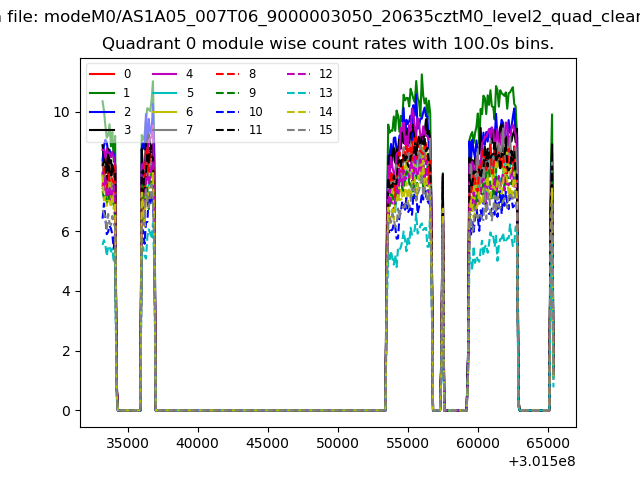 |
 |
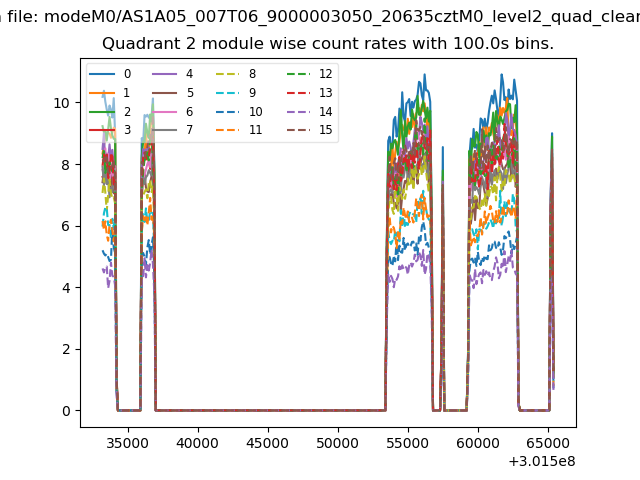
| Module-wise count rates for Quadrant B Data is divided into 100 sec bins |
 |
 |
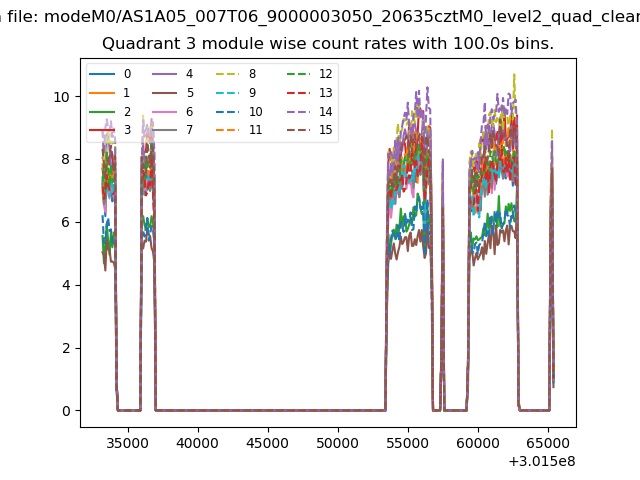
| Module-wise count rates for Quadrant C Data is divided into 100 sec bins |
 |
 |
| Module-wise count rates for Quadrant D Data is divided into 100 sec bins |
 |
 |
| Parameter | Plot |
|---|---|
| CZT HV Monitor | 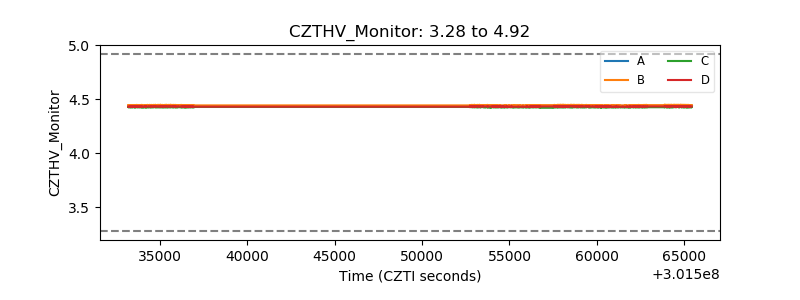 |
| D_VDD | 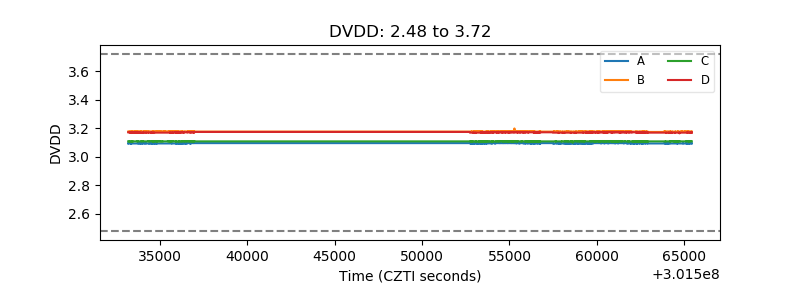 |
| Temperature 1 | 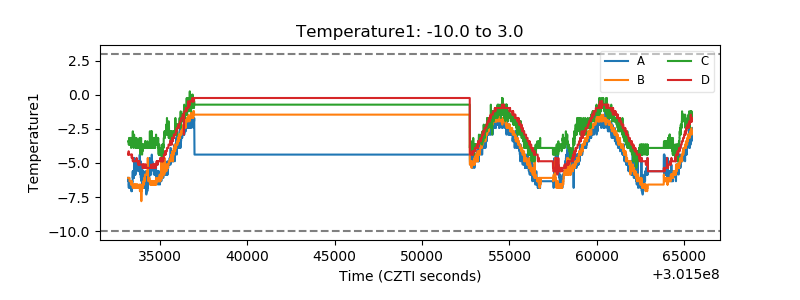 |
| Veto HV Monitor | 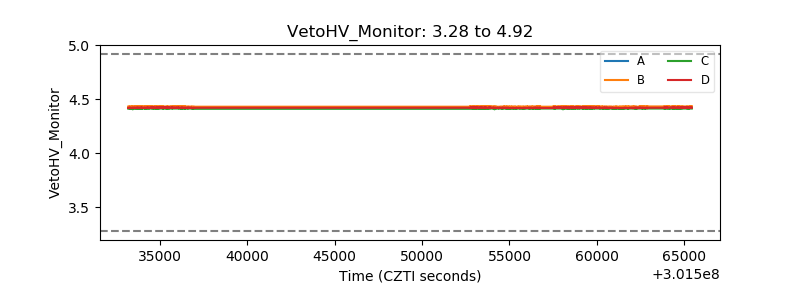 |
| Veto LLD | 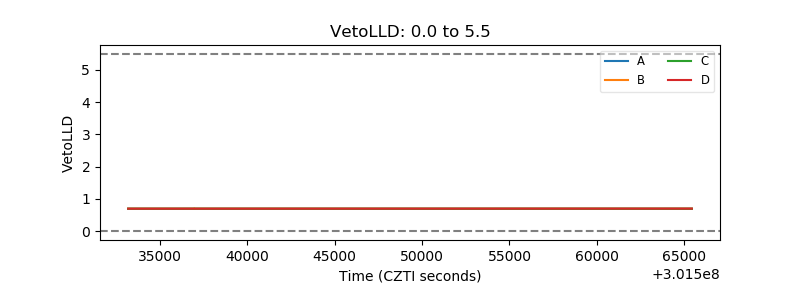 |
| Alpha Counter |  |
| _CPM_Rate | 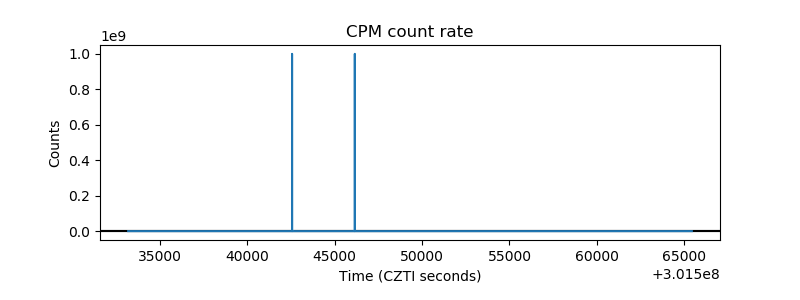 |
| CZT Counter | 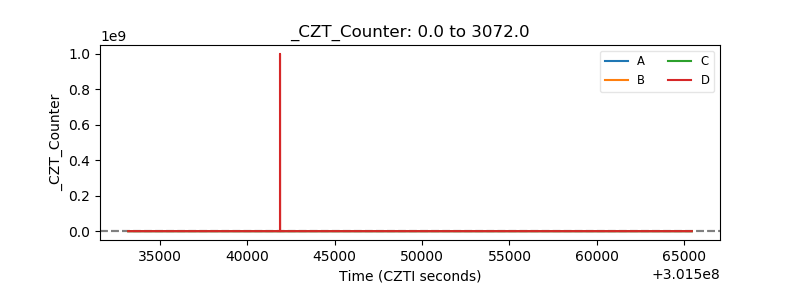 |
| +2.5 Volts monitor |  |
| +5 Volts monitor |  |
| _ROLL_ROT | 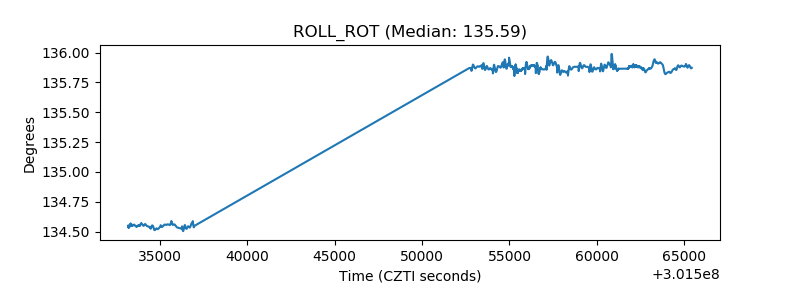 |
| _Roll_DEC | 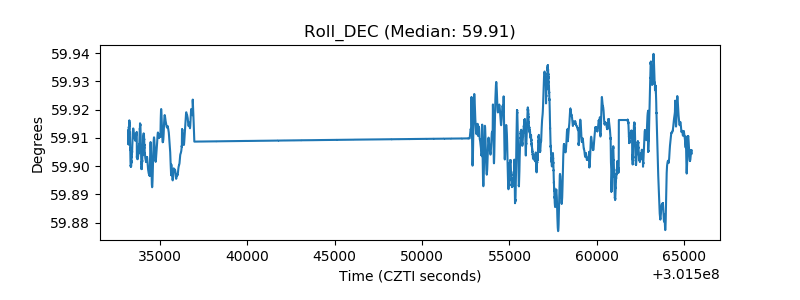 |
| _Roll_RA | 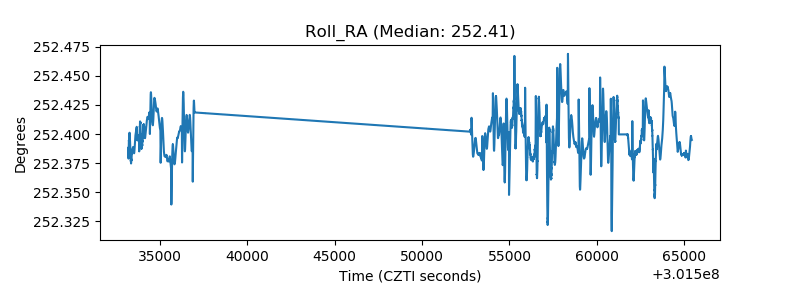 |
| Veto Counter | 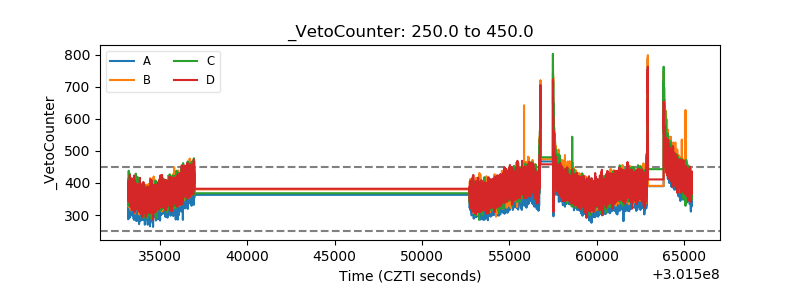 |