| Param | Original file | Final file |
|---|---|---|
| Filename | modeM0/AS1A05_007T06_9000003050_20636cztM0_level2.evt | modeM0/AS1A05_007T06_9000003050_20636cztM0_level2_quad_clean.evt |
| Size (bytes) | 2,265,793,920 | 418,449,600 |
| Size | 2.1 GB | 399.1 MB |
| Events in quadrant A | 14,458,636 | 2,758,621 |
| Events in quadrant B | 16,117,005 | 2,720,295 |
| Events in quadrant C | 15,228,357 | 2,633,995 |
| Events in quadrant D | 20,730,646 | 2,437,874 |
| Mode SS | |||
|---|---|---|---|
| Quadrant | BADHDUFLAG | Total packets | Discarded packets |
| A | 0 | 626 | 0 |
| B | 0 | 626 | 0 |
| C | 0 | 626 | 0 |
| D | 0 | 626 | 0 |
| Mode M9 | |||
|---|---|---|---|
| Quadrant | BADHDUFLAG | Total packets | Discarded packets |
| A | 0 | 42 | 0 |
| B | 0 | 42 | 0 |
| C | 0 | 42 | 0 |
| D | 0 | 42 | 0 |
| Mode M0 | |||
|---|---|---|---|
| Quadrant | BADHDUFLAG | Total packets | Discarded packets |
| A | 0 | 63339 | 7 |
| B | 0 | 67828 | 7 |
| C | 0 | 64921 | 7 |
| D | 0 | 82782 | 7 |
| Quadrant | Total seconds | Saturated seconds | Saturation percentage |
|---|---|---|---|
| A | 30899 | 277 | 0.896469% |
| B | 30899 | 512 | 1.657012% |
| C | 30899 | 404 | 1.307486% |
| D | 30899 | 2368 | 7.663678% |
Noise dominated data is calculated using 1-second bins in cleaned event files. If a bin has >2000 counts, and if more than 50% of those come from <1% of pixels, then it is considered to be noise-dominated and hence unusable.
| Quadrant | # 1 sec bins | Bins with >0 counts | Bins with >2000 counts | High rate bins dominated by noise | Noise dominated (total time) | Noise dominated (detector-on time) | Marked lightcurve |
|---|---|---|---|---|---|---|---|
| A | 34924 | 30906 | 7 | 7 | 0.02% | 0.02% | 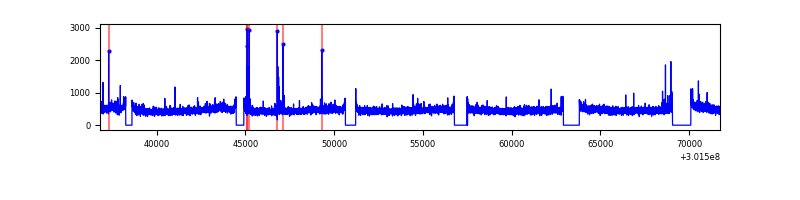 |
| B | 34924 | 30906 | 102 | 102 | 0.29% | 0.33% | 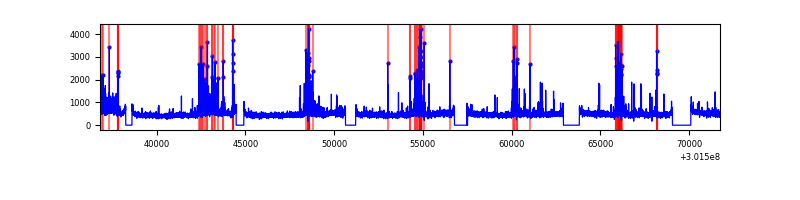 |
| C | 34924 | 30905 | 2 | 2 | 0.01% | 0.01% | 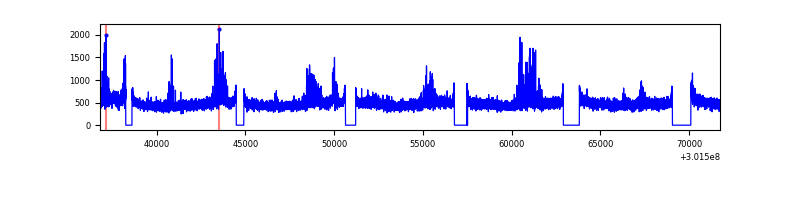 |
| D | 34924 | 30906 | 1482 | 1482 | 4.24% | 4.80% | 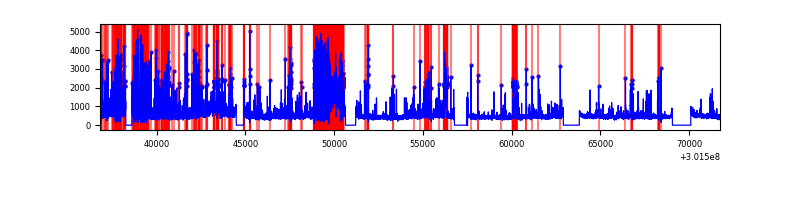 |
Top three noisy pixels from each quadrant. If the there are fewer than three noisy pixels in the level2.evt file, extra rows are filled as -1
| Pixel properties | Quadrant properties | ||||||
|---|---|---|---|---|---|---|---|
| Quadrant | DetID | PixID | Counts | Sigma | Mean | Median | Sigma |
| A | 5 | 16 | 107564 | 140.15 | 3719 | 3638 | 741.5 |
| A | 0 | 226 | 32212 | 38.53 | 3719 | 3638 | 741.5 |
| A | 3 | 137 | 30178 | 35.79 | 3719 | 3638 | 741.5 |
| B | 7 | 220 | 827491 | 1200.55 | 3677 | 3592 | 686.3 |
| B | 4 | 216 | 263954 | 379.39 | 3677 | 3592 | 686.3 |
| B | 0 | 197 | 185008 | 264.35 | 3677 | 3592 | 686.3 |
| C | 8 | 208 | 738435 | 888.28 | 3559 | 3582 | 827.3 |
| C | 14 | 238 | 553625 | 664.88 | 3559 | 3582 | 827.3 |
| C | 3 | 233 | 35124 | 38.13 | 3559 | 3582 | 827.3 |
| D | 1 | 20 | 3768140 | 4536.11 | 3446 | 3347 | 830.0 |
| D | 1 | 52 | 2122520 | 2553.34 | 3446 | 3347 | 830.0 |
| D | 5 | 222 | 603390 | 722.98 | 3446 | 3347 | 830.0 |
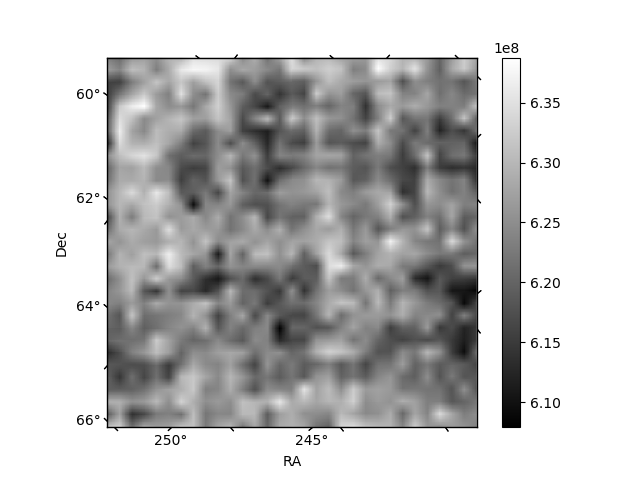
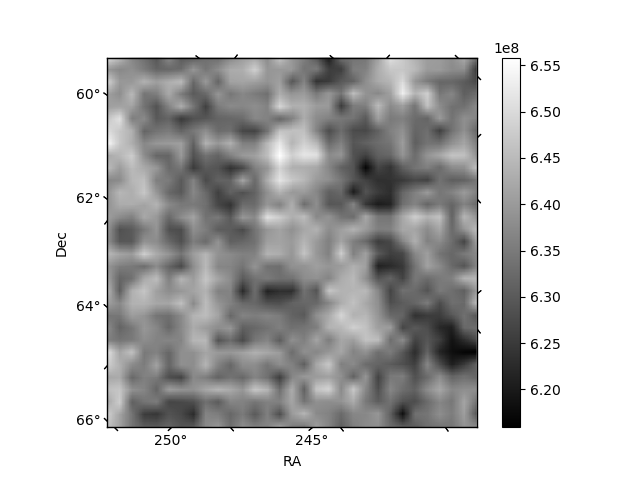
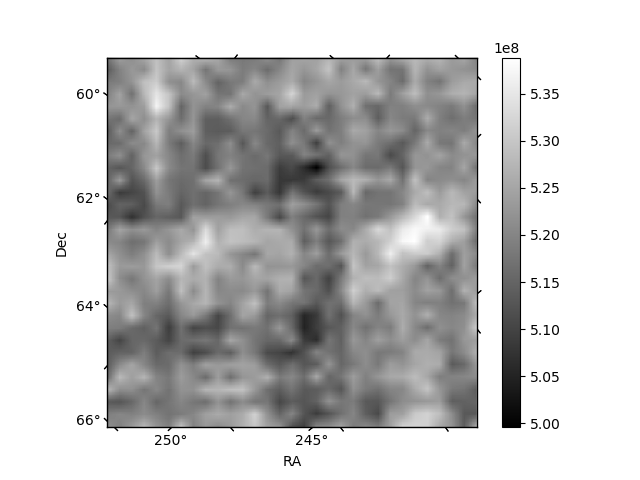
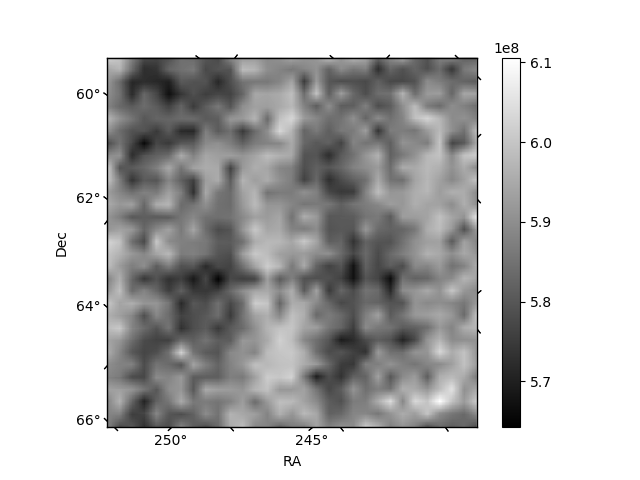
Histogram calculated using DETX and DETY for each event in the final _common_clean file
| Quadrant A | 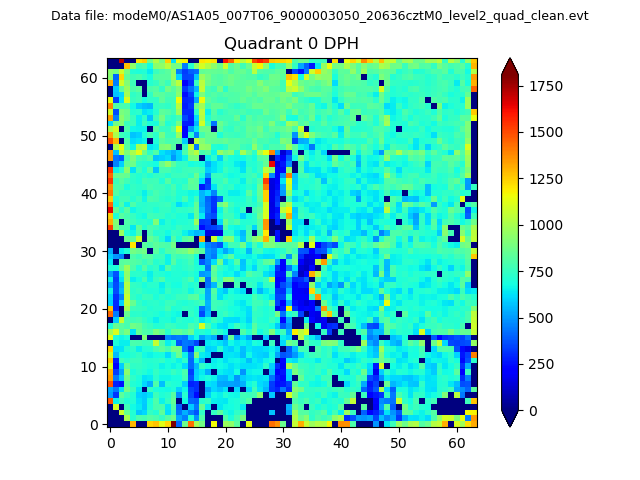 |
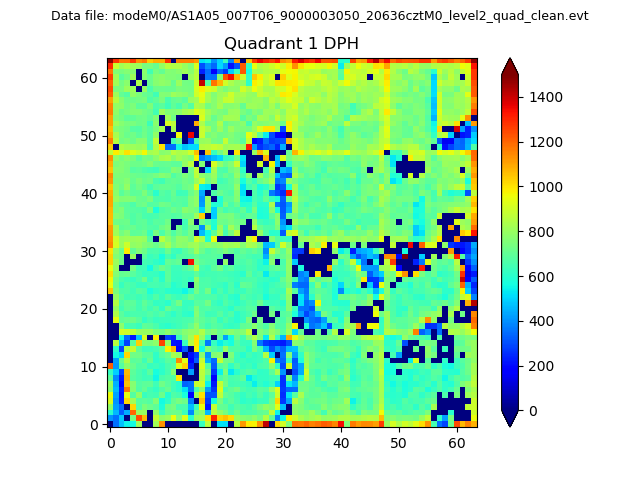 |
Quadrant B |
|---|---|---|---|
| Quadrant D |  |
 |
Quadrant C |
| Plot type | Count rate plots | Images |
|---|---|---|
| Comparison with Poisson distribution Blue bars denote a histogram of data divided into 1 sec bins. Red curve is a Poisson curve with rate = median count rate of data. |
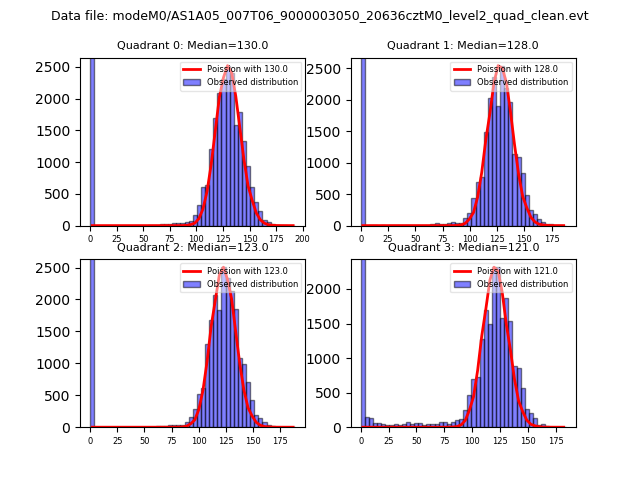 |
 |
| Quadrant-wise count rates Data is divided into 100 sec bins |
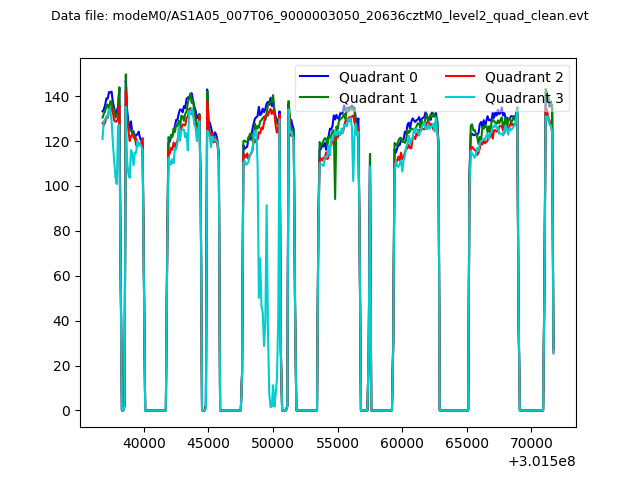 |
|
| Module-wise count rates for Quadrant A Data is divided into 100 sec bins |
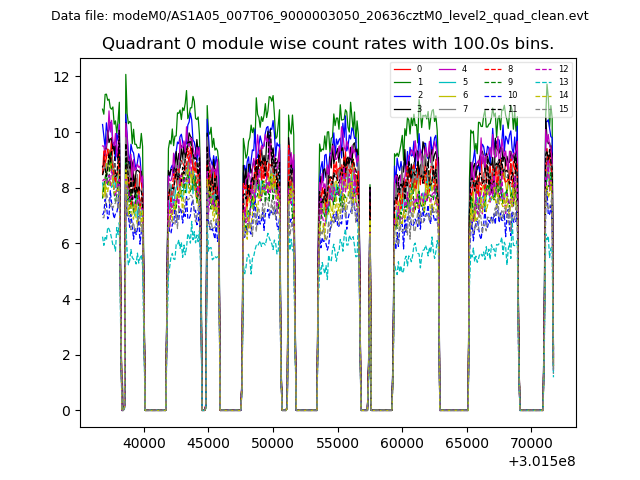 |
 |
| Module-wise count rates for Quadrant B Data is divided into 100 sec bins |
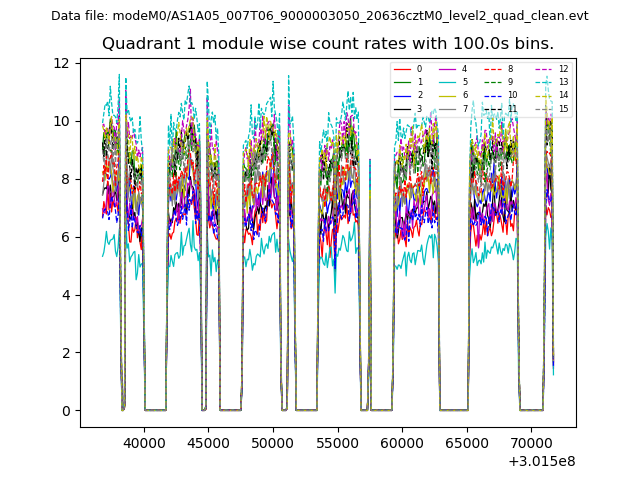 |
 |
| Module-wise count rates for Quadrant C Data is divided into 100 sec bins |
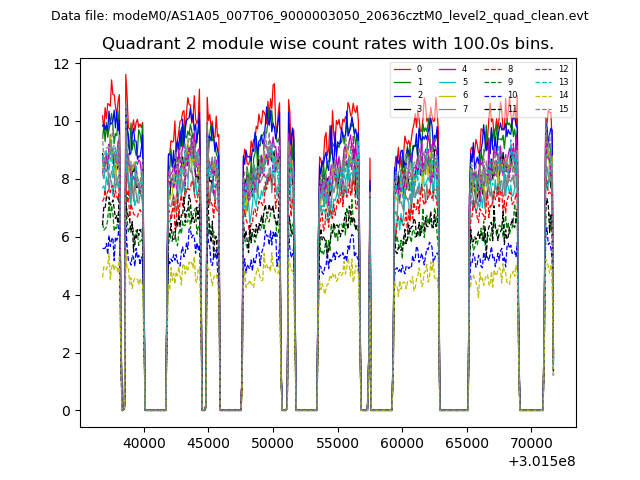 |
 |
| Module-wise count rates for Quadrant D Data is divided into 100 sec bins |
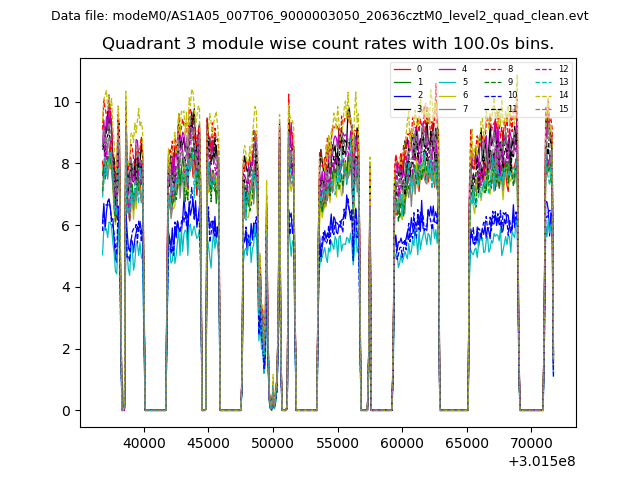 |
 |
| Parameter | Plot |
|---|---|
| CZT HV Monitor | 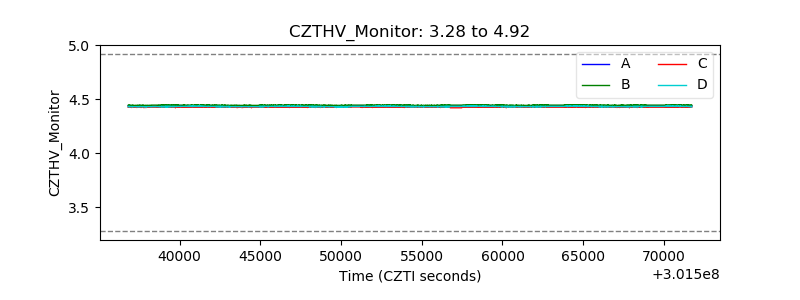 |
| D_VDD | 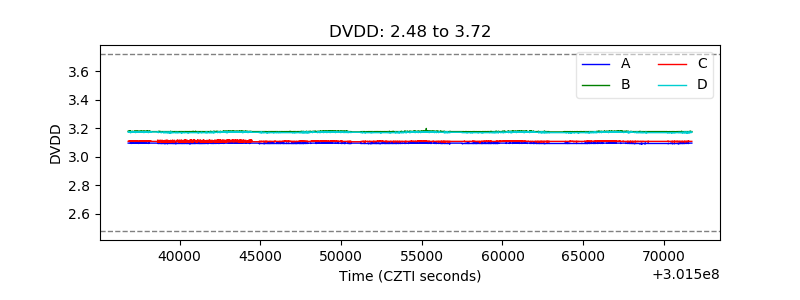 |
| Temperature 1 | 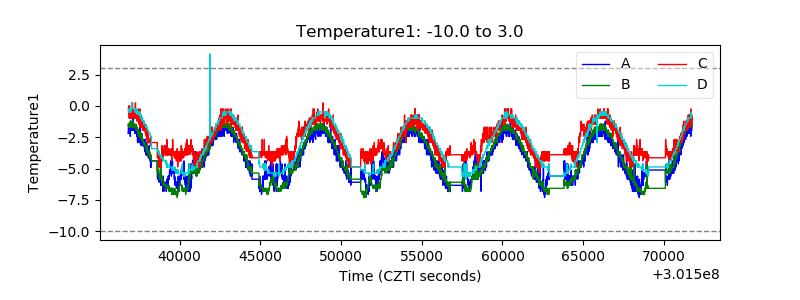 |
| Veto HV Monitor | 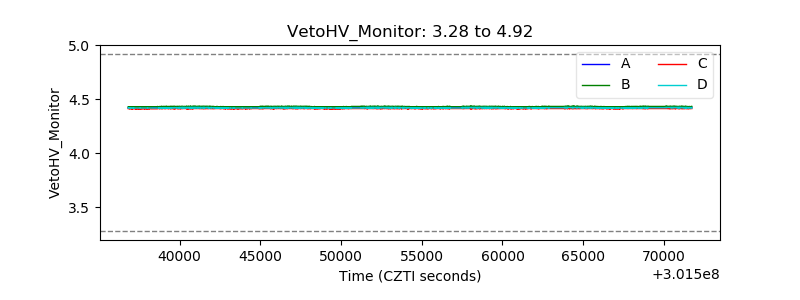 |
| Veto LLD | 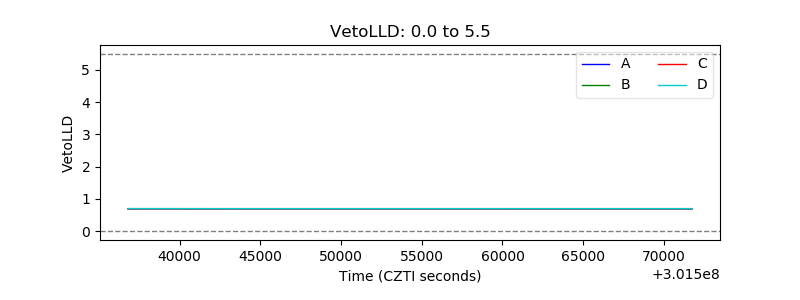 |
| Alpha Counter | 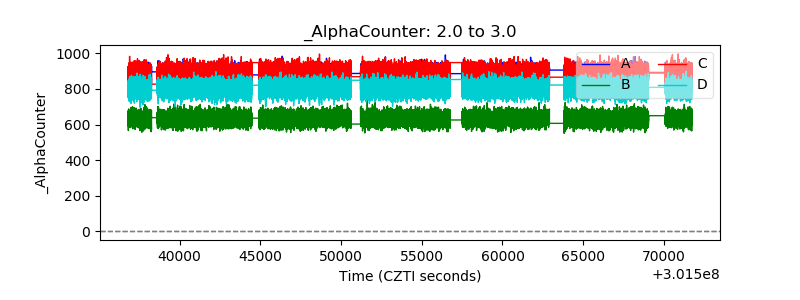 |
| _CPM_Rate | 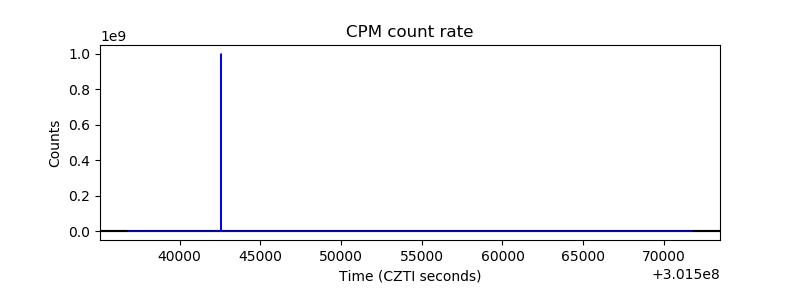 |
| CZT Counter | 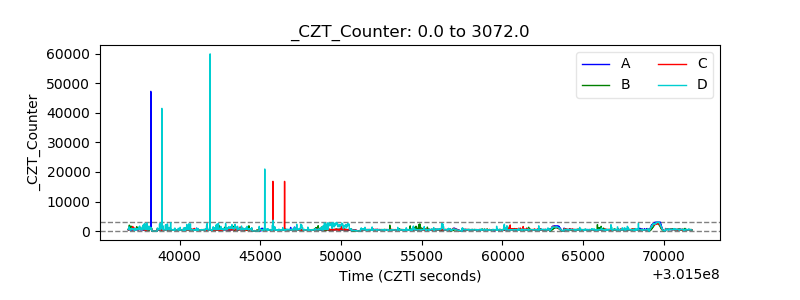 |
| +2.5 Volts monitor |  |
| +5 Volts monitor |  |
| _ROLL_ROT | 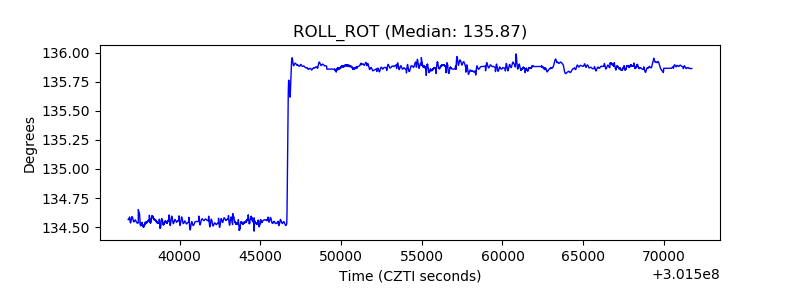 |
| _Roll_DEC | 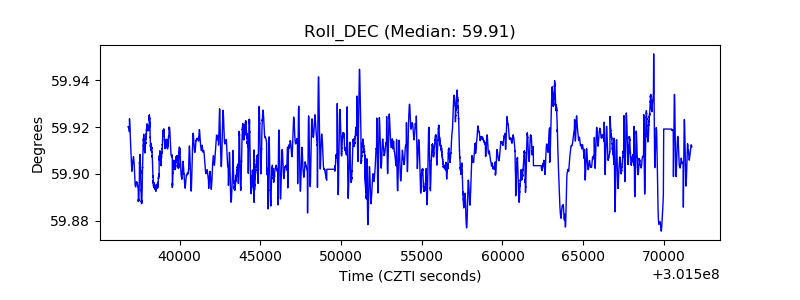 |
| _Roll_RA |  |
| Veto Counter | 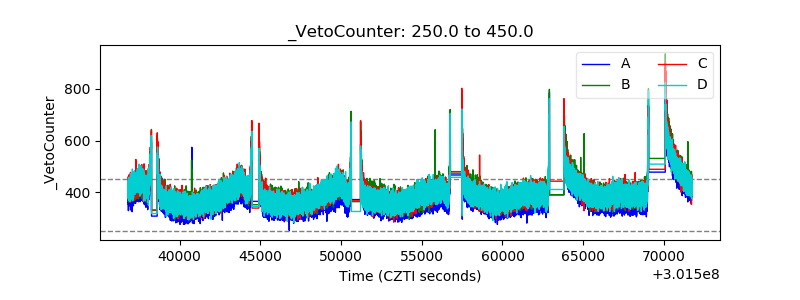 |