| Param | Original file | Final file |
|---|---|---|
| Filename | modeM0/AS1A05_007T06_9000003050_20638cztM0_level2.evt | modeM0/AS1A05_007T06_9000003050_20638cztM0_level2_quad_clean.evt |
| Size (bytes) | 462,435,840 | 105,022,080 |
| Size | 441.0 MB | 100.2 MB |
| Events in quadrant A | 3,308,277 | 709,527 |
| Events in quadrant B | 3,326,030 | 699,003 |
| Events in quadrant C | 3,232,406 | 667,358 |
| Events in quadrant D | 3,708,205 | 663,045 |
| Mode SS | |||
|---|---|---|---|
| Quadrant | BADHDUFLAG | Total packets | Discarded packets |
| A | 0 | 130 | 0 |
| B | 0 | 130 | 0 |
| C | 0 | 130 | 0 |
| D | 0 | 130 | 0 |
| Mode M9 | |||
|---|---|---|---|
| Quadrant | BADHDUFLAG | Total packets | Discarded packets |
| A | 0 | 11 | 0 |
| B | 0 | 11 | 0 |
| C | 0 | 11 | 0 |
| D | 0 | 11 | 0 |
| Mode M0 | |||
|---|---|---|---|
| Quadrant | BADHDUFLAG | Total packets | Discarded packets |
| A | 0 | 13853 | 1 |
| B | 0 | 13850 | 1 |
| C | 0 | 13482 | 1 |
| D | 0 | 15153 | 1 |
| Quadrant | Total seconds | Saturated seconds | Saturation percentage |
|---|---|---|---|
| A | 6327 | 90 | 1.422475% |
| B | 6327 | 95 | 1.501502% |
| C | 6326 | 109 | 1.723048% |
| D | 6326 | 186 | 2.940247% |
Noise dominated data is calculated using 1-second bins in cleaned event files. If a bin has >2000 counts, and if more than 50% of those come from <1% of pixels, then it is considered to be noise-dominated and hence unusable.
| Quadrant | # 1 sec bins | Bins with >0 counts | Bins with >2000 counts | High rate bins dominated by noise | Noise dominated (total time) | Noise dominated (detector-on time) | Marked lightcurve |
|---|---|---|---|---|---|---|---|
| A | 7457 | 6327 | 6 | 6 | 0.08% | 0.09% | 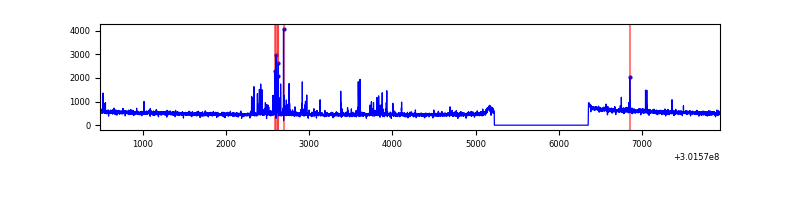 |
| B | 7457 | 6327 | 9 | 9 | 0.12% | 0.14% | 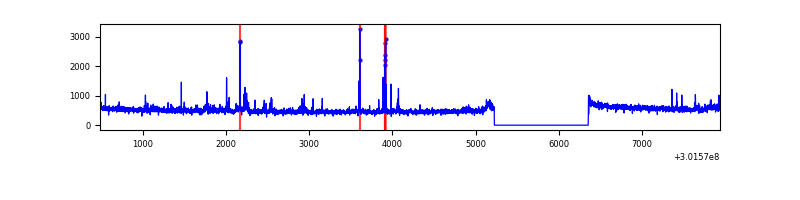 |
| C | 7456 | 6326 | 0 | 0 | 0.00% | 0.00% | 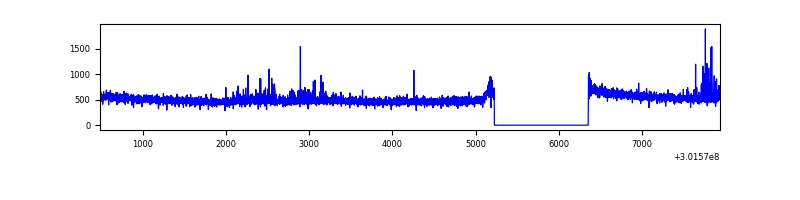 |
| D | 7456 | 6326 | 74 | 74 | 0.99% | 1.17% | 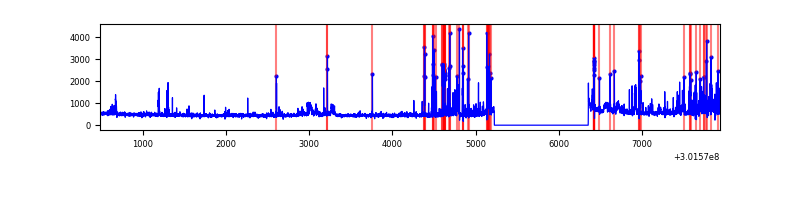 |
Top three noisy pixels from each quadrant. If the there are fewer than three noisy pixels in the level2.evt file, extra rows are filled as -1
| Pixel properties | Quadrant properties | ||||||
|---|---|---|---|---|---|---|---|
| Quadrant | DetID | PixID | Counts | Sigma | Mean | Median | Sigma |
| A | 5 | 16 | 164250 | 1009.63 | 817 | 803 | 161.9 |
| A | 0 | 226 | 7350 | 40.44 | 817 | 803 | 161.9 |
| A | 12 | 194 | 6514 | 35.28 | 817 | 803 | 161.9 |
| B | 0 | 197 | 48563 | 319.96 | 798 | 780 | 149.3 |
| B | 0 | 190 | 32152 | 210.07 | 798 | 780 | 149.3 |
| B | 4 | 216 | 22253 | 143.79 | 798 | 780 | 149.3 |
| C | 14 | 238 | 121877 | 679.66 | 769 | 775 | 178.2 |
| C | 8 | 208 | 106408 | 592.85 | 769 | 775 | 178.2 |
| C | 13 | 61 | 5397 | 25.94 | 769 | 775 | 178.2 |
| D | 1 | 52 | 504681 | 2683.97 | 782 | 760 | 187.8 |
| D | 13 | 153 | 68503 | 360.81 | 782 | 760 | 187.8 |
| D | 1 | 20 | 60143 | 316.28 | 782 | 760 | 187.8 |
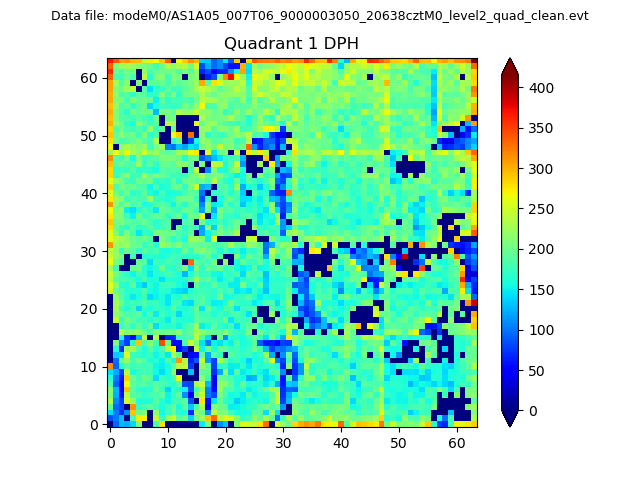
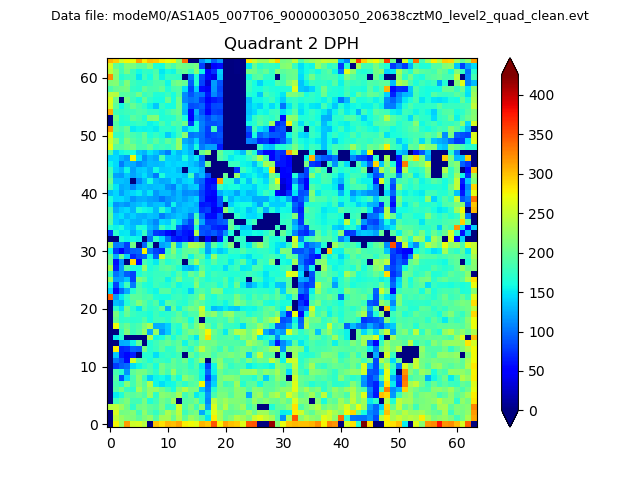
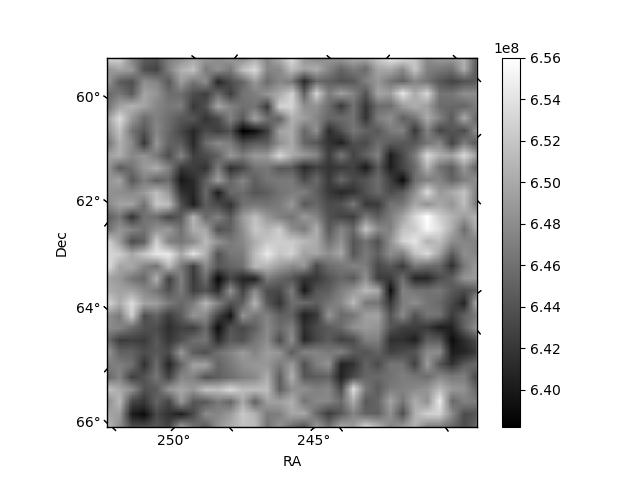
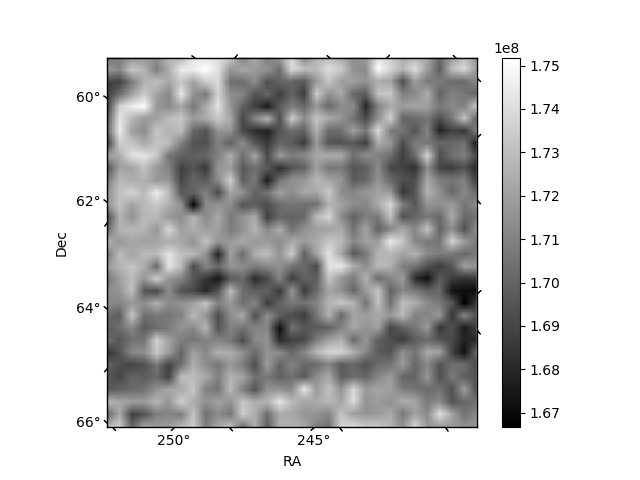
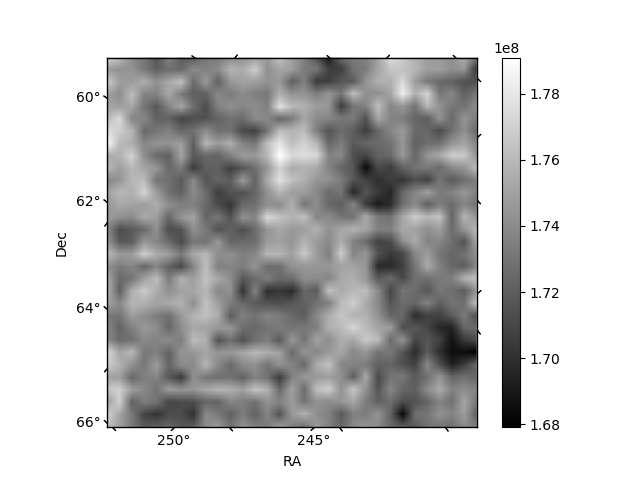
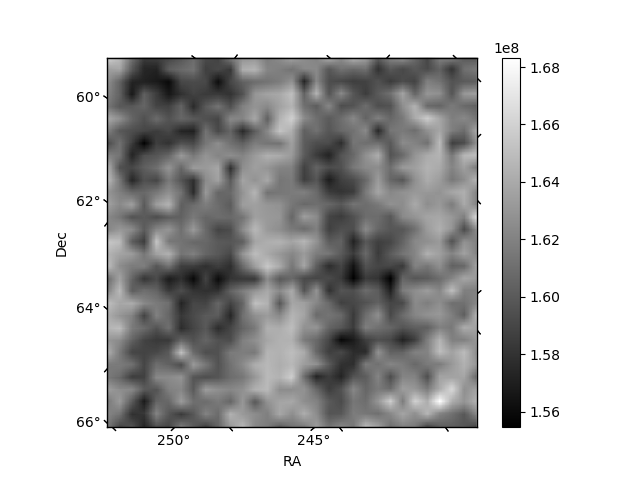
Histogram calculated using DETX and DETY for each event in the final _common_clean file
| Quadrant A |  |
 |
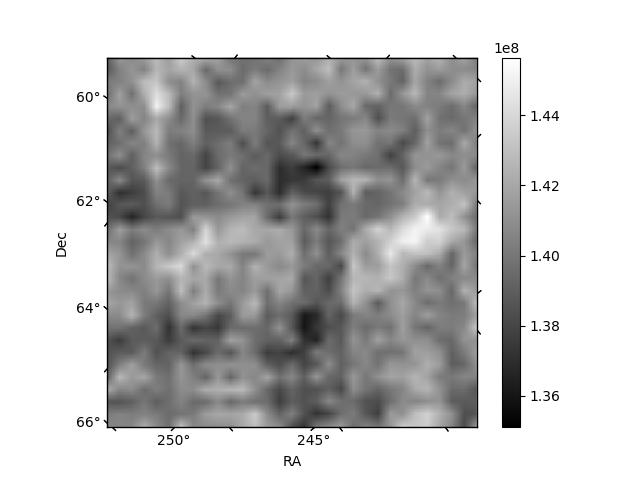
Quadrant B |
|---|---|---|---|
| Quadrant D | 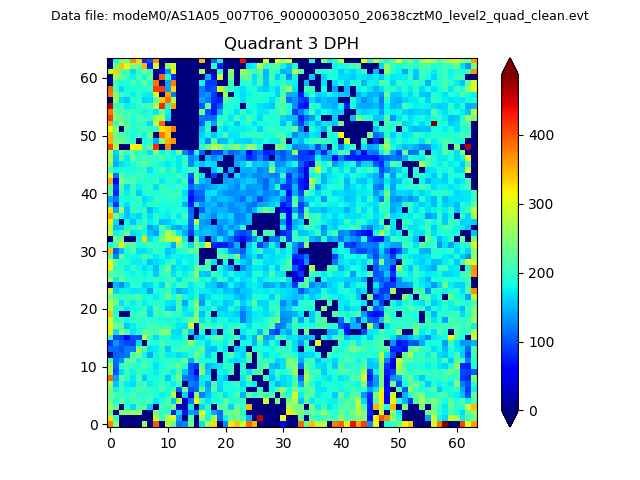 |
 |
Quadrant C |
| Plot type | Count rate plots | Images |
|---|---|---|
| Comparison with Poisson distribution Blue bars denote a histogram of data divided into 1 sec bins. Red curve is a Poisson curve with rate = median count rate of data. |
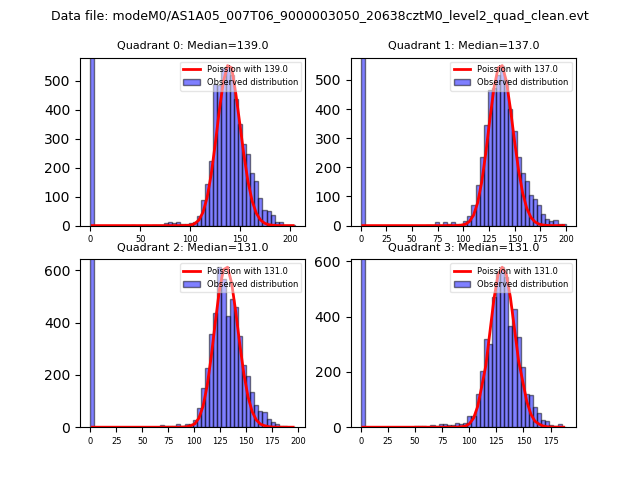 |
 |
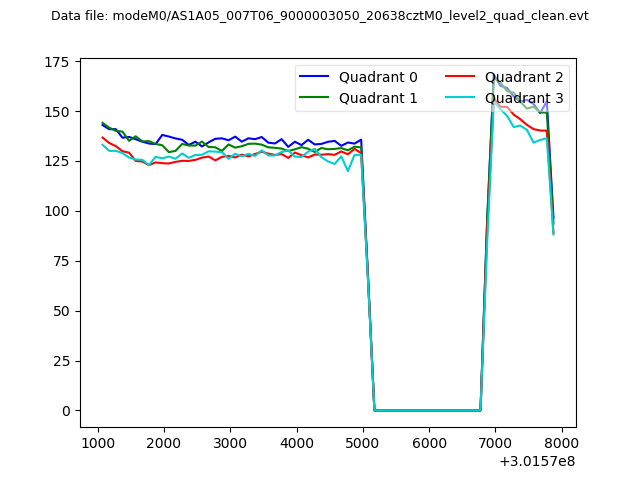
| Quadrant-wise count rates Data is divided into 100 sec bins |
 |
|
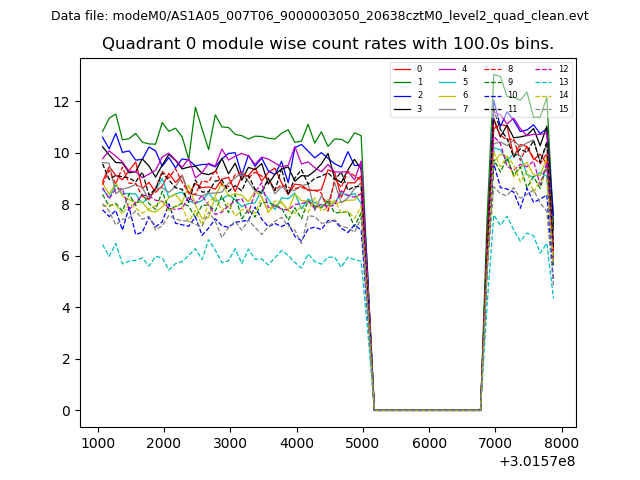
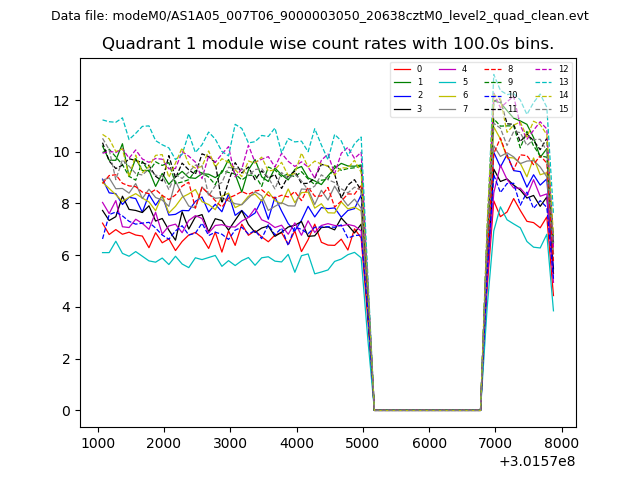
| Module-wise count rates for Quadrant A Data is divided into 100 sec bins |
 |
 |
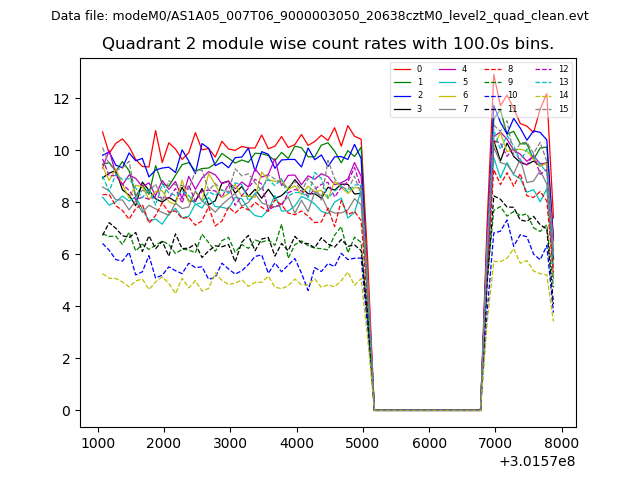
| Module-wise count rates for Quadrant B Data is divided into 100 sec bins |
 |
 |
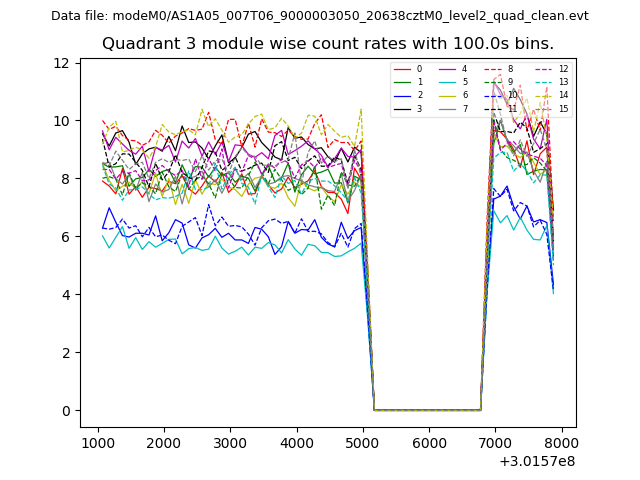
| Module-wise count rates for Quadrant C Data is divided into 100 sec bins |
 |
 |
| Module-wise count rates for Quadrant D Data is divided into 100 sec bins |
 |
 |
| Parameter | Plot |
|---|---|
| CZT HV Monitor | 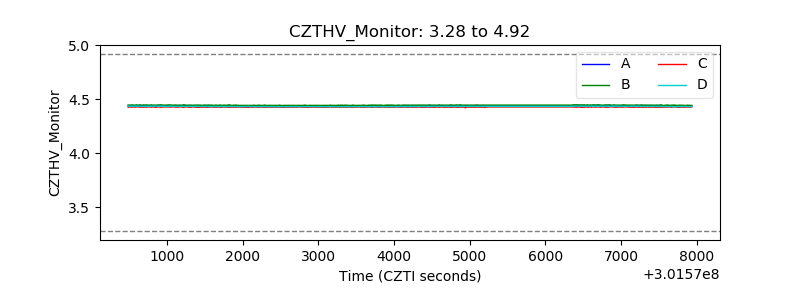 |
| D_VDD | 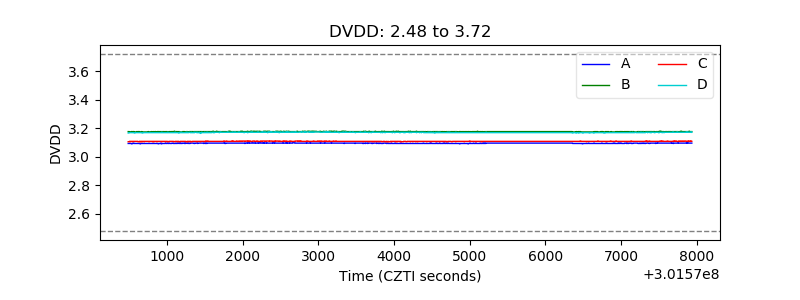 |
| Temperature 1 | 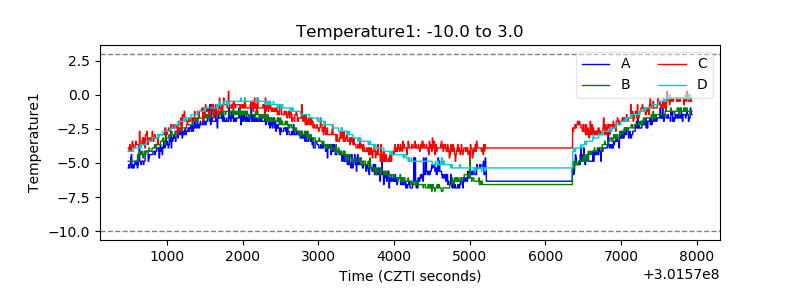 |
| Veto HV Monitor | 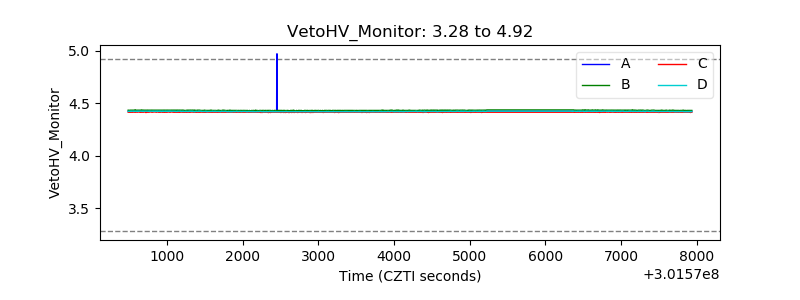 |
| Veto LLD | 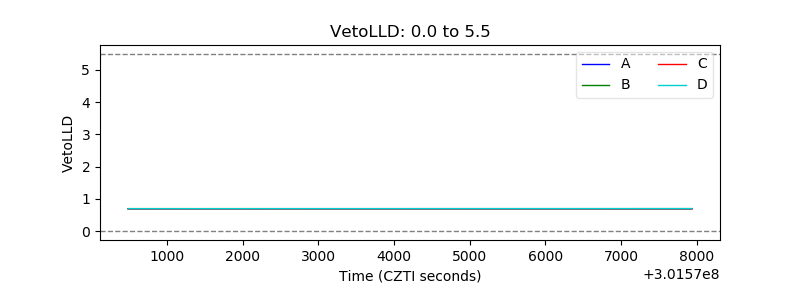 |
| Alpha Counter |  |
| _CPM_Rate | 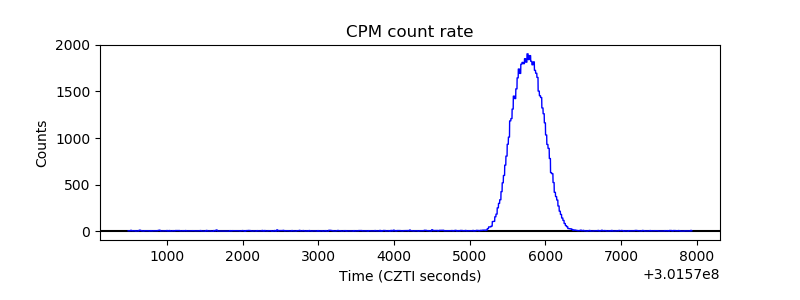 |
| CZT Counter | 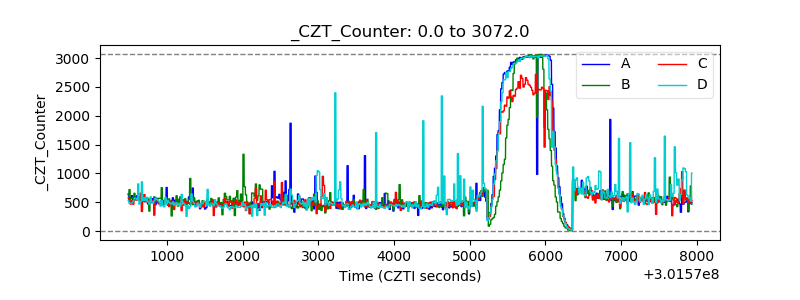 |
| +2.5 Volts monitor |  |
| +5 Volts monitor |  |
| _ROLL_ROT | 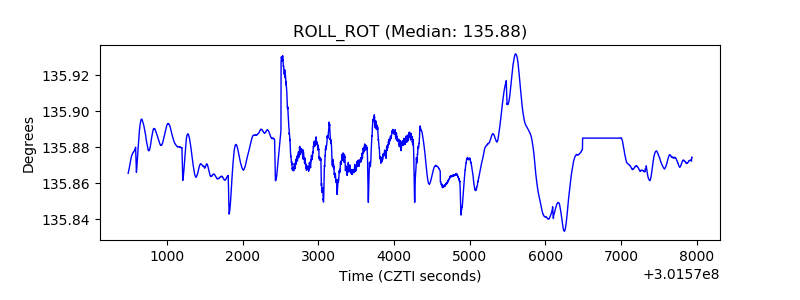 |
| _Roll_DEC | 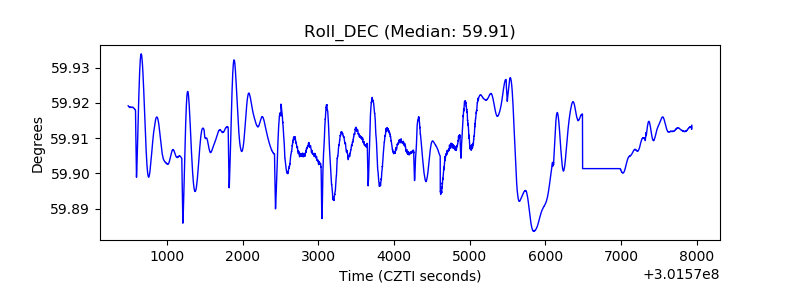 |
| _Roll_RA | 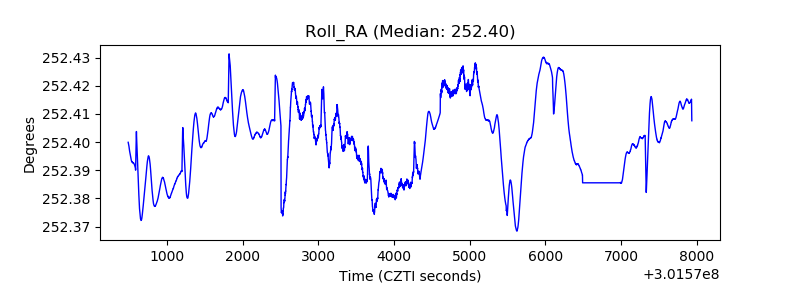 |
| Veto Counter | 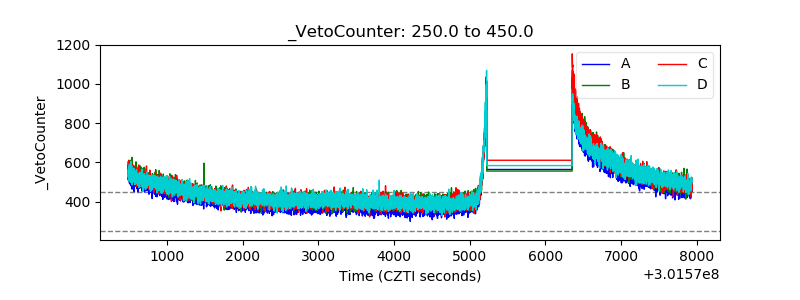 |