| Param | Original file | Final file |
|---|---|---|
| Filename | modeM0/AS1A05_007T06_9000003050_20640cztM0_level2.evt | modeM0/AS1A05_007T06_9000003050_20640cztM0_level2_quad_clean.evt |
| Size (bytes) | 504,005,760 | 115,453,440 |
| Size | 480.7 MB | 110.1 MB |
| Events in quadrant A | 3,173,809 | 799,861 |
| Events in quadrant B | 3,400,410 | 787,410 |
| Events in quadrant C | 3,286,211 | 763,515 |
| Events in quadrant D | 5,008,228 | 738,532 |
| Mode SS | |||
|---|---|---|---|
| Quadrant | BADHDUFLAG | Total packets | Discarded packets |
| A | 0 | 118 | 0 |
| B | 0 | 118 | 0 |
| C | 0 | 118 | 0 |
| D | 0 | 118 | 0 |
| Mode M9 | |||
|---|---|---|---|
| Quadrant | BADHDUFLAG | Total packets | Discarded packets |
| A | 0 | 13 | 0 |
| B | 0 | 13 | 0 |
| C | 0 | 13 | 0 |
| D | 0 | 13 | 0 |
| Mode M0 | |||
|---|---|---|---|
| Quadrant | BADHDUFLAG | Total packets | Discarded packets |
| A | 0 | 13286 | 2 |
| B | 0 | 13967 | 1 |
| C | 0 | 13354 | 1 |
| D | 0 | 18917 | 1 |
| Quadrant | Total seconds | Saturated seconds | Saturation percentage |
|---|---|---|---|
| A | 5832 | 115 | 1.971879% |
| B | 5832 | 130 | 2.229081% |
| C | 5832 | 115 | 1.971879% |
| D | 5832 | 383 | 6.567215% |
Noise dominated data is calculated using 1-second bins in cleaned event files. If a bin has >2000 counts, and if more than 50% of those come from <1% of pixels, then it is considered to be noise-dominated and hence unusable.
| Quadrant | # 1 sec bins | Bins with >0 counts | Bins with >2000 counts | High rate bins dominated by noise | Noise dominated (total time) | Noise dominated (detector-on time) | Marked lightcurve |
|---|---|---|---|---|---|---|---|
| A | 7132 | 5833 | 9 | 9 | 0.13% | 0.15% | 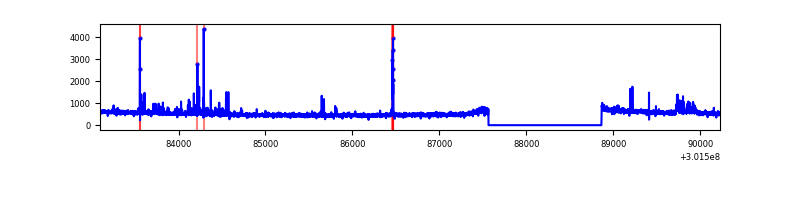 |
| B | 7132 | 5833 | 22 | 22 | 0.31% | 0.38% | 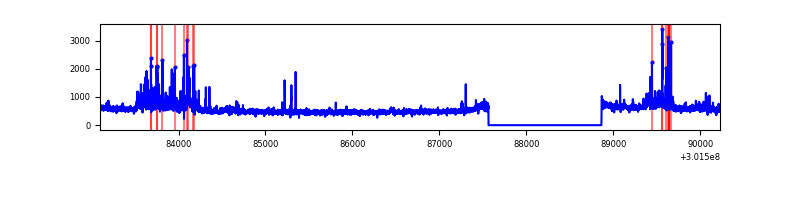 |
| C | 7132 | 5832 | 4 | 4 | 0.06% | 0.07% | 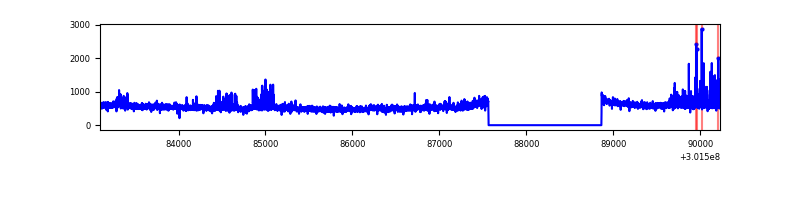 |
| D | 7132 | 5832 | 303 | 303 | 4.25% | 5.20% | 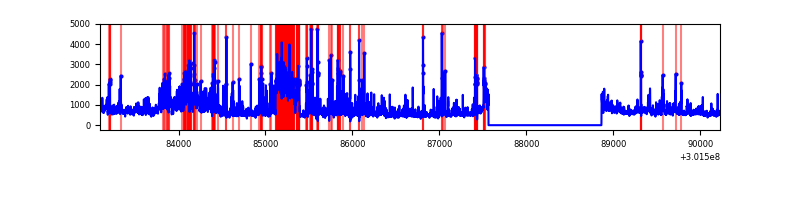 |
Top three noisy pixels from each quadrant. If the there are fewer than three noisy pixels in the level2.evt file, extra rows are filled as -1
| Pixel properties | Quadrant properties | ||||||
|---|---|---|---|---|---|---|---|
| Quadrant | DetID | PixID | Counts | Sigma | Mean | Median | Sigma |
| A | 5 | 16 | 132645 | 861.48 | 777 | 763 | 153.1 |
| A | 12 | 16 | 45440 | 291.84 | 777 | 763 | 153.1 |
| A | 12 | 194 | 14007 | 86.51 | 777 | 763 | 153.1 |
| B | 7 | 220 | 254562 | 1824.3 | 760 | 743 | 139.1 |
| B | 0 | 197 | 31307 | 219.68 | 760 | 743 | 139.1 |
| B | 0 | 190 | 28153 | 197.01 | 760 | 743 | 139.1 |
| C | 8 | 208 | 185752 | 1086.32 | 745 | 753 | 170.3 |
| C | 14 | 238 | 116424 | 679.23 | 745 | 753 | 170.3 |
| C | 7 | 247 | 73351 | 426.3 | 745 | 753 | 170.3 |
| D | 12 | 227 | 933376 | 5260.48 | 743 | 726 | 177.3 |
| D | 1 | 52 | 917833 | 5172.81 | 743 | 726 | 177.3 |
| D | 1 | 20 | 135897 | 762.41 | 743 | 726 | 177.3 |
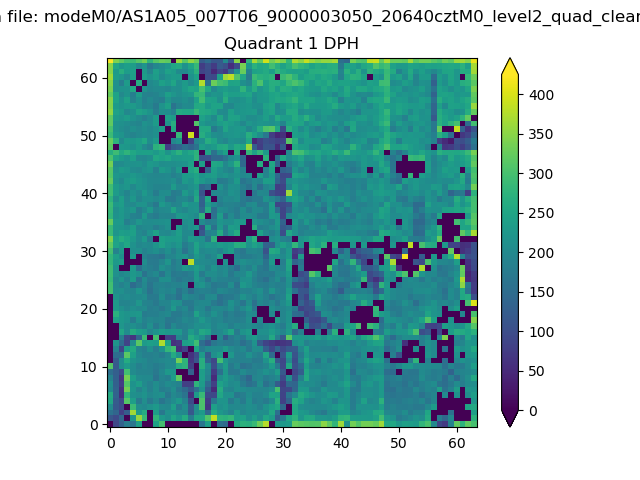
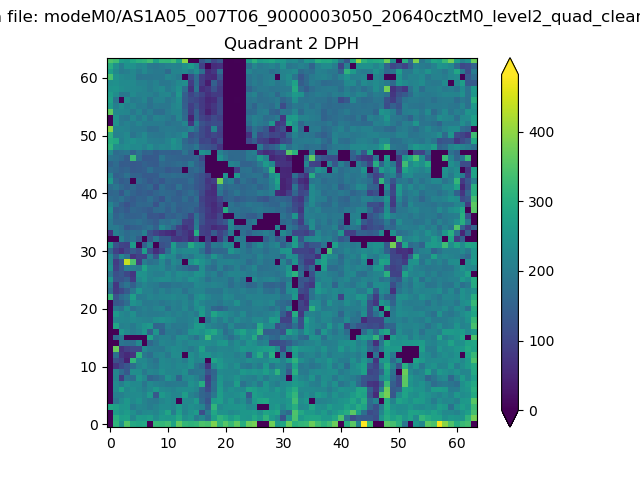
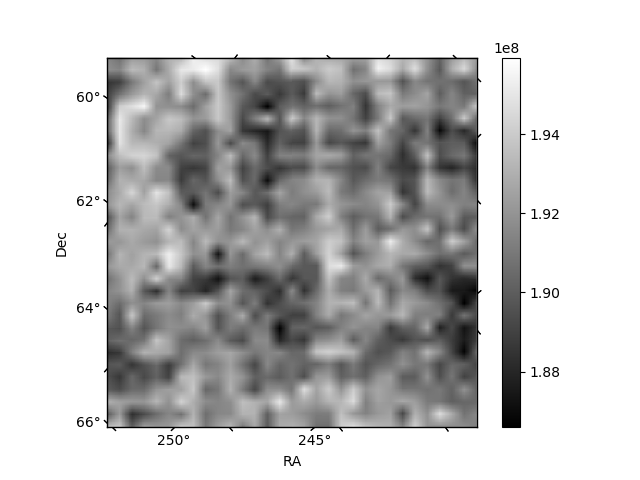
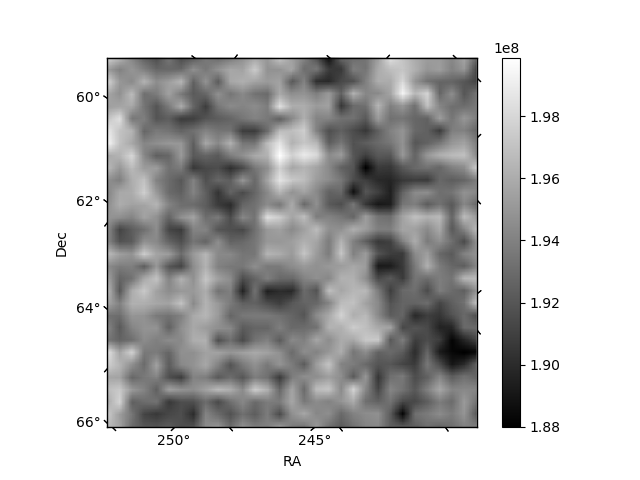
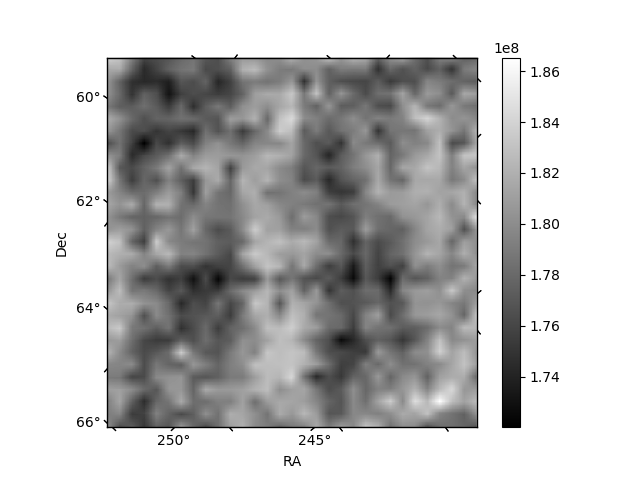
Histogram calculated using DETX and DETY for each event in the final _common_clean file
| Quadrant A |  |
 |
Quadrant B |
|---|---|---|---|
| Quadrant D | 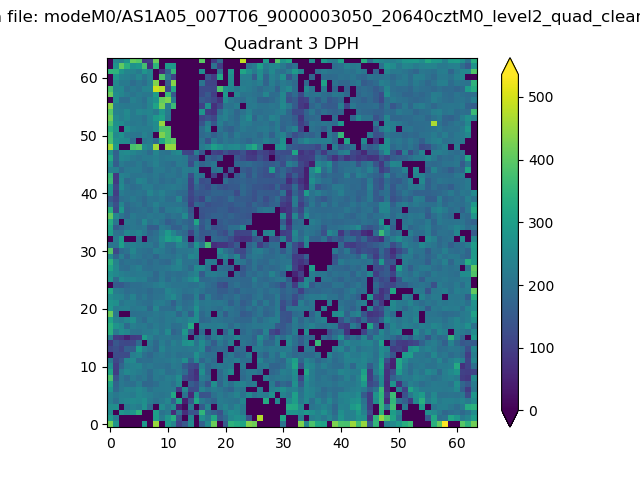 |
 |
Quadrant C |
| Plot type | Count rate plots | Images |
|---|---|---|
| Comparison with Poisson distribution Blue bars denote a histogram of data divided into 1 sec bins. Red curve is a Poisson curve with rate = median count rate of data. |
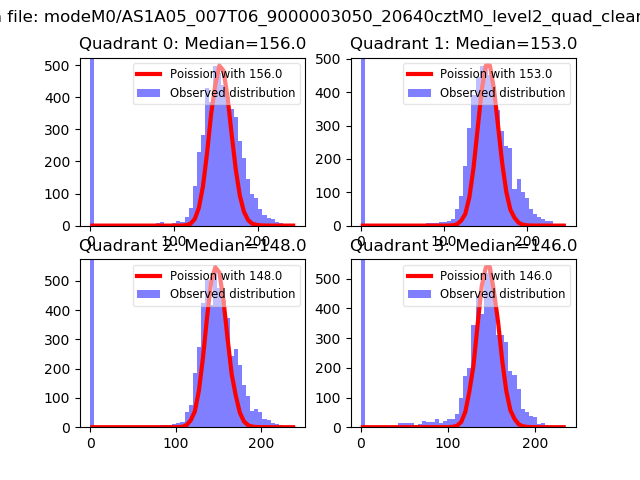 |
 |
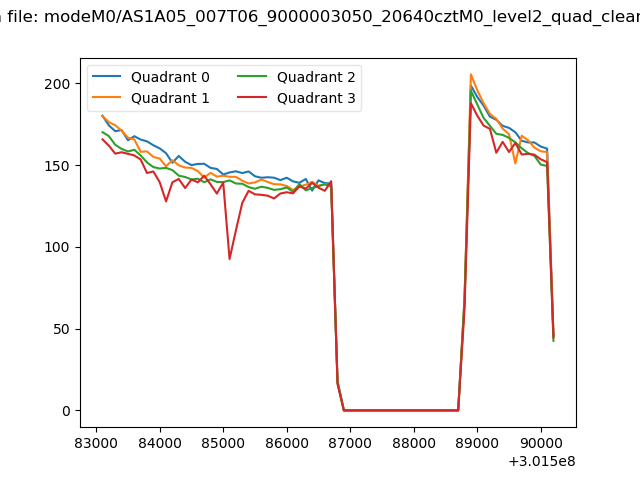
| Quadrant-wise count rates Data is divided into 100 sec bins |
 |
|
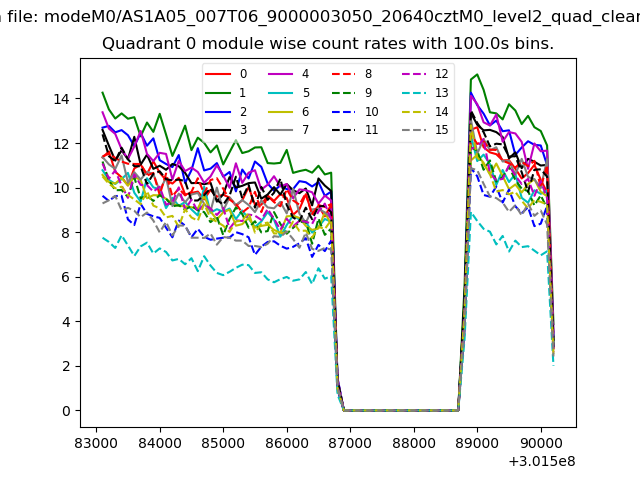
| Module-wise count rates for Quadrant A Data is divided into 100 sec bins |
 |
 |
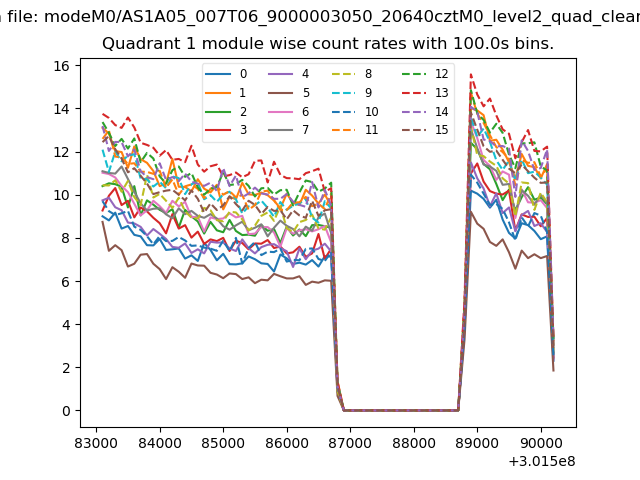
| Module-wise count rates for Quadrant B Data is divided into 100 sec bins |
 |
 |
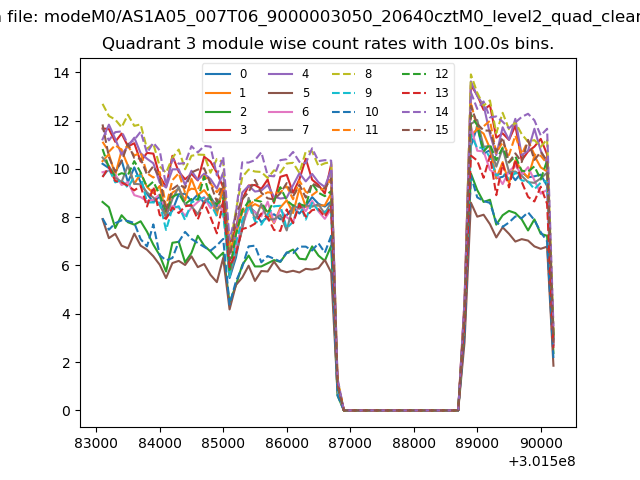
| Module-wise count rates for Quadrant C Data is divided into 100 sec bins |
 |
 |
| Module-wise count rates for Quadrant D Data is divided into 100 sec bins |
 |
 |
| Parameter | Plot |
|---|---|
| CZT HV Monitor | 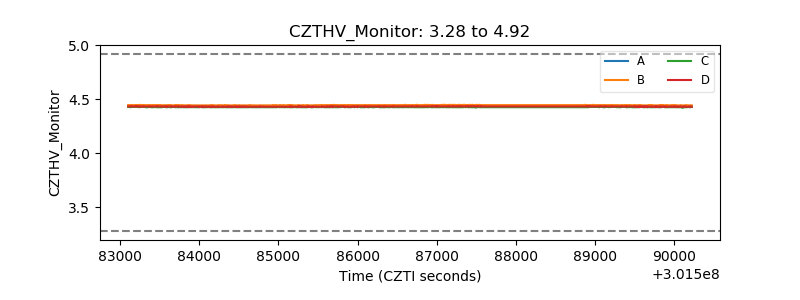 |
| D_VDD |  |
| Temperature 1 | 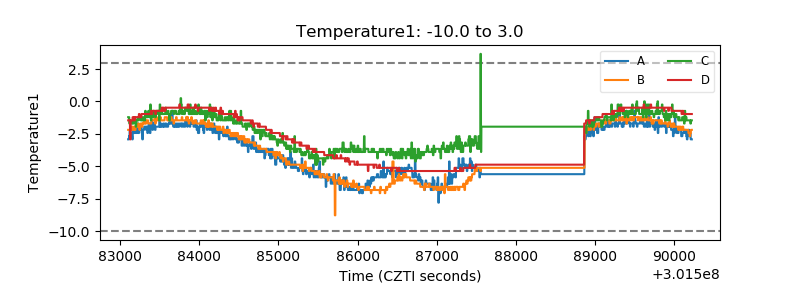 |
| Veto HV Monitor | 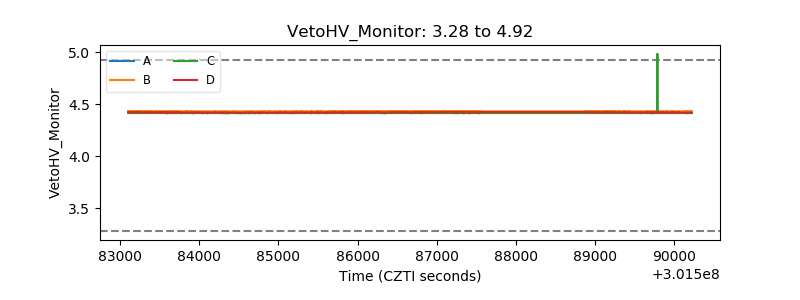 |
| Veto LLD | 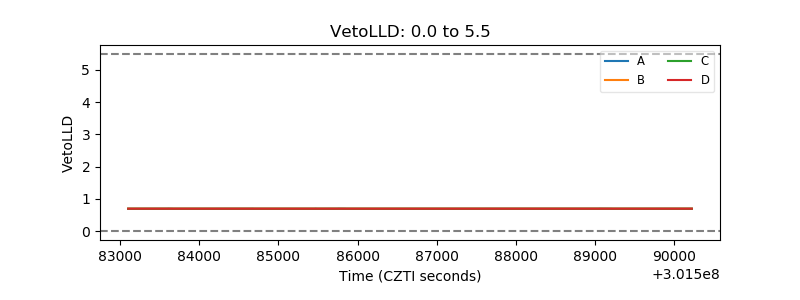 |
| Alpha Counter | 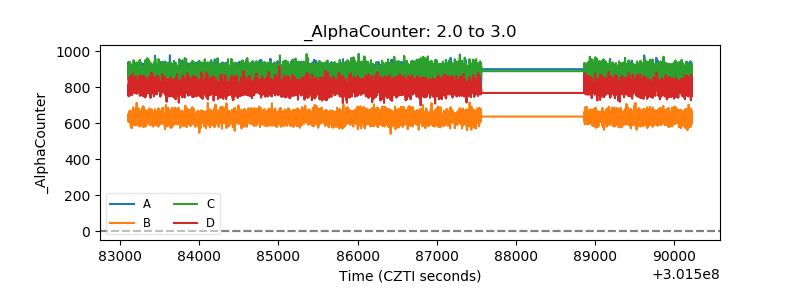 |
| _CPM_Rate | 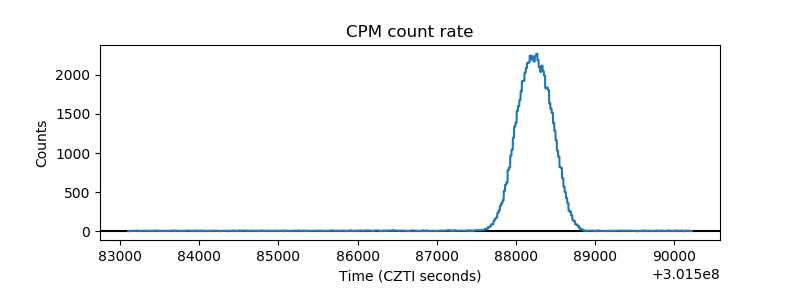 |
| CZT Counter | 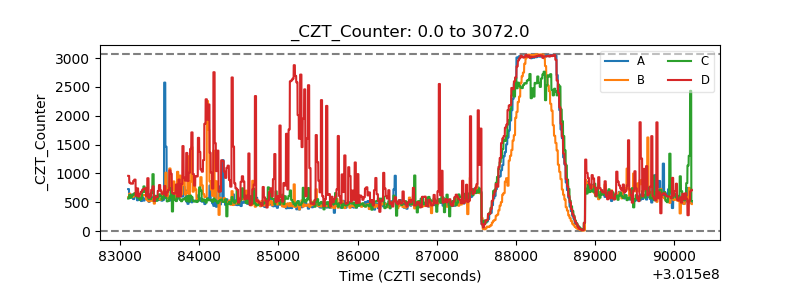 |
| +2.5 Volts monitor | 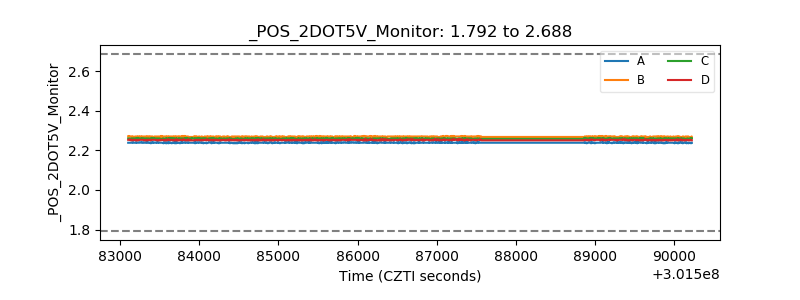 |
| +5 Volts monitor |  |
| _ROLL_ROT | 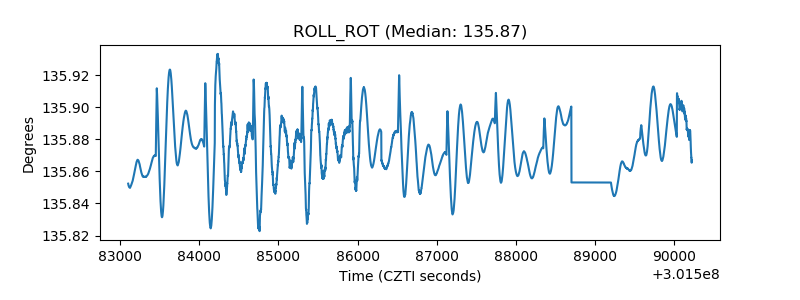 |
| _Roll_DEC | 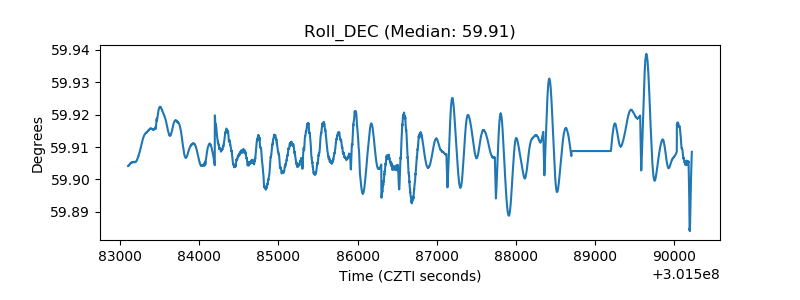 |
| _Roll_RA |  |
| Veto Counter | 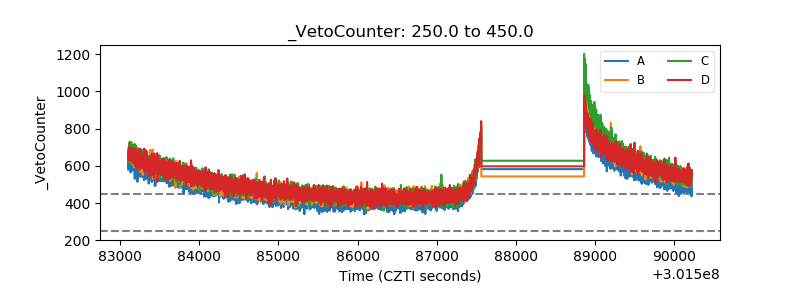 |