| Param | Original file | Final file |
|---|---|---|
| Filename | modeM0/AS1A05_007T06_9000003050_20641cztM0_level2.evt | modeM0/AS1A05_007T06_9000003050_20641cztM0_level2_quad_clean.evt |
| Size (bytes) | 135,838,080 | 36,956,160 |
| Size | 129.5 MB | 35.2 MB |
| Events in quadrant A | 904,234 | 258,712 |
| Events in quadrant B | 990,837 | 253,325 |
| Events in quadrant C | 977,787 | 246,277 |
| Events in quadrant D | 1,130,842 | 243,621 |
| Mode SS | |||
|---|---|---|---|
| Quadrant | BADHDUFLAG | Total packets | Discarded packets |
| A | 0 | 32 | 0 |
| B | 0 | 32 | 0 |
| C | 0 | 32 | 0 |
| D | 0 | 32 | 0 |
| Mode M0 | |||
|---|---|---|---|
| Quadrant | BADHDUFLAG | Total packets | Discarded packets |
| A | 0 | 3694 | 0 |
| B | 0 | 3963 | 0 |
| C | 0 | 3900 | 0 |
| D | 0 | 4465 | 0 |
| Quadrant | Total seconds | Saturated seconds | Saturation percentage |
|---|---|---|---|
| A | 1584 | 6 | 0.378788% |
| B | 1584 | 26 | 1.641414% |
| C | 1584 | 18 | 1.136364% |
| D | 1584 | 28 | 1.767677% |
Noise dominated data is calculated using 1-second bins in cleaned event files. If a bin has >2000 counts, and if more than 50% of those come from <1% of pixels, then it is considered to be noise-dominated and hence unusable.
| Quadrant | # 1 sec bins | Bins with >0 counts | Bins with >2000 counts | High rate bins dominated by noise | Noise dominated (total time) | Noise dominated (detector-on time) | Marked lightcurve |
|---|---|---|---|---|---|---|---|
| A | 1584 | 1584 | 0 | 0 | 0.00% | 0.00% | 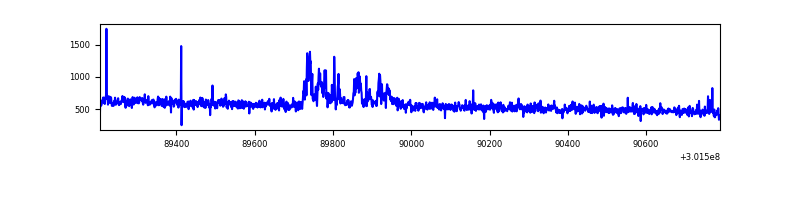 |
| B | 1584 | 1584 | 13 | 13 | 0.82% | 0.82% | 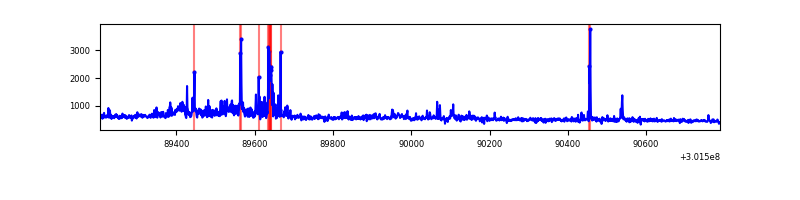 |
| C | 1584 | 1584 | 4 | 4 | 0.25% | 0.25% | 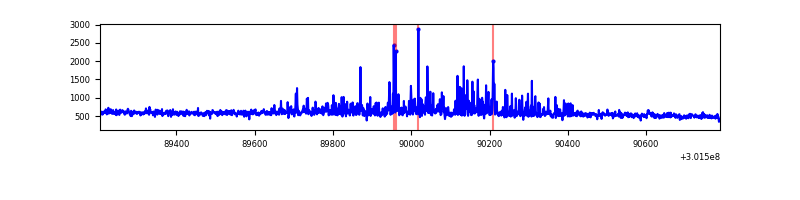 |
| D | 1584 | 1584 | 17 | 17 | 1.07% | 1.07% | 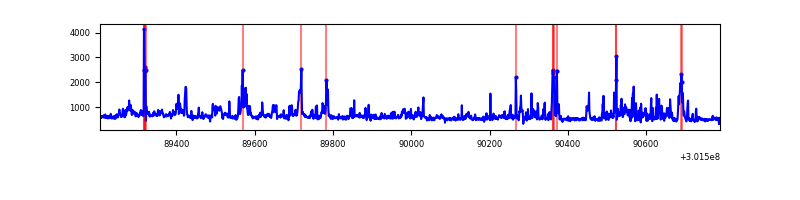 |
Top three noisy pixels from each quadrant. If the there are fewer than three noisy pixels in the level2.evt file, extra rows are filled as -1
| Pixel properties | Quadrant properties | ||||||
|---|---|---|---|---|---|---|---|
| Quadrant | DetID | PixID | Counts | Sigma | Mean | Median | Sigma |
| A | 12 | 16 | 45240 | 1007.38 | 219 | 214 | 44.7 |
| A | 12 | 194 | 10144 | 222.17 | 219 | 214 | 44.7 |
| A | 5 | 16 | 5330 | 114.46 | 219 | 214 | 44.7 |
| B | 7 | 220 | 88857 | 2163.62 | 212 | 207 | 41.0 |
| B | 0 | 190 | 18637 | 449.81 | 212 | 207 | 41.0 |
| B | 15 | 36 | 9515 | 227.17 | 212 | 207 | 41.0 |
| C | 8 | 208 | 122687 | 2496.87 | 210 | 211 | 49.1 |
| C | 14 | 238 | 32939 | 667.21 | 210 | 211 | 49.1 |
| C | 3 | 233 | 2276 | 42.1 | 210 | 211 | 49.1 |
| D | 1 | 52 | 111165 | 2072.73 | 216 | 210 | 53.5 |
| D | 12 | 227 | 75961 | 1415.09 | 216 | 210 | 53.5 |
| D | 7 | 238 | 36655 | 680.82 | 216 | 210 | 53.5 |
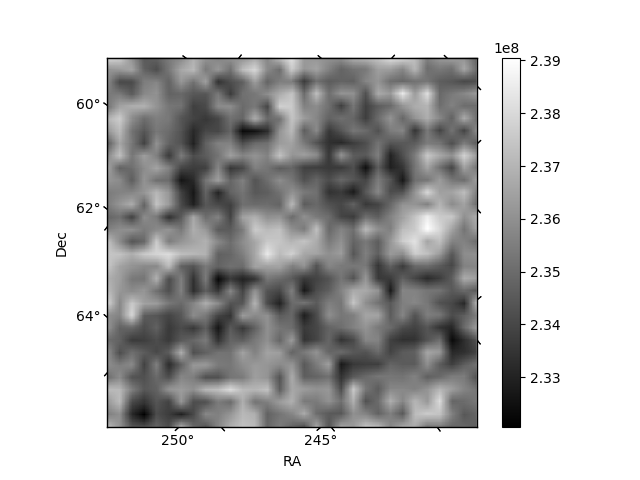
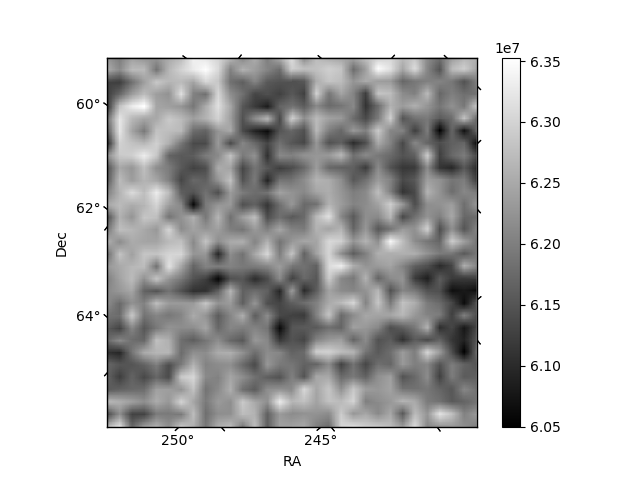
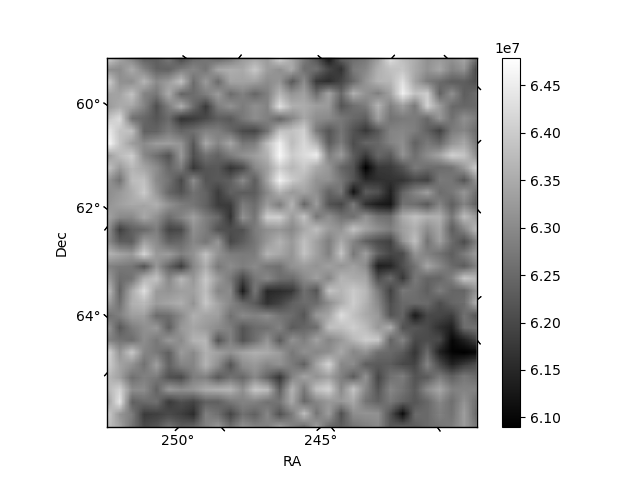
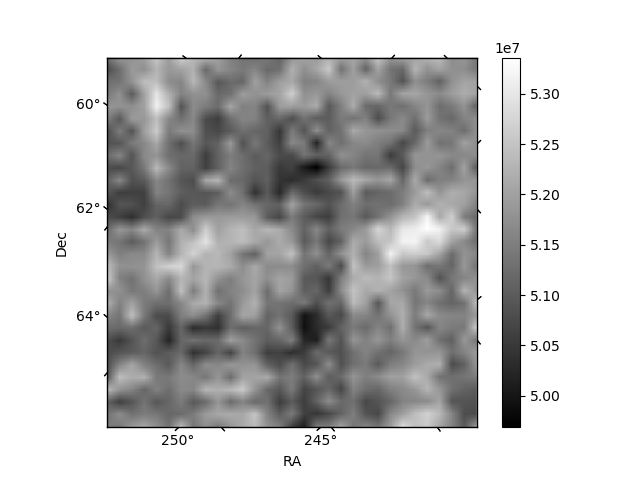
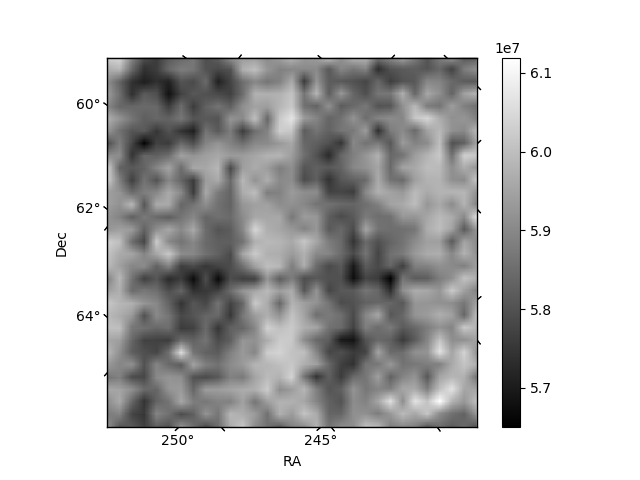
Histogram calculated using DETX and DETY for each event in the final _common_clean file
| Quadrant A | 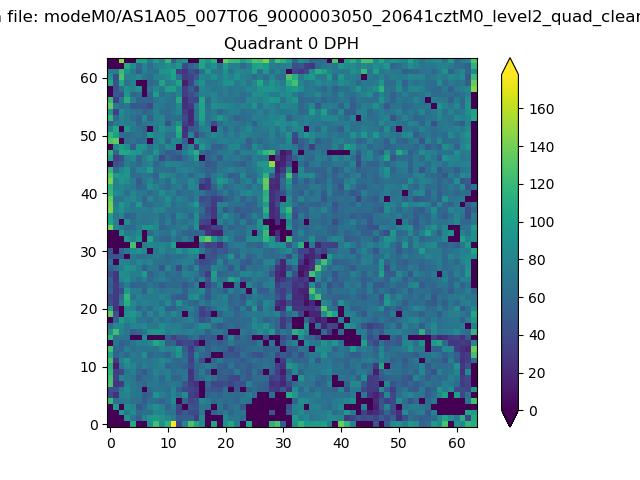 |
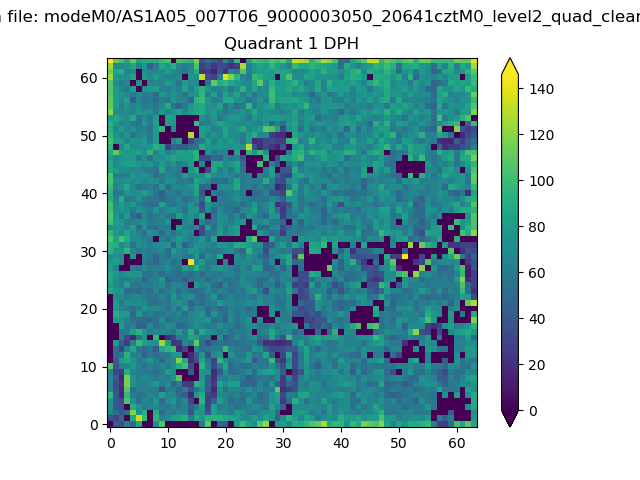 |
Quadrant B |
|---|---|---|---|
| Quadrant D | 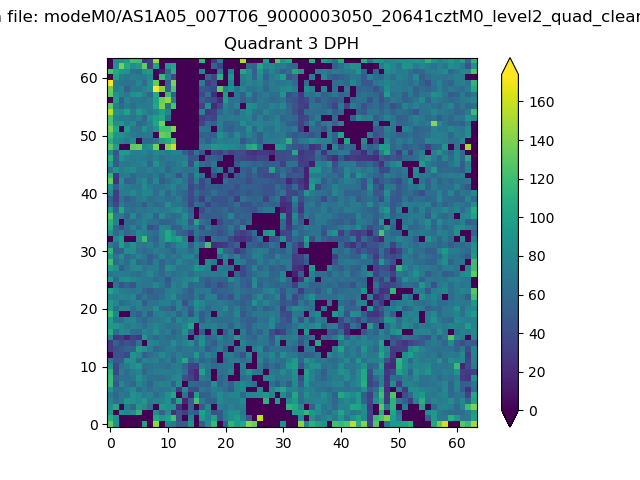 |
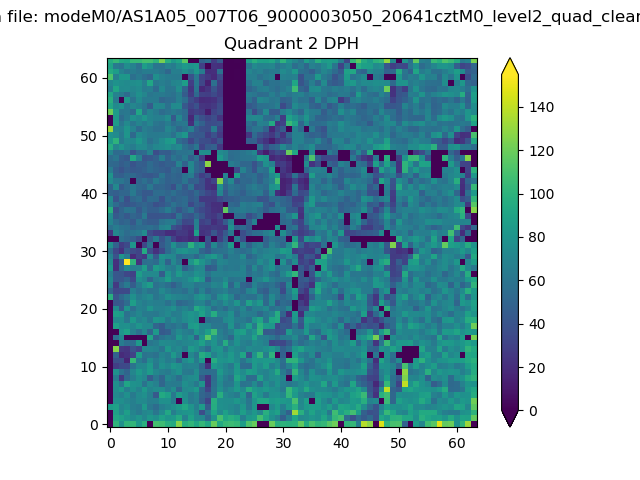 |
Quadrant C |
| Plot type | Count rate plots | Images |
|---|---|---|
| Comparison with Poisson distribution Blue bars denote a histogram of data divided into 1 sec bins. Red curve is a Poisson curve with rate = median count rate of data. |
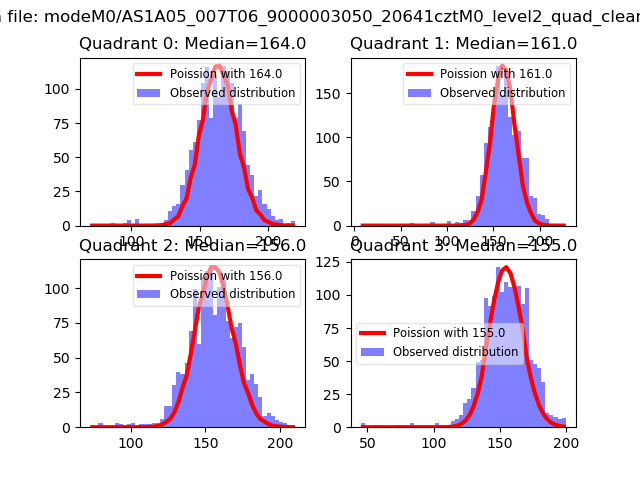 |
 |
| Quadrant-wise count rates Data is divided into 100 sec bins |
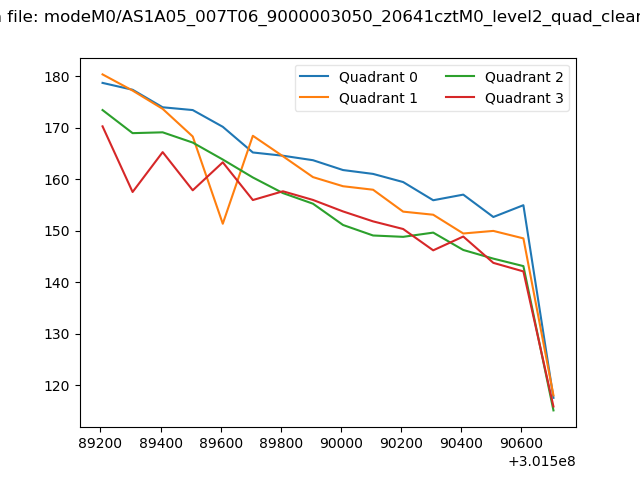 |
|
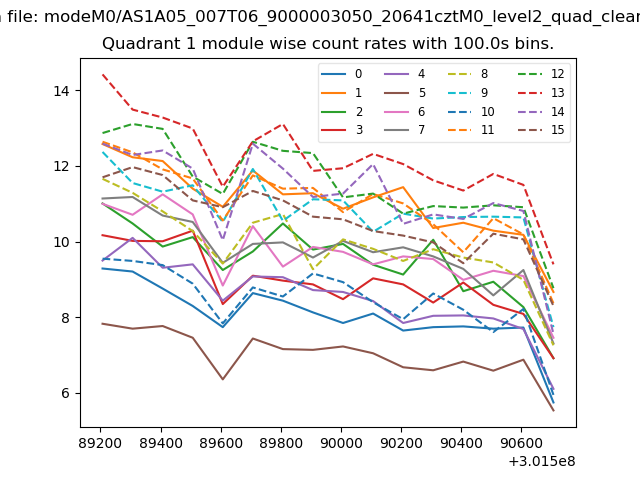
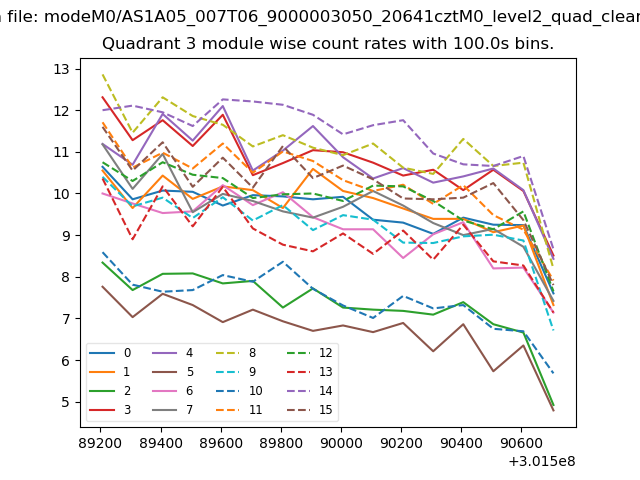
| Module-wise count rates for Quadrant A Data is divided into 100 sec bins |
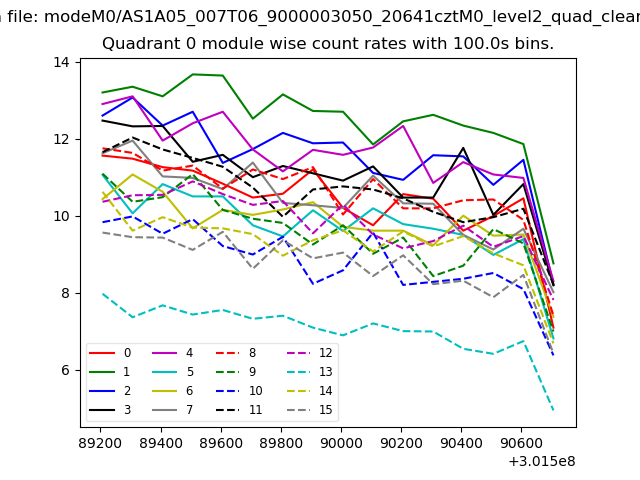 |
 |
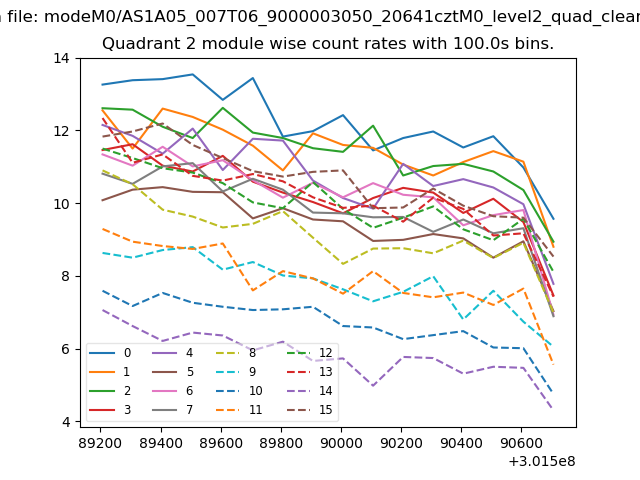
| Module-wise count rates for Quadrant B Data is divided into 100 sec bins |
 |
 |
| Module-wise count rates for Quadrant C Data is divided into 100 sec bins |
 |
 |
| Module-wise count rates for Quadrant D Data is divided into 100 sec bins |
 |
 |
| Parameter | Plot |
|---|---|
| CZT HV Monitor | 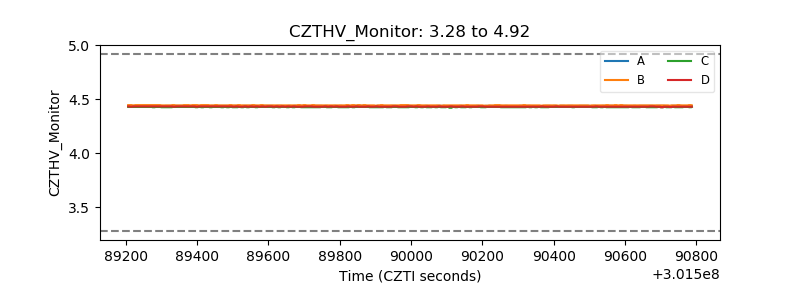 |
| D_VDD | 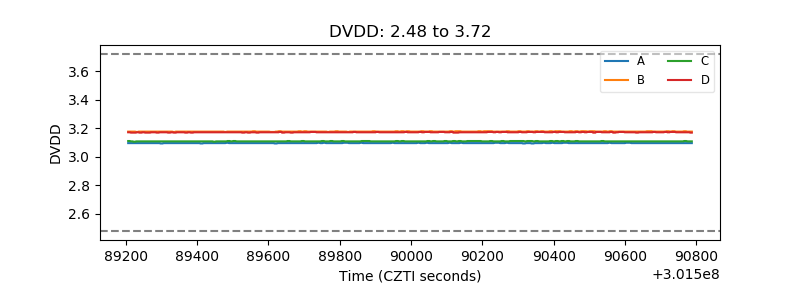 |
| Temperature 1 | 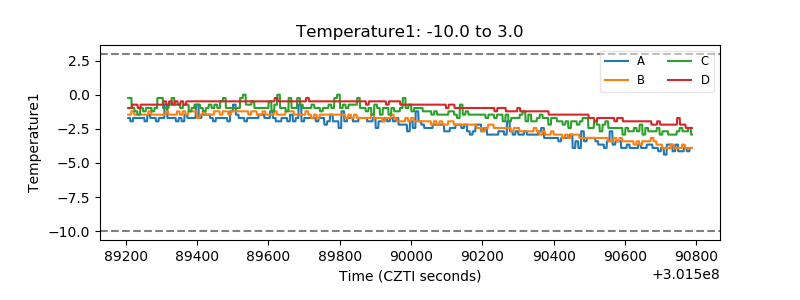 |
| Veto HV Monitor | 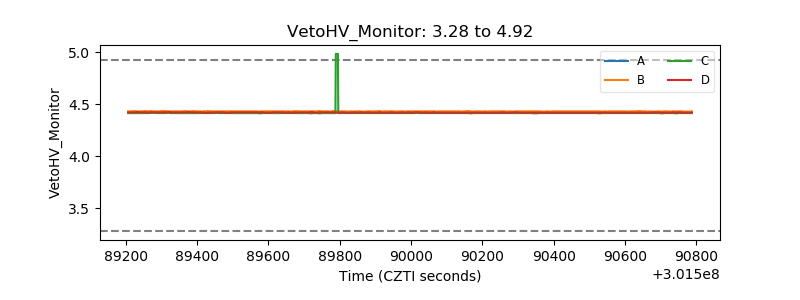 |
| Veto LLD | 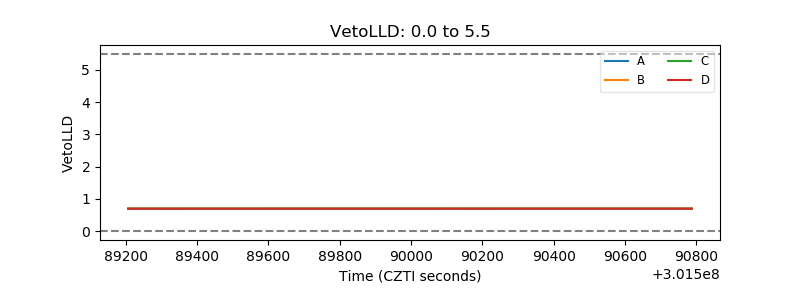 |
| Alpha Counter | 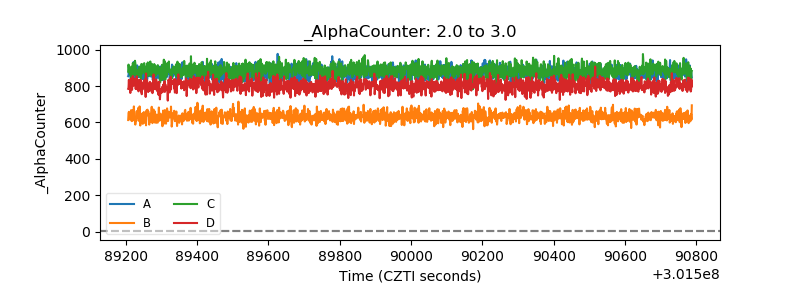 |
| _CPM_Rate | 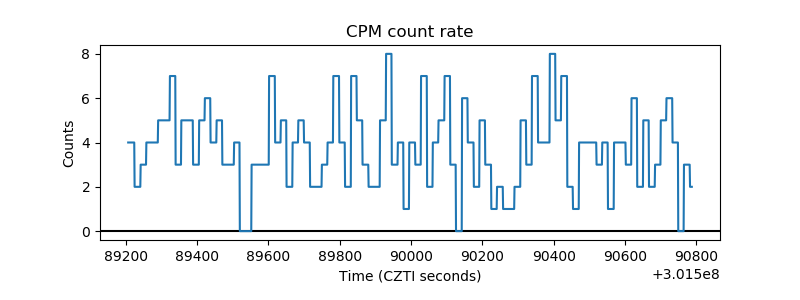 |
| CZT Counter | 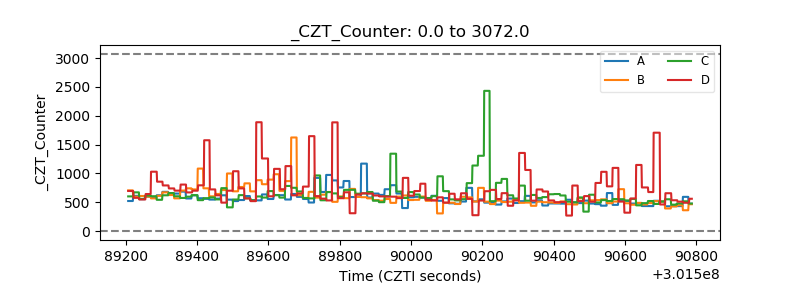 |
| +2.5 Volts monitor |  |
| +5 Volts monitor |  |
| _ROLL_ROT | 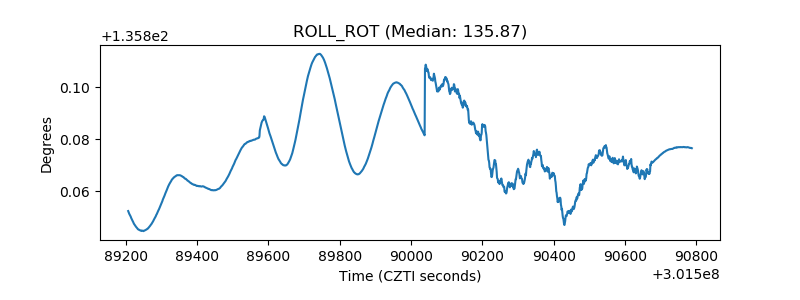 |
| _Roll_DEC | 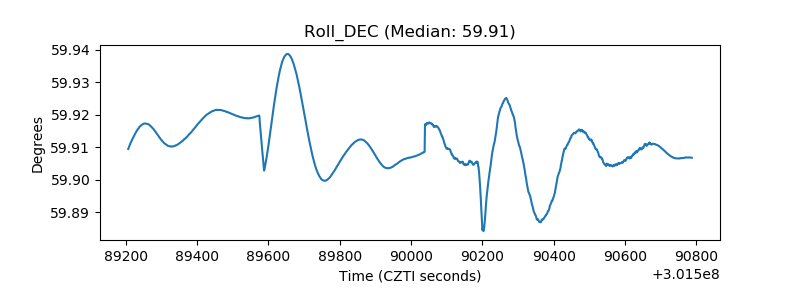 |
| _Roll_RA | 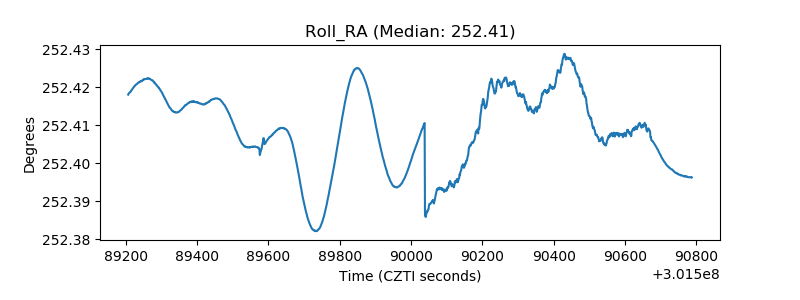 |
| Veto Counter | 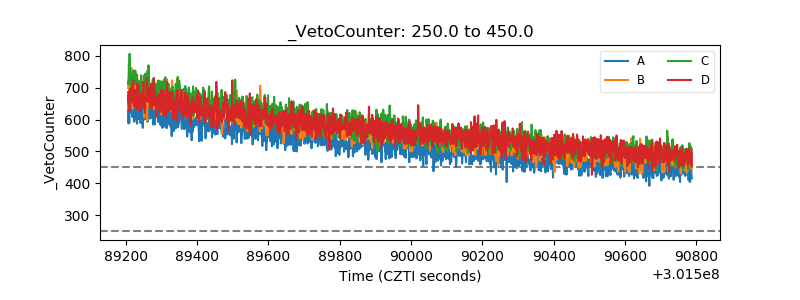 |