| Param | Original file | Final file |
|---|---|---|
| Filename | modeM0/AS1A05_007T06_9000003050_20811cztM0_level2.evt | modeM0/AS1A05_007T06_9000003050_20811cztM0_level2_quad_clean.evt |
| Size (bytes) | 319,475,520 | 51,281,280 |
| Size | 304.7 MB | 48.9 MB |
| Events in quadrant A | 1,961,227 | 324,328 |
| Events in quadrant B | 2,238,562 | 331,373 |
| Events in quadrant C | 1,961,384 | 311,346 |
| Events in quadrant D | 3,235,672 | 297,910 |
| Mode SS | |||
|---|---|---|---|
| Quadrant | BADHDUFLAG | Total packets | Discarded packets |
| A | 0 | 102 | 16 |
| B | 0 | 103 | 23 |
| C | 0 | 105 | 23 |
| D | 0 | 104 | 22 |
| Mode M9 | |||
|---|---|---|---|
| Quadrant | BADHDUFLAG | Total packets | Discarded packets |
| A | 0 | 12 | 4 |
| B | 0 | 13 | 5 |
| C | 0 | 12 | 5 |
| D | 0 | 12 | 4 |
| Mode M0 | |||
|---|---|---|---|
| Quadrant | BADHDUFLAG | Total packets | Discarded packets |
| A | 0 | 10599 | 2258 |
| B | 0 | 11467 | 2349 |
| C | 0 | 10751 | 2409 |
| D | 0 | 15146 | 2833 |
| Quadrant | Total seconds | Saturated seconds | Saturation percentage |
|---|---|---|---|
| A | 4092 | 17 | 0.415445% |
| B | 4095 | 52 | 1.269841% |
| C | 4067 | 42 | 1.032702% |
| D | 4070 | 206 | 5.061425% |
Noise dominated data is calculated using 1-second bins in cleaned event files. If a bin has >2000 counts, and if more than 50% of those come from <1% of pixels, then it is considered to be noise-dominated and hence unusable.
| Quadrant | # 1 sec bins | Bins with >0 counts | Bins with >2000 counts | High rate bins dominated by noise | Noise dominated (total time) | Noise dominated (detector-on time) | Marked lightcurve |
|---|---|---|---|---|---|---|---|
| A | 6274 | 4227 | 0 | 0 | 0.00% | 0.00% | 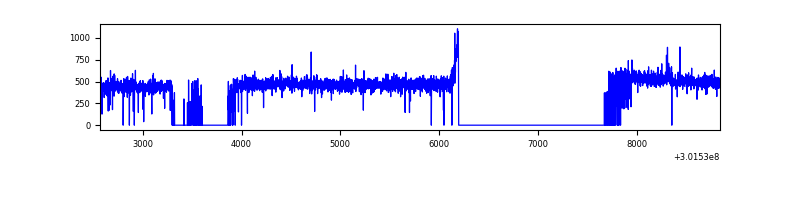 |
| B | 6274 | 4225 | 20 | 20 | 0.32% | 0.47% | 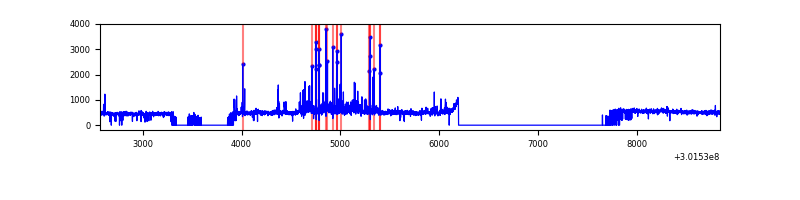 |
| C | 6274 | 4202 | 0 | 0 | 0.00% | 0.00% | 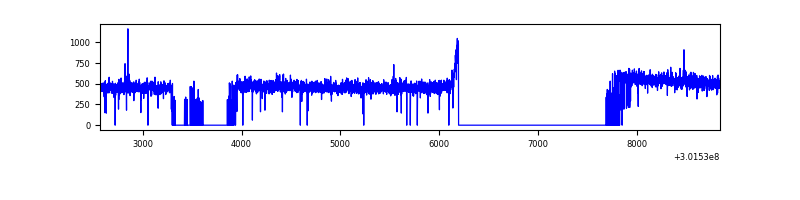 |
| D | 6274 | 4198 | 136 | 136 | 2.17% | 3.24% | 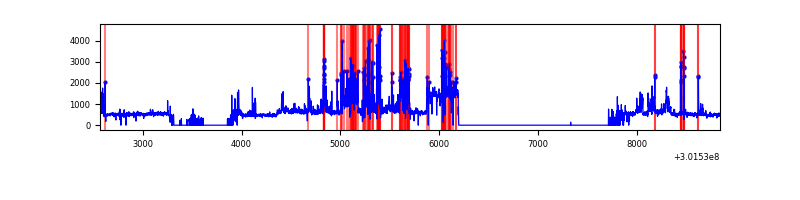 |
Top three noisy pixels from each quadrant. If the there are fewer than three noisy pixels in the level2.evt file, extra rows are filled as -1
| Pixel properties | Quadrant properties | ||||||
|---|---|---|---|---|---|---|---|
| Quadrant | DetID | PixID | Counts | Sigma | Mean | Median | Sigma |
| A | 13 | 252 | 6517 | 58.68 | 508 | 497 | 102.6 |
| A | 0 | 226 | 4410 | 38.14 | 508 | 497 | 102.6 |
| A | 3 | 137 | 3992 | 34.07 | 508 | 497 | 102.6 |
| B | 7 | 220 | 164600 | 1742.26 | 499 | 487 | 94.2 |
| B | 4 | 171 | 33479 | 350.25 | 499 | 487 | 94.2 |
| B | 0 | 189 | 23544 | 244.78 | 499 | 487 | 94.2 |
| C | 14 | 238 | 77055 | 690.93 | 480 | 484 | 110.8 |
| C | 9 | 54 | 7708 | 65.19 | 480 | 484 | 110.8 |
| C | 3 | 233 | 3649 | 28.56 | 480 | 484 | 110.8 |
| D | 1 | 52 | 730956 | 6354.33 | 478 | 464 | 115.0 |
| D | 1 | 20 | 587179 | 5103.66 | 478 | 464 | 115.0 |
| D | 9 | 1 | 63128 | 545.1 | 478 | 464 | 115.0 |
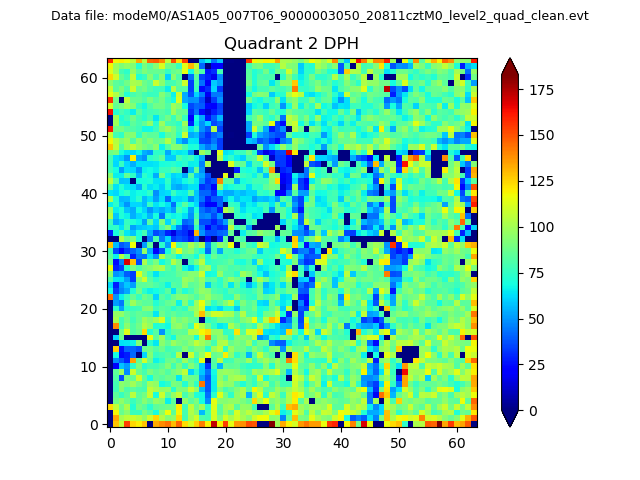
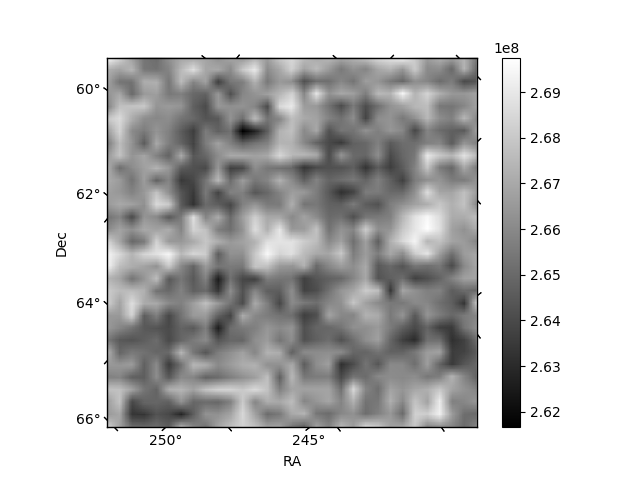
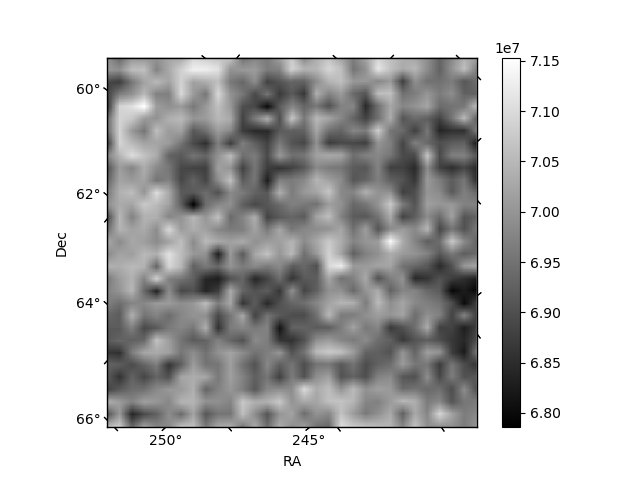
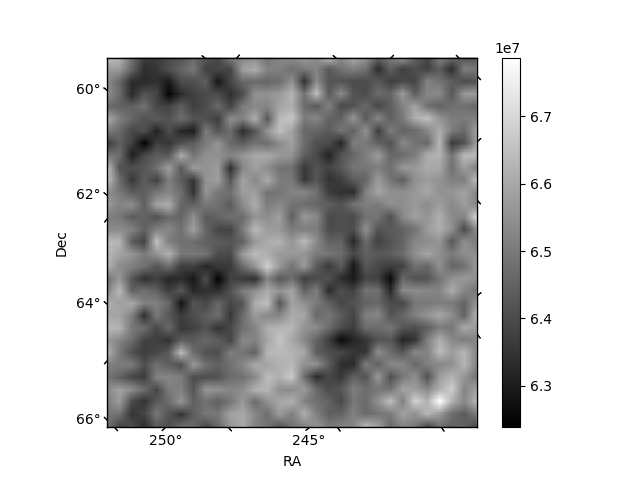
Histogram calculated using DETX and DETY for each event in the final _common_clean file
| Quadrant A | 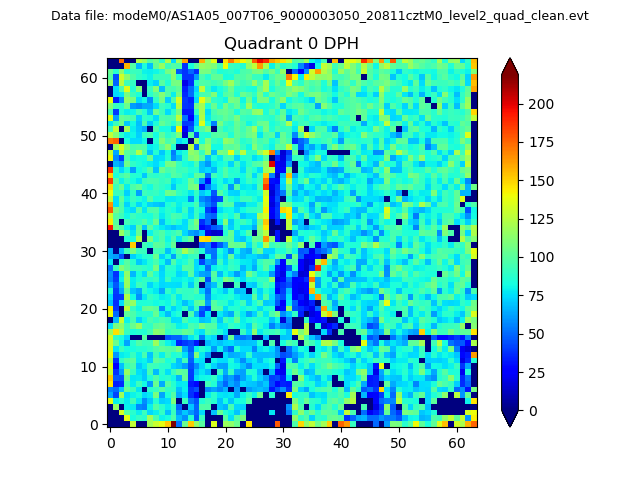 |
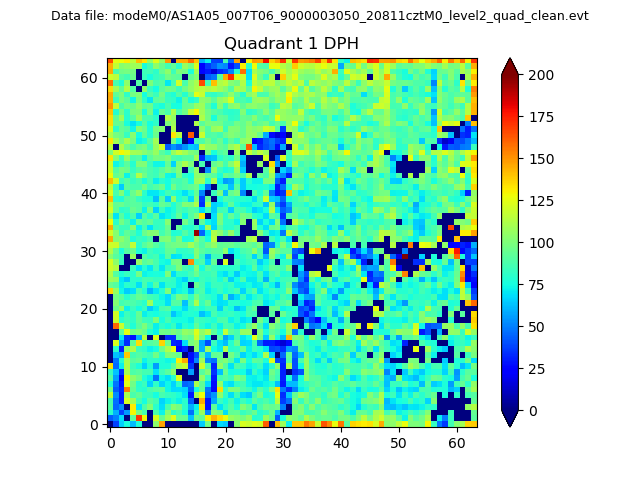 |
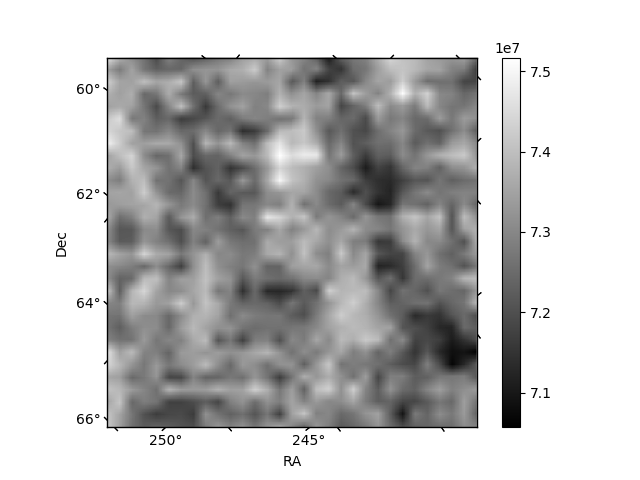
Quadrant B |
|---|---|---|---|
| Quadrant D | 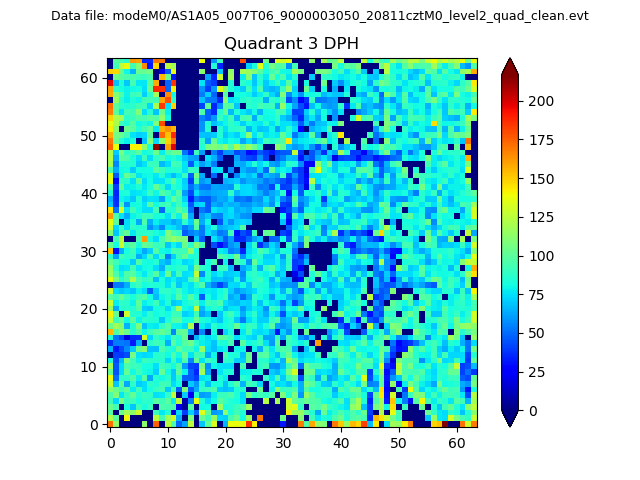 |
 |
Quadrant C |
| Plot type | Count rate plots | Images |
|---|---|---|
| Comparison with Poisson distribution Blue bars denote a histogram of data divided into 1 sec bins. Red curve is a Poisson curve with rate = median count rate of data. |
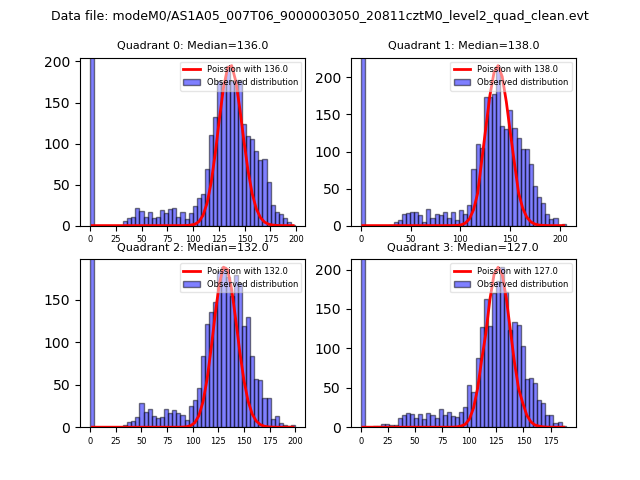 |
 |
| Quadrant-wise count rates Data is divided into 100 sec bins |
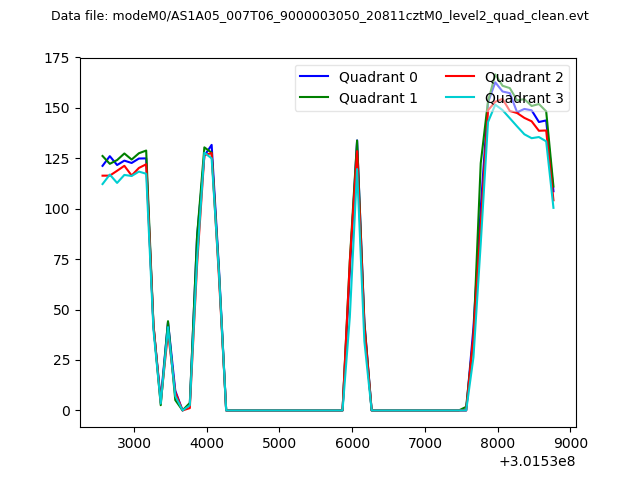 |
|
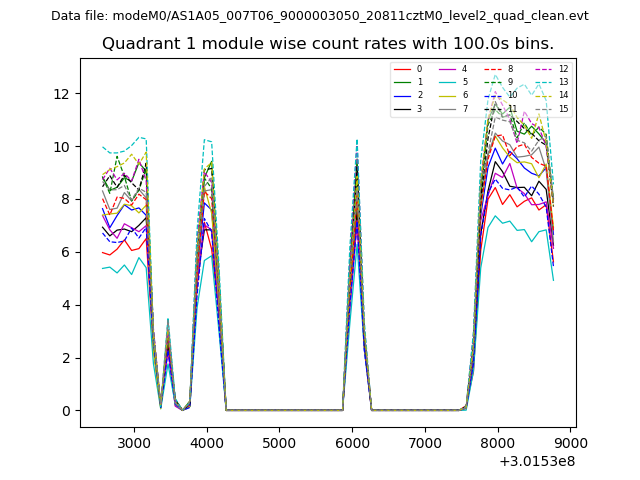
| Module-wise count rates for Quadrant A Data is divided into 100 sec bins |
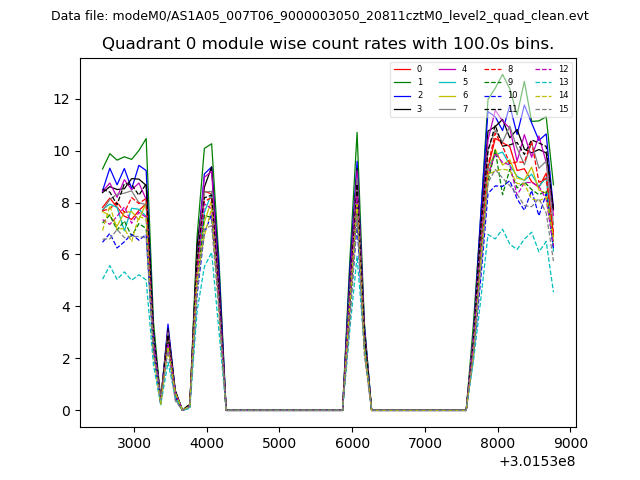 |
 |
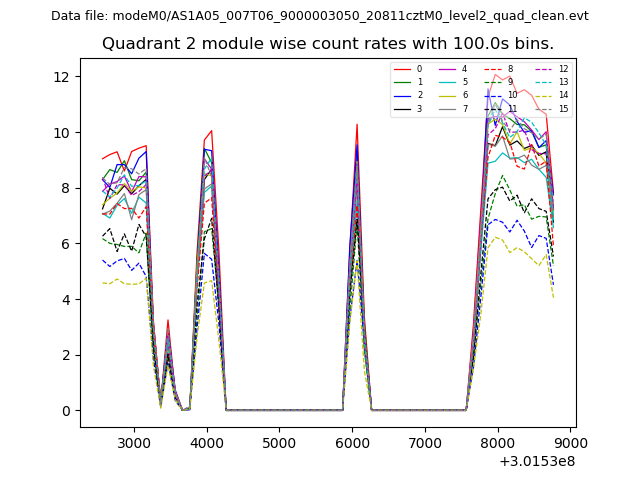
| Module-wise count rates for Quadrant B Data is divided into 100 sec bins |
 |
 |
| Module-wise count rates for Quadrant C Data is divided into 100 sec bins |
 |
 |
| Module-wise count rates for Quadrant D Data is divided into 100 sec bins |
 |
 |
| Parameter | Plot |
|---|---|
| CZT HV Monitor | 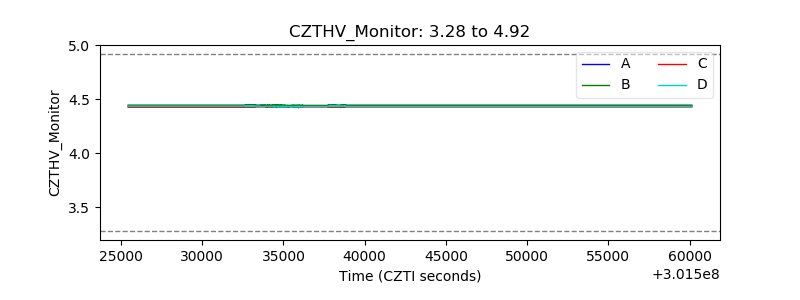 |
| D_VDD | 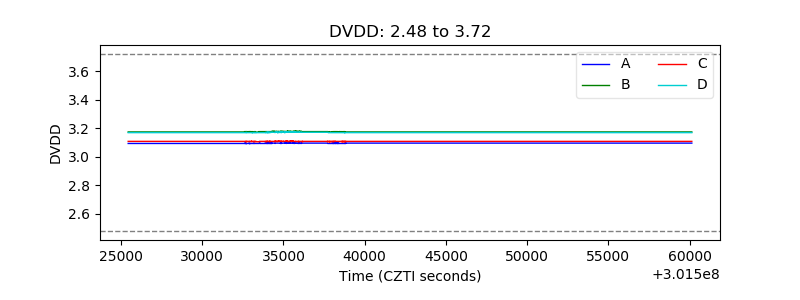 |
| Temperature 1 | 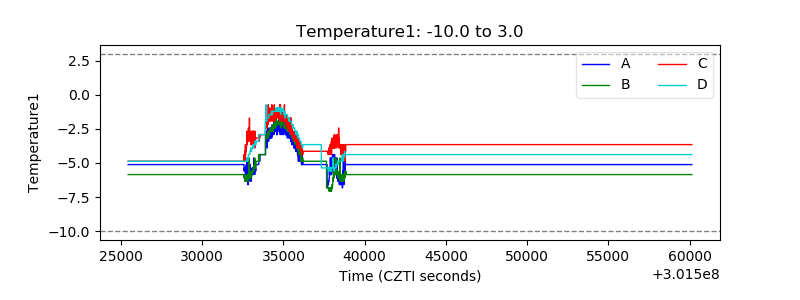 |
| Veto HV Monitor | 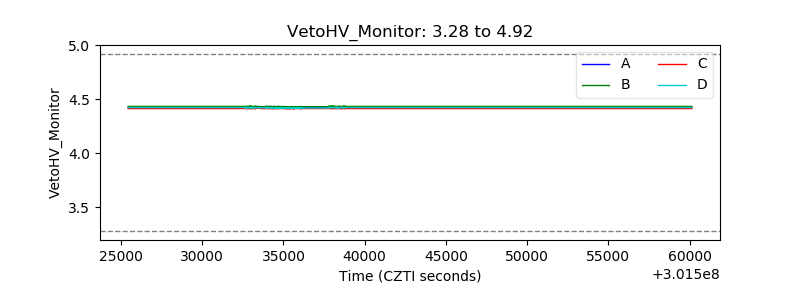 |
| Veto LLD | 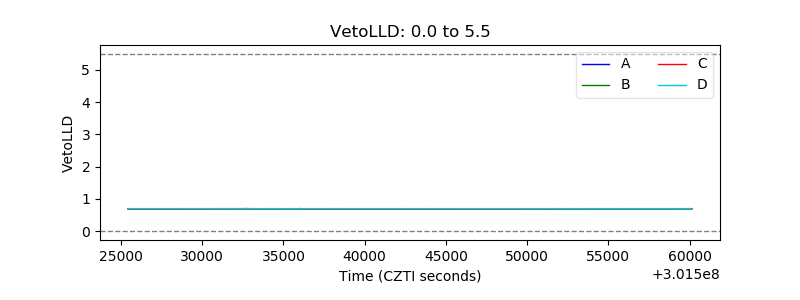 |
| Alpha Counter | 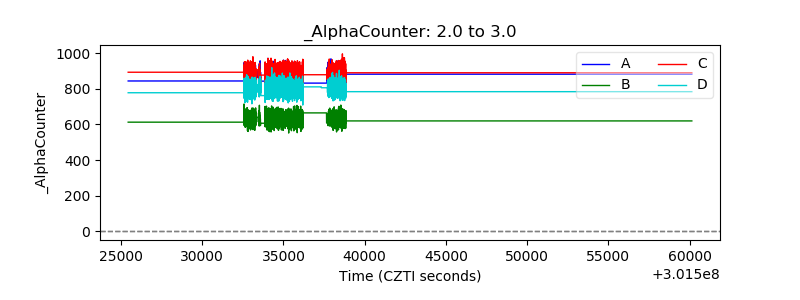 |
| _CPM_Rate | 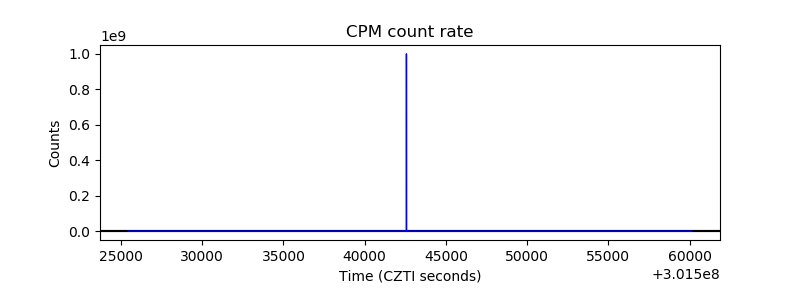 |
| CZT Counter | 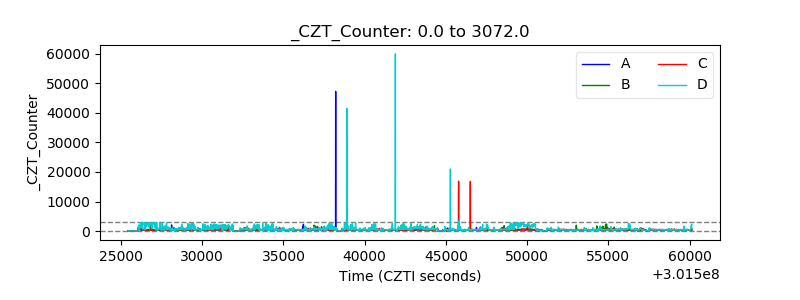 |
| +2.5 Volts monitor | 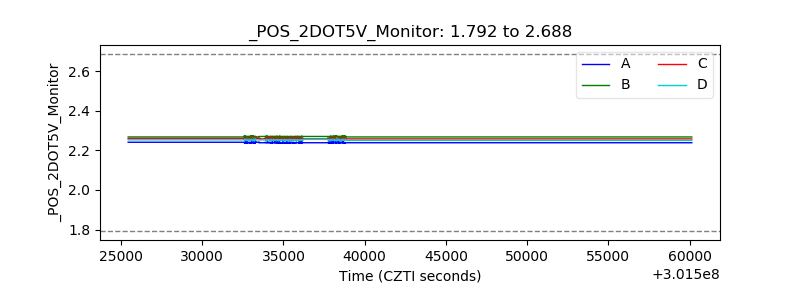 |
| +5 Volts monitor |  |
| _ROLL_ROT | 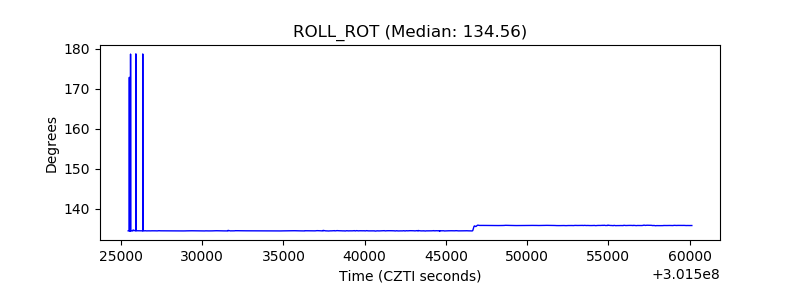 |
| _Roll_DEC |  |
| _Roll_RA | 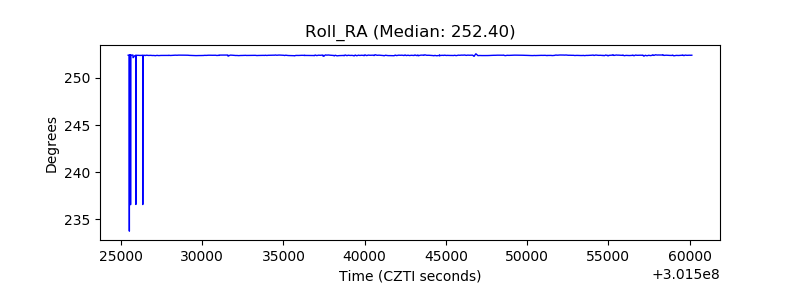 |
| Veto Counter |  |