| Param | Original file | Final file |
|---|---|---|
| Filename | modeM0/AS1A05_082T09_9000003054_20646cztM0_level2.evt | modeM0/AS1A05_082T09_9000003054_20646cztM0_level2_quad_clean.evt |
| Size (bytes) | 599,175,360 | 95,299,200 |
| Size | 571.4 MB | 90.9 MB |
| Events in quadrant A | 4,439,801 | 589,889 |
| Events in quadrant B | 4,534,652 | 590,676 |
| Events in quadrant C | 3,995,269 | 573,506 |
| Events in quadrant D | 4,618,533 | 560,032 |
| Mode M9 | |||
|---|---|---|---|
| Quadrant | BADHDUFLAG | Total packets | Discarded packets |
| A | 0 | 6 | 0 |
| B | 0 | 6 | 0 |
| C | 0 | 6 | 0 |
| D | 0 | 6 | 0 |
| Mode M0 | |||
|---|---|---|---|
| Quadrant | BADHDUFLAG | Total packets | Discarded packets |
| A | 0 | 18687 | 9 |
| B | 0 | 18740 | 15 |
| C | 0 | 17118 | 15 |
| D | 0 | 19093 | 4 |
| Mode SS | |||
|---|---|---|---|
| Quadrant | BADHDUFLAG | Total packets | Discarded packets |
| A | 0 | 172 | 0 |
| B | 0 | 172 | 0 |
| C | 0 | 172 | 0 |
| D | 0 | 172 | 0 |
| Quadrant | Total seconds | Saturated seconds | Saturation percentage |
|---|---|---|---|
| A | 8211 | 276 | 3.361345% |
| B | 8211 | 302 | 3.677993% |
| C | 8209 | 170 | 2.070898% |
| D | 8214 | 178 | 2.167032% |
Noise dominated data is calculated using 1-second bins in cleaned event files. If a bin has >2000 counts, and if more than 50% of those come from <1% of pixels, then it is considered to be noise-dominated and hence unusable.
| Quadrant | # 1 sec bins | Bins with >0 counts | Bins with >2000 counts | High rate bins dominated by noise | Noise dominated (total time) | Noise dominated (detector-on time) | Marked lightcurve |
|---|---|---|---|---|---|---|---|
| A | 8909 | 8216 | 85 | 85 | 0.95% | 1.03% | 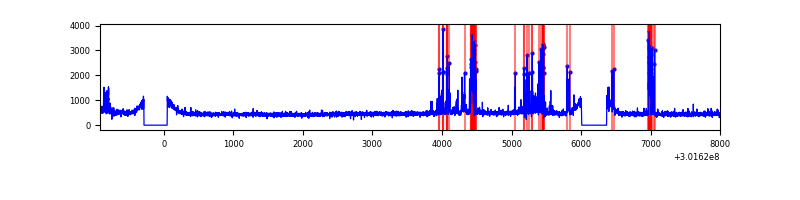 |
| B | 8910 | 8217 | 51 | 51 | 0.57% | 0.62% | 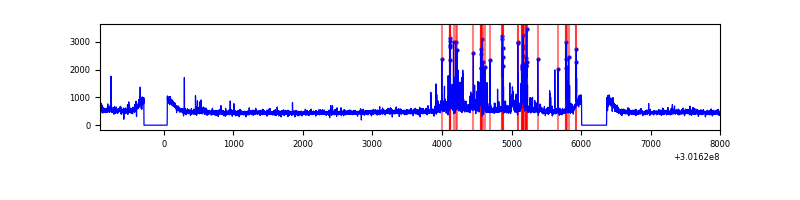 |
| C | 8910 | 8217 | 1 | 1 | 0.01% | 0.01% | 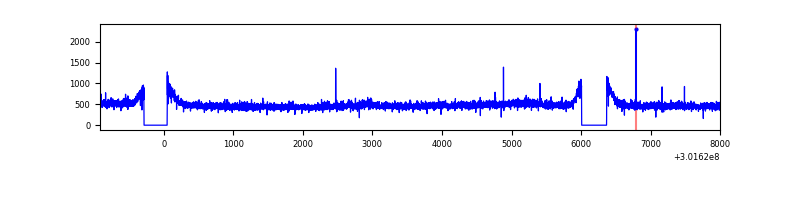 |
| D | 8910 | 8217 | 65 | 65 | 0.73% | 0.79% | 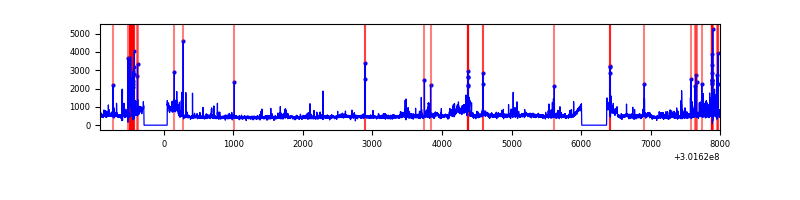 |
Top three noisy pixels from each quadrant. If the there are fewer than three noisy pixels in the level2.evt file, extra rows are filled as -1
| Pixel properties | Quadrant properties | ||||||
|---|---|---|---|---|---|---|---|
| Quadrant | DetID | PixID | Counts | Sigma | Mean | Median | Sigma |
| A | 5 | 16 | 510445 | 2487.25 | 1009 | 987 | 204.8 |
| A | 12 | 16 | 41438 | 197.49 | 1009 | 987 | 204.8 |
| A | 12 | 194 | 14389 | 65.43 | 1009 | 987 | 204.8 |
| B | 7 | 220 | 206142 | 1052.64 | 1008 | 984 | 194.9 |
| B | 0 | 244 | 163768 | 835.22 | 1008 | 984 | 194.9 |
| B | 0 | 197 | 55982 | 282.19 | 1008 | 984 | 194.9 |
| C | 14 | 238 | 149348 | 635.47 | 975 | 980 | 233.5 |
| C | 3 | 9 | 23774 | 97.63 | 975 | 980 | 233.5 |
| C | 7 | 247 | 8923 | 34.02 | 975 | 980 | 233.5 |
| D | 1 | 20 | 291696 | 1201.75 | 979 | 948 | 241.9 |
| D | 1 | 52 | 274176 | 1129.33 | 979 | 948 | 241.9 |
| D | 13 | 153 | 152495 | 626.39 | 979 | 948 | 241.9 |
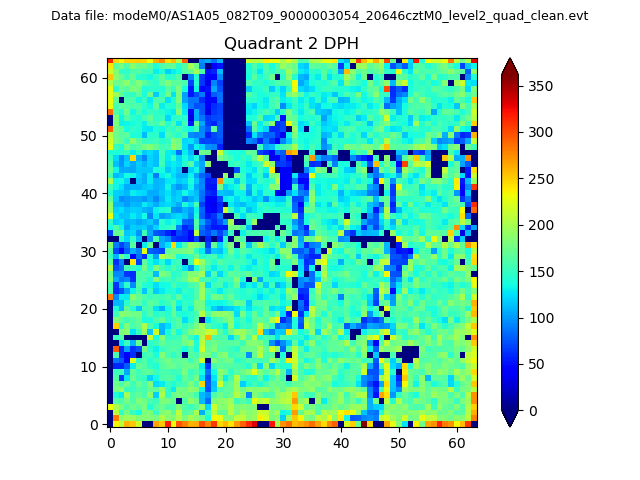
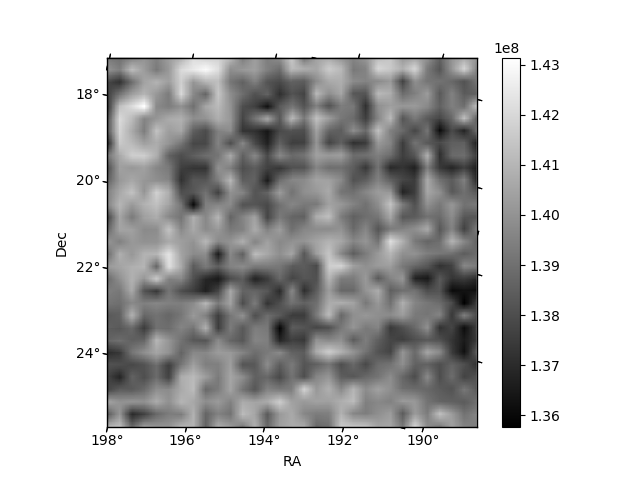
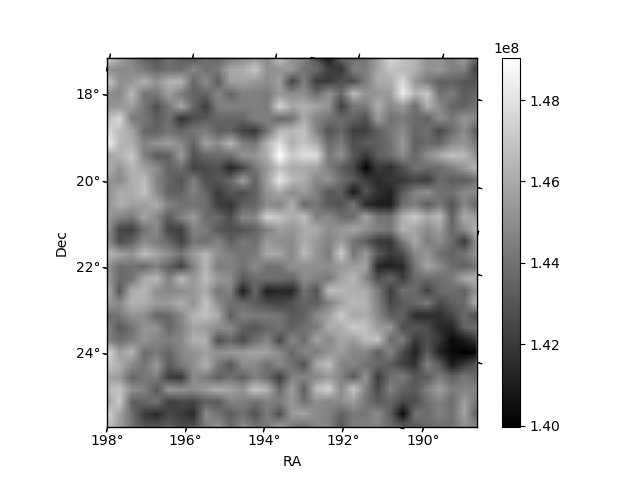
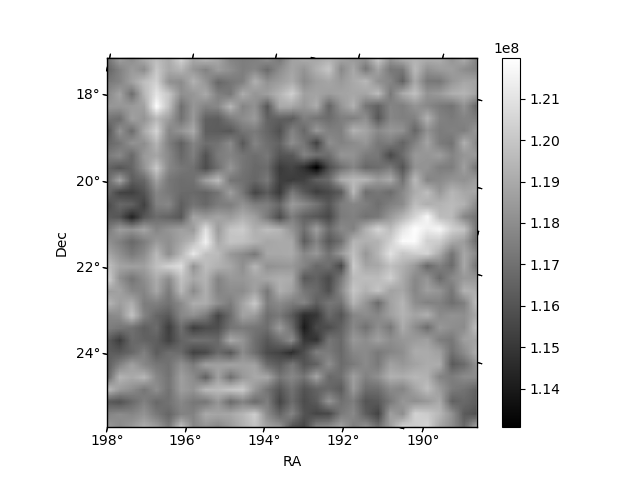
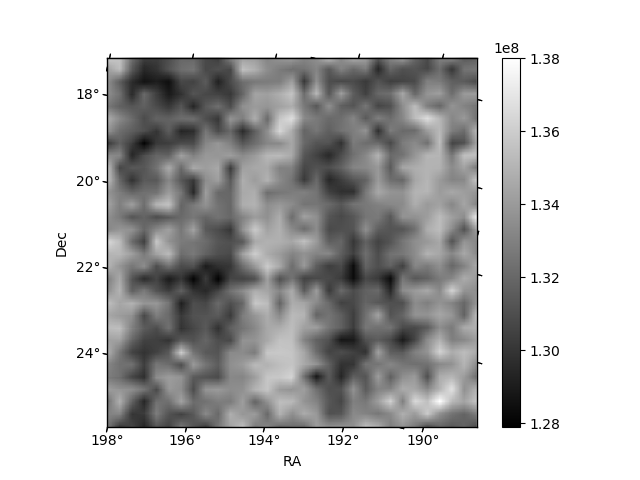
Histogram calculated using DETX and DETY for each event in the final _common_clean file
| Quadrant A | 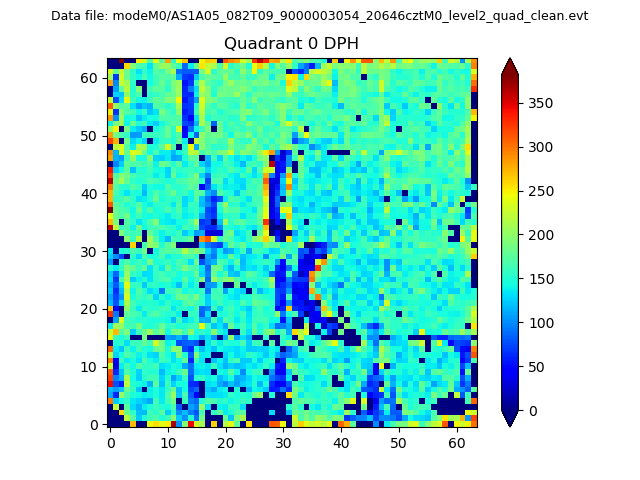 |
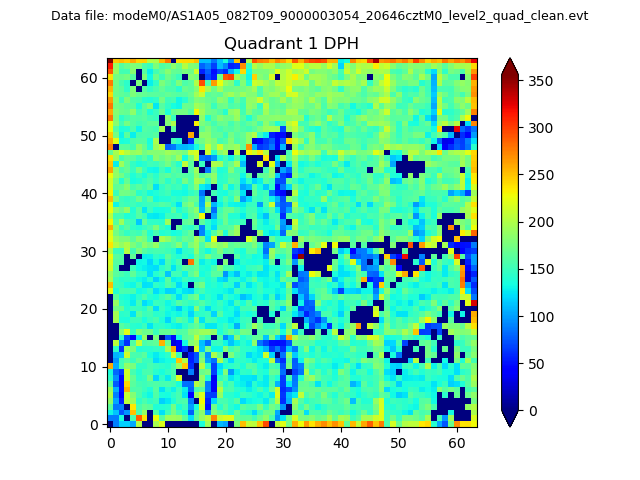 |
Quadrant B |
|---|---|---|---|
| Quadrant D | 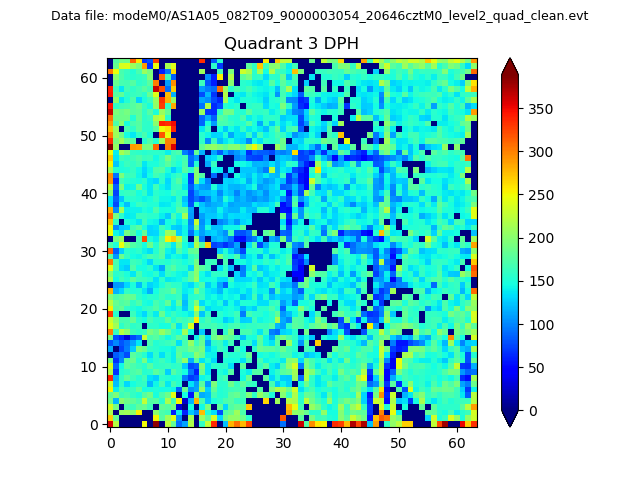 |
 |
Quadrant C |
| Plot type | Count rate plots | Images |
|---|---|---|
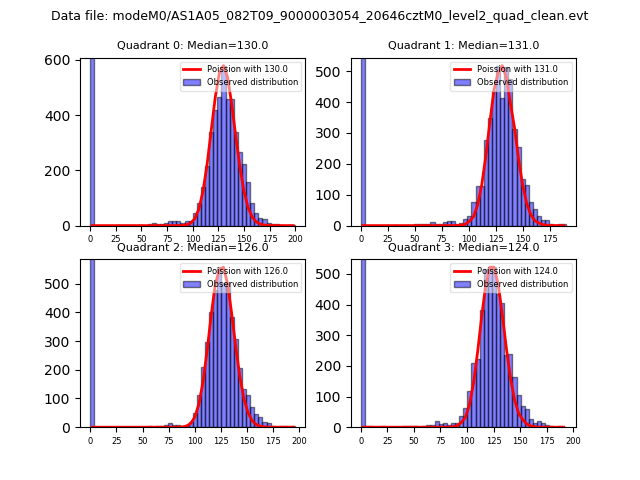
| Comparison with Poisson distribution Blue bars denote a histogram of data divided into 1 sec bins. Red curve is a Poisson curve with rate = median count rate of data. |
 |
 |
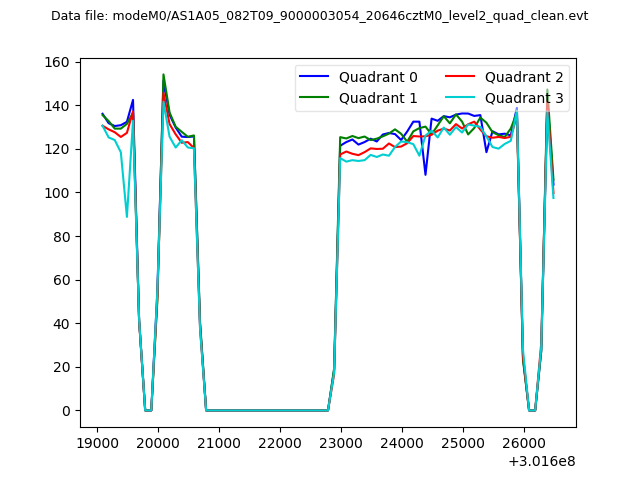
| Quadrant-wise count rates Data is divided into 100 sec bins |
 |
|
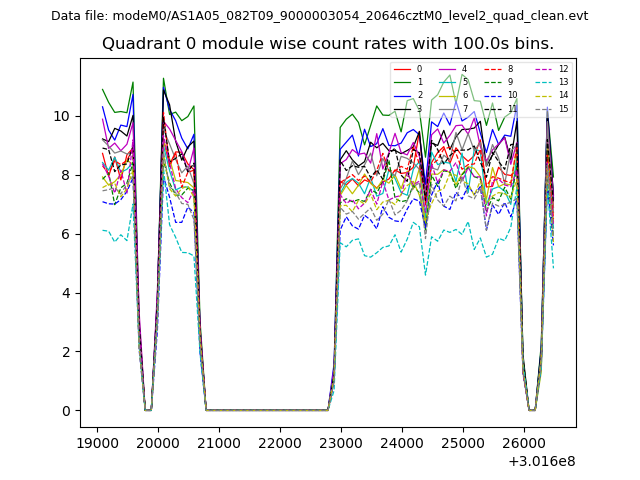
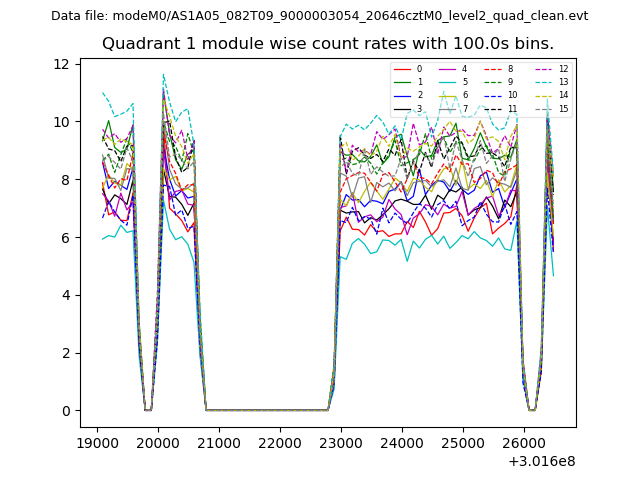
| Module-wise count rates for Quadrant A Data is divided into 100 sec bins |
 |
 |
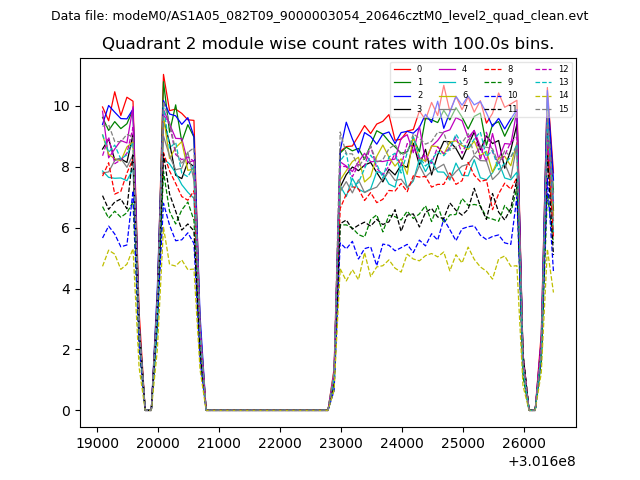
| Module-wise count rates for Quadrant B Data is divided into 100 sec bins |
 |
 |
| Module-wise count rates for Quadrant C Data is divided into 100 sec bins |
 |
 |
| Module-wise count rates for Quadrant D Data is divided into 100 sec bins |
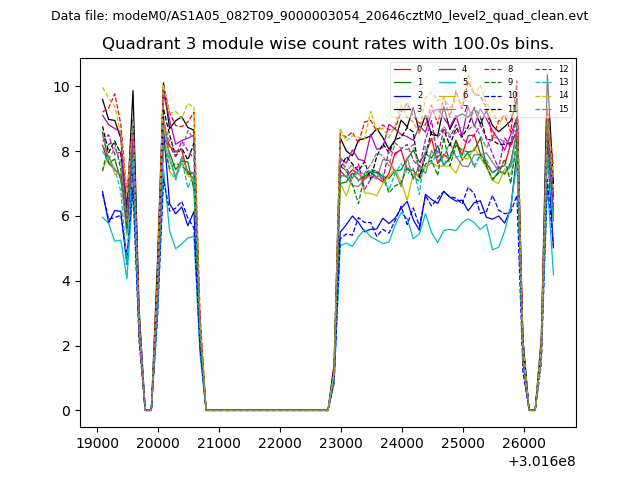 |
 |
| Parameter | Plot |
|---|---|
| CZT HV Monitor | 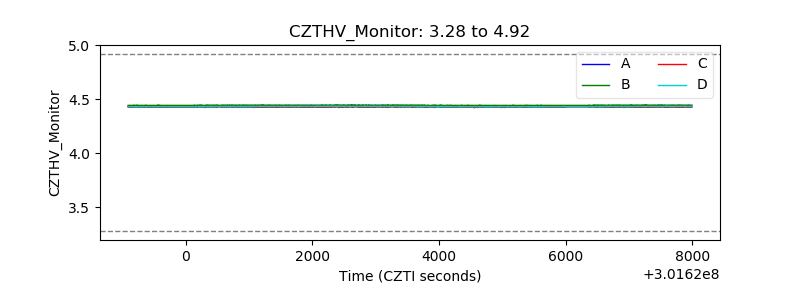 |
| D_VDD | 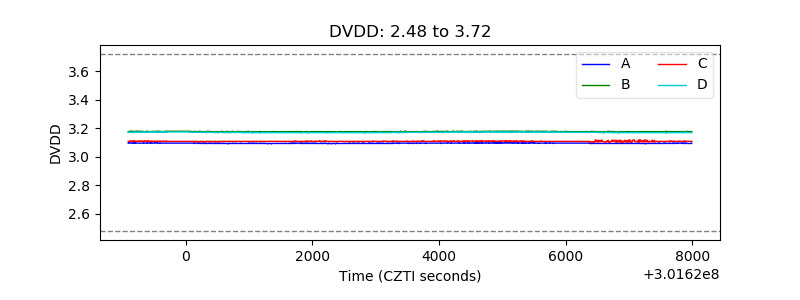 |
| Temperature 1 | 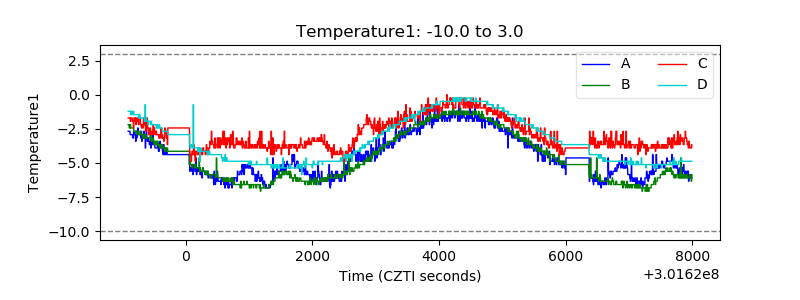 |
| Veto HV Monitor | 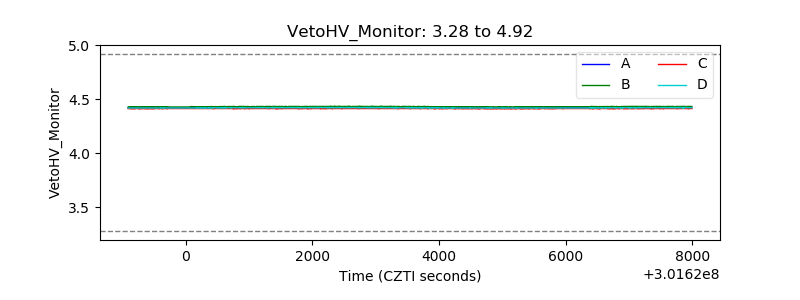 |
| Veto LLD | 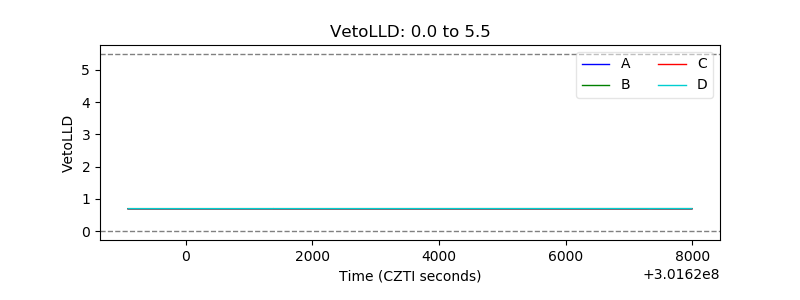 |
| Alpha Counter | 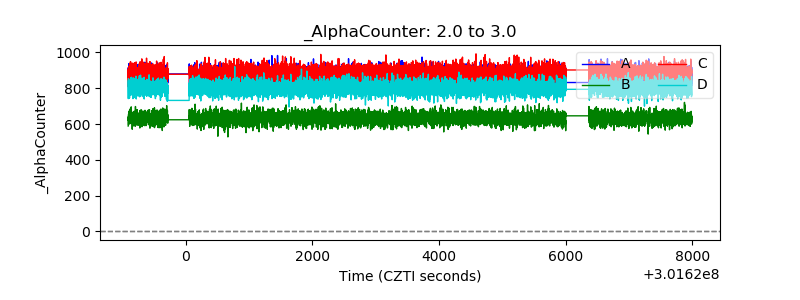 |
| _CPM_Rate | 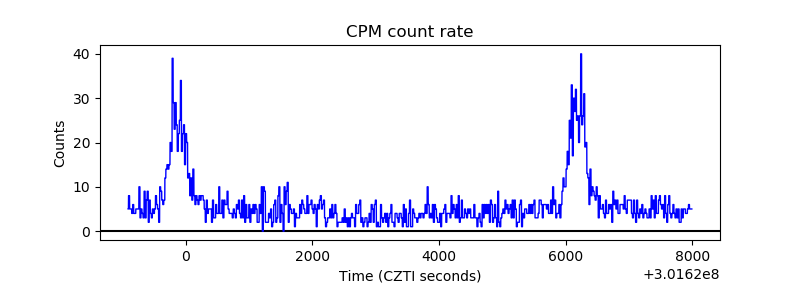 |
| CZT Counter | 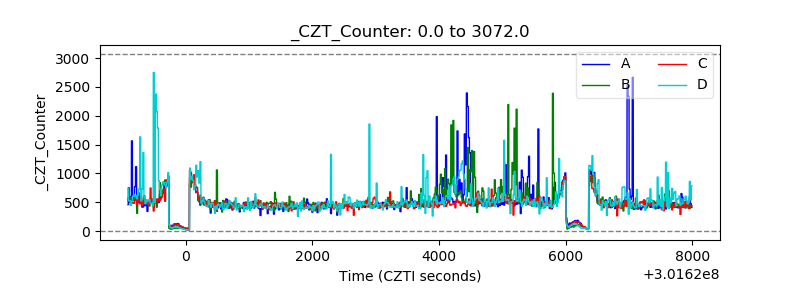 |
| +2.5 Volts monitor |  |
| +5 Volts monitor |  |
| _ROLL_ROT | 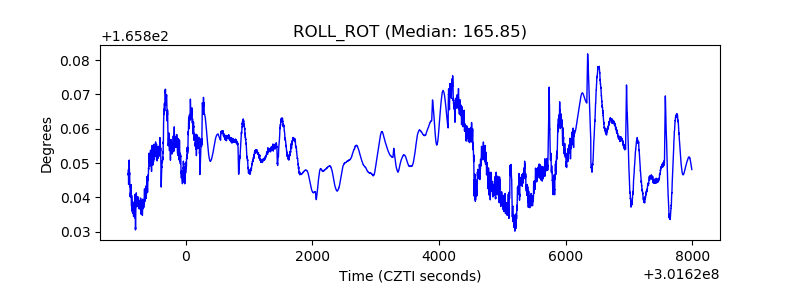 |
| _Roll_DEC | 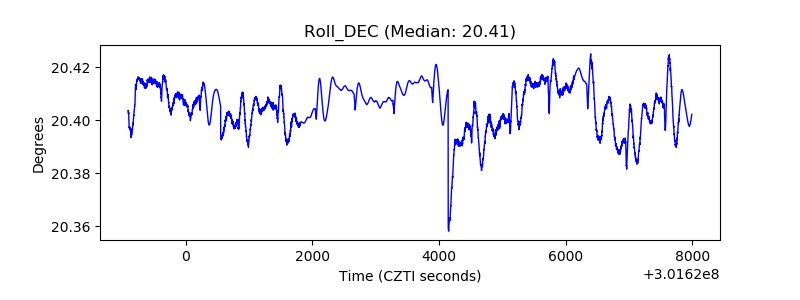 |
| _Roll_RA | 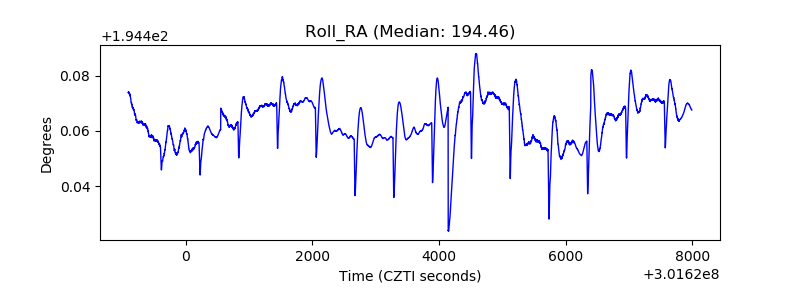 |
| Veto Counter | 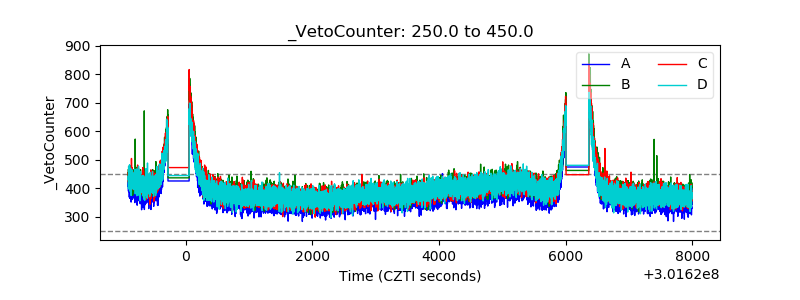 |