| Param | Original file | Final file |
|---|---|---|
| Filename | modeM0/AS1A05_082T09_9000003054_20649cztM0_level2.evt | modeM0/AS1A05_082T09_9000003054_20649cztM0_level2_quad_clean.evt |
| Size (bytes) | 1,548,429,120 | 216,682,560 |
| Size | 1.4 GB | 206.6 MB |
| Events in quadrant A | 13,382,298 | 1,337,606 |
| Events in quadrant B | 9,438,000 | 1,395,674 |
| Events in quadrant C | 8,620,182 | 1,341,672 |
| Events in quadrant D | 14,239,469 | 1,245,418 |
| Mode M9 | |||
|---|---|---|---|
| Quadrant | BADHDUFLAG | Total packets | Discarded packets |
| A | 0 | 21 | 0 |
| B | 0 | 21 | 0 |
| C | 0 | 21 | 0 |
| D | 0 | 21 | 0 |
| Mode M0 | |||
|---|---|---|---|
| Quadrant | BADHDUFLAG | Total packets | Discarded packets |
| A | 0 | 51568 | 3 |
| B | 0 | 39144 | 3 |
| C | 0 | 36884 | 4 |
| D | 0 | 54386 | 3 |
| Mode SS | |||
|---|---|---|---|
| Quadrant | BADHDUFLAG | Total packets | Discarded packets |
| A | 0 | 364 | 0 |
| B | 0 | 364 | 0 |
| C | 0 | 364 | 0 |
| D | 0 | 364 | 0 |
| Quadrant | Total seconds | Saturated seconds | Saturation percentage |
|---|---|---|---|
| A | 18018 | 1380 | 7.659008% |
| B | 18019 | 278 | 1.542816% |
| C | 18018 | 235 | 1.304251% |
| D | 18018 | 1327 | 7.364857% |
Noise dominated data is calculated using 1-second bins in cleaned event files. If a bin has >2000 counts, and if more than 50% of those come from <1% of pixels, then it is considered to be noise-dominated and hence unusable.
| Quadrant | # 1 sec bins | Bins with >0 counts | Bins with >2000 counts | High rate bins dominated by noise | Noise dominated (total time) | Noise dominated (detector-on time) | Marked lightcurve |
|---|---|---|---|---|---|---|---|
| A | 20033 | 18020 | 813 | 813 | 4.06% | 4.51% |  |
| B | 20034 | 18021 | 46 | 46 | 0.23% | 0.26% | 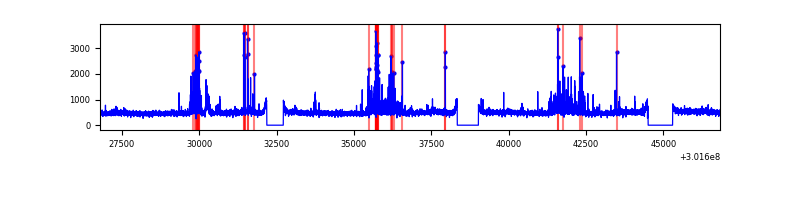 |
| C | 20033 | 18020 | 1 | 1 | 0.00% | 0.01% | 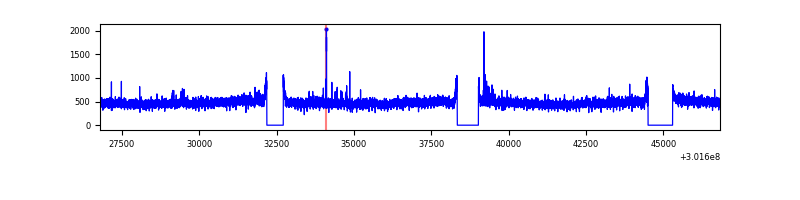 |
| D | 20033 | 18020 | 1096 | 1096 | 5.47% | 6.08% | 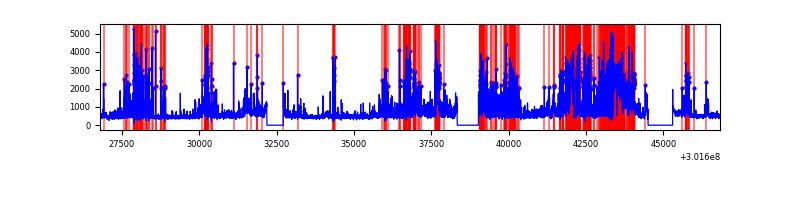 |
Top three noisy pixels from each quadrant. If the there are fewer than three noisy pixels in the level2.evt file, extra rows are filled as -1
| Pixel properties | Quadrant properties | ||||||
|---|---|---|---|---|---|---|---|
| Quadrant | DetID | PixID | Counts | Sigma | Mean | Median | Sigma |
| A | 5 | 16 | 5200967 | 12045.94 | 2126 | 2075 | 431.6 |
| A | 0 | 226 | 18610 | 38.31 | 2126 | 2075 | 431.6 |
| A | 3 | 137 | 17671 | 36.14 | 2126 | 2075 | 431.6 |
| B | 7 | 220 | 552074 | 1337.43 | 2167 | 2113 | 411.2 |
| B | 0 | 197 | 77096 | 182.35 | 2167 | 2113 | 411.2 |
| B | 6 | 36 | 69589 | 164.09 | 2167 | 2113 | 411.2 |
| C | 14 | 238 | 325416 | 658.09 | 2081 | 2094 | 491.3 |
| C | 8 | 208 | 89005 | 176.9 | 2081 | 2094 | 491.3 |
| C | 7 | 247 | 69992 | 138.2 | 2081 | 2094 | 491.3 |
| D | 1 | 20 | 3323334 | 6640.95 | 2054 | 1994 | 500.1 |
| D | 1 | 52 | 1670801 | 3336.74 | 2054 | 1994 | 500.1 |
| D | 7 | 238 | 474837 | 945.44 | 2054 | 1994 | 500.1 |
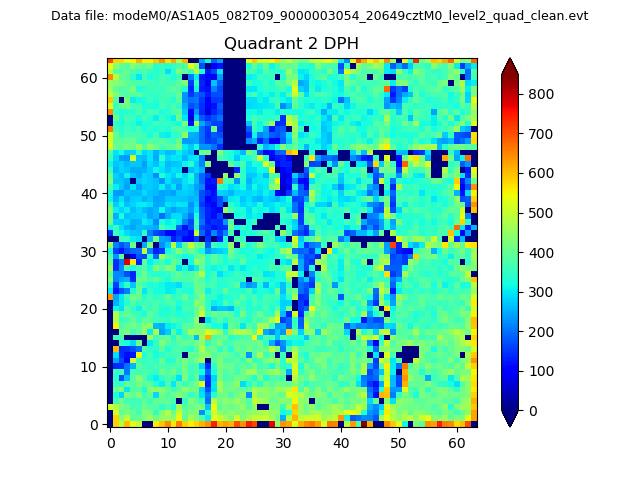
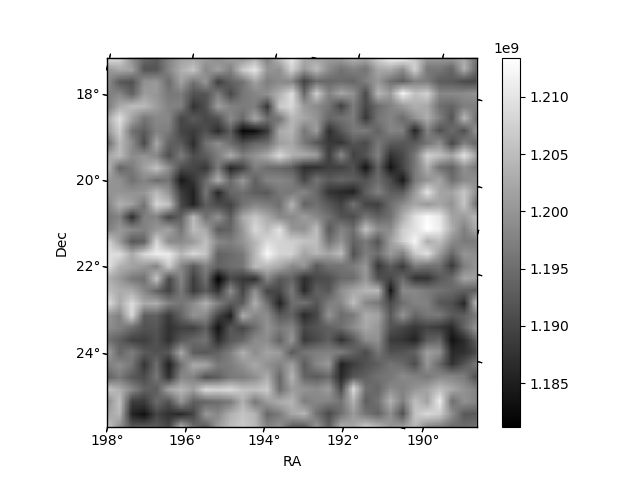
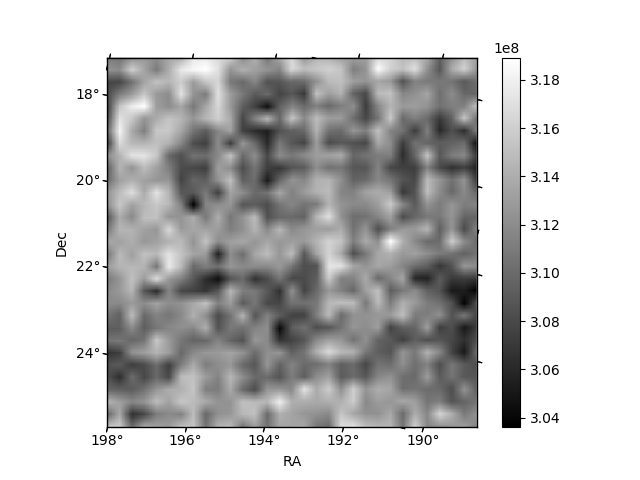
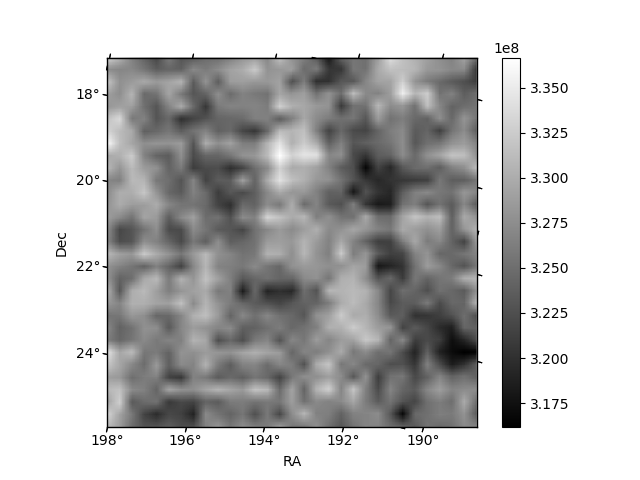
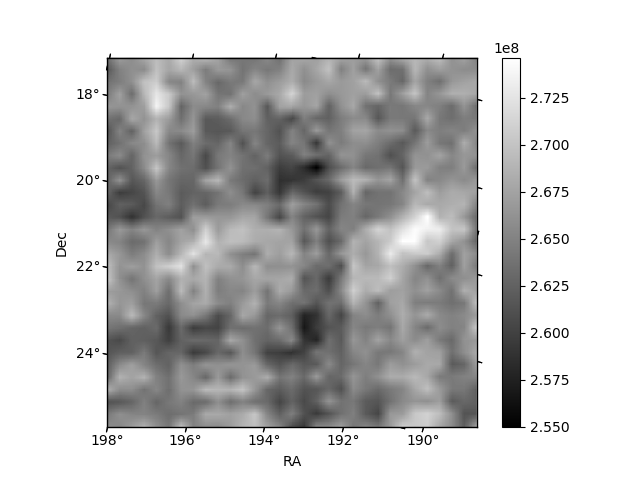
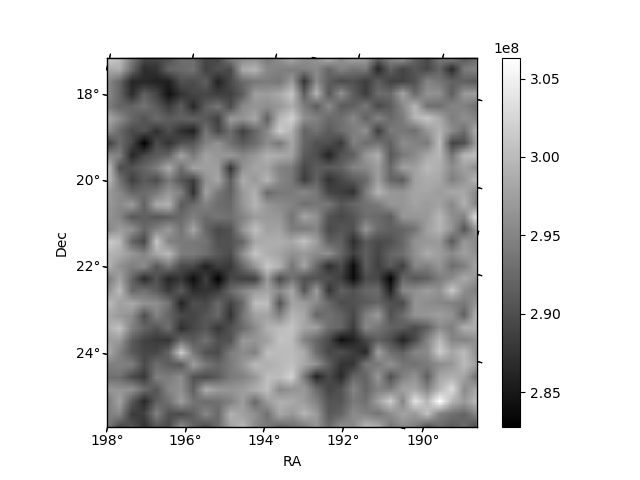
Histogram calculated using DETX and DETY for each event in the final _common_clean file
| Quadrant A | 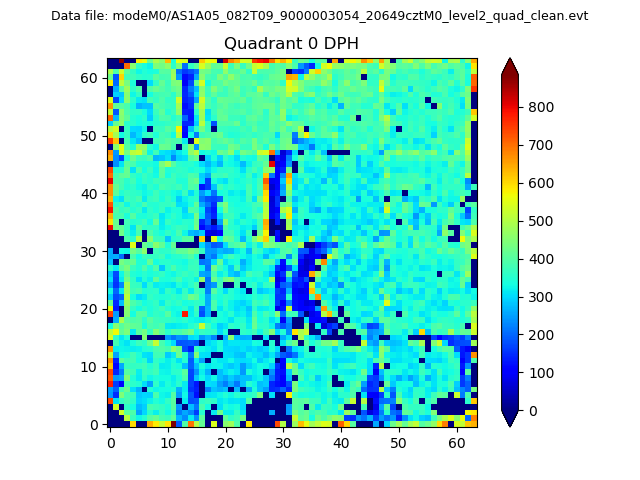 |
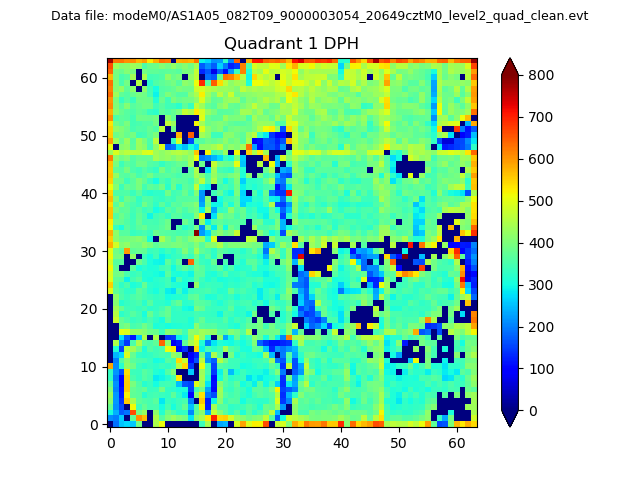 |
Quadrant B |
|---|---|---|---|
| Quadrant D | 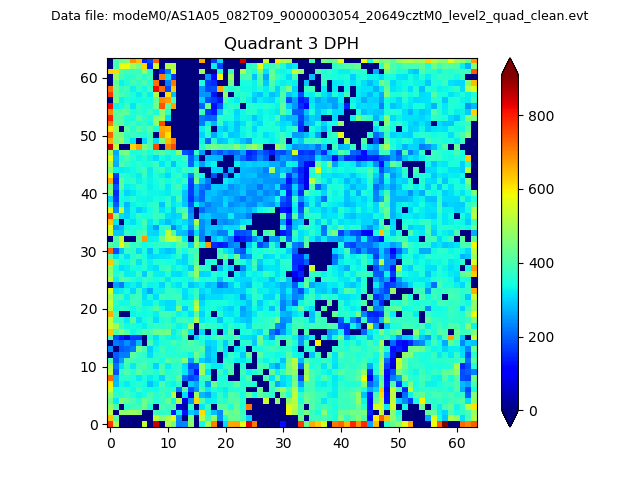 |
 |
Quadrant C |
| Plot type | Count rate plots | Images |
|---|---|---|
| Comparison with Poisson distribution Blue bars denote a histogram of data divided into 1 sec bins. Red curve is a Poisson curve with rate = median count rate of data. |
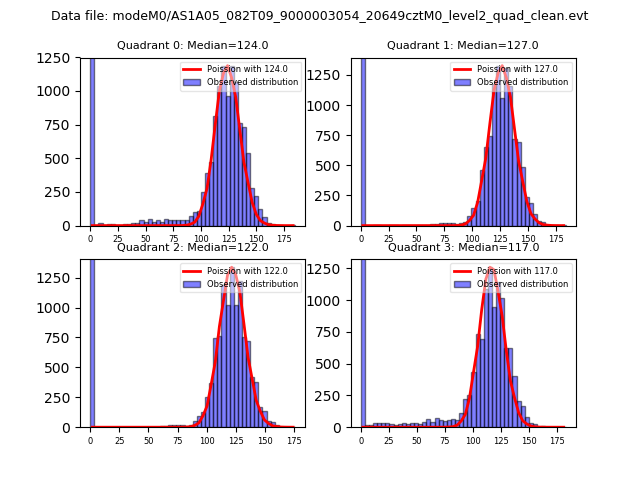 |
 |
| Quadrant-wise count rates Data is divided into 100 sec bins |
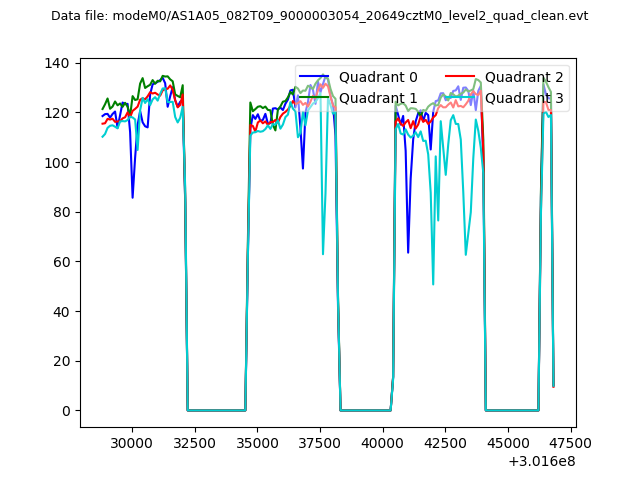 |
|
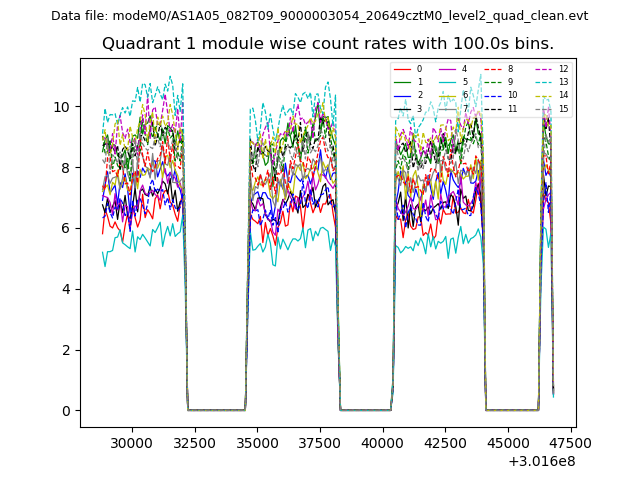
| Module-wise count rates for Quadrant A Data is divided into 100 sec bins |
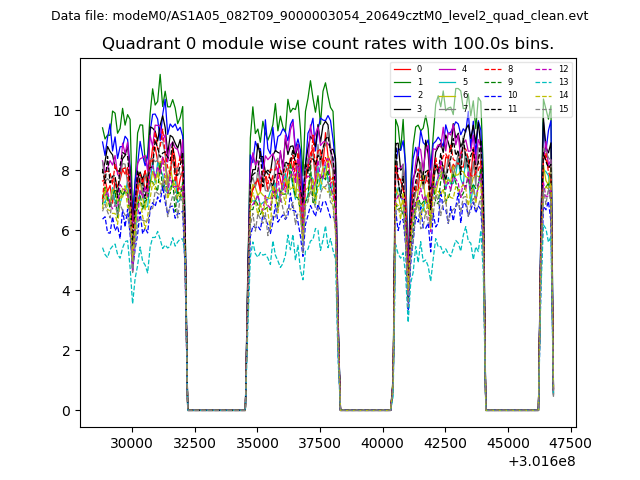 |
 |
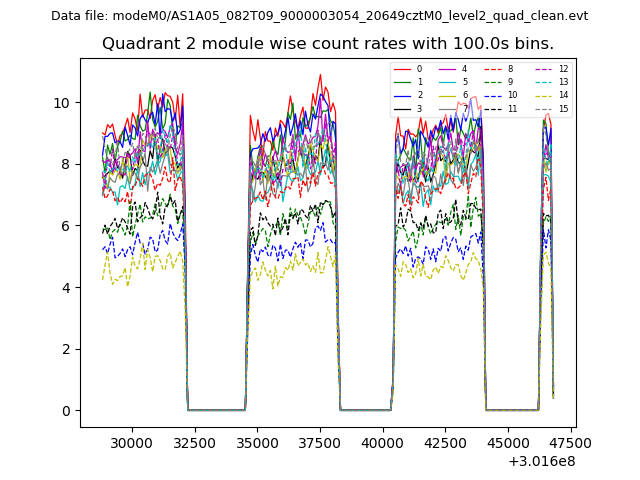
| Module-wise count rates for Quadrant B Data is divided into 100 sec bins |
 |
 |
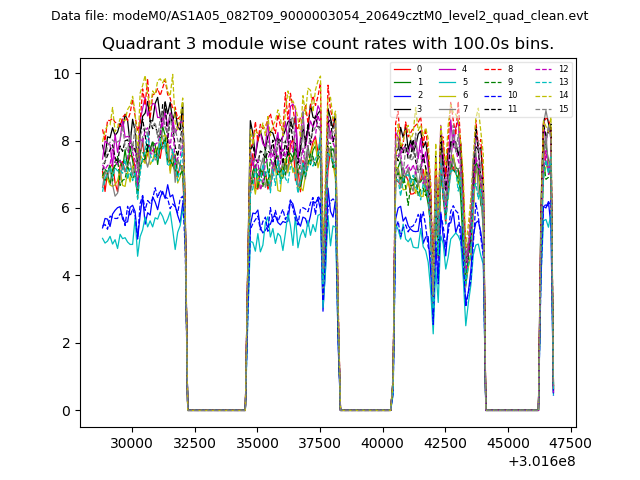
| Module-wise count rates for Quadrant C Data is divided into 100 sec bins |
 |
 |
| Module-wise count rates for Quadrant D Data is divided into 100 sec bins |
 |
 |
| Parameter | Plot |
|---|---|
| CZT HV Monitor |  |
| D_VDD |  |
| Temperature 1 | 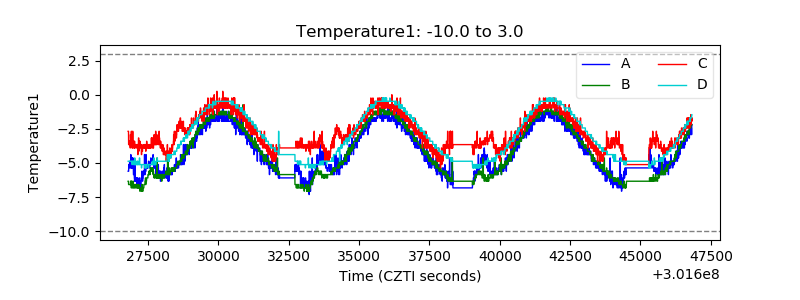 |
| Veto HV Monitor | 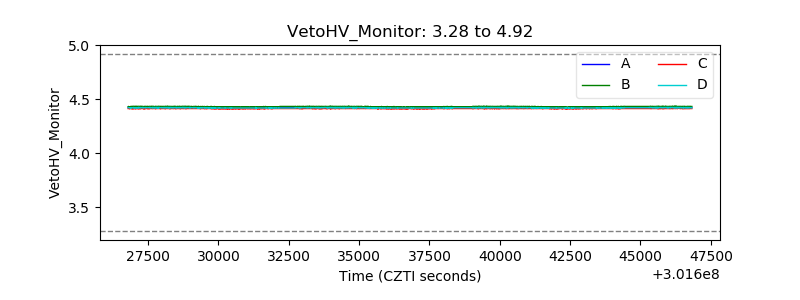 |
| Veto LLD | 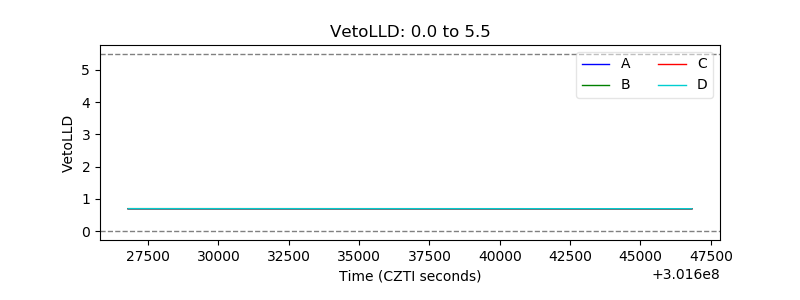 |
| Alpha Counter | 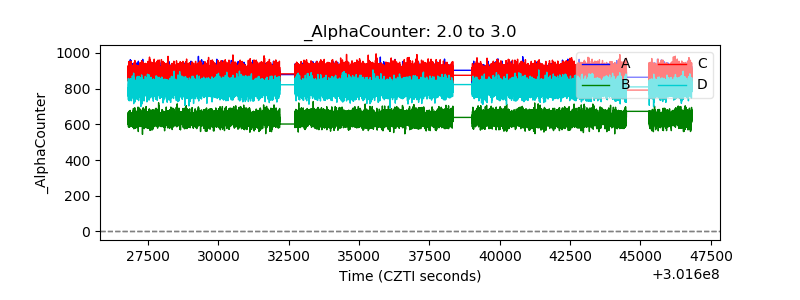 |
| _CPM_Rate | 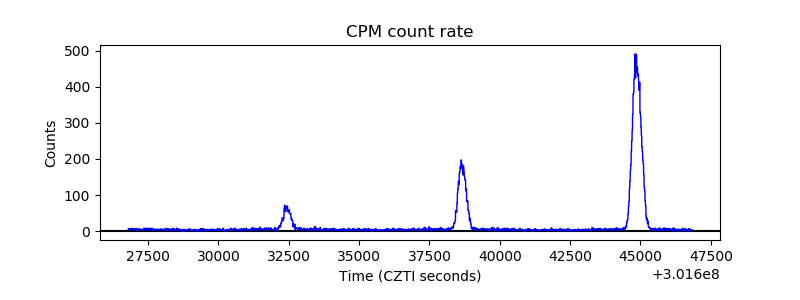 |
| CZT Counter | 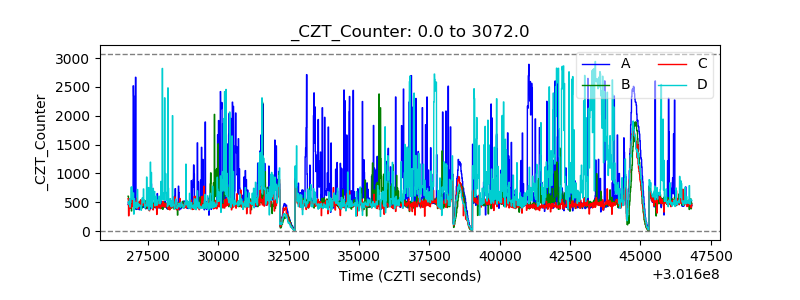 |
| +2.5 Volts monitor |  |
| +5 Volts monitor |  |
| _ROLL_ROT | 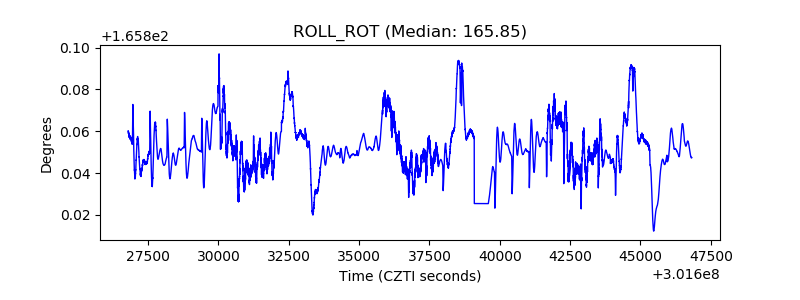 |
| _Roll_DEC | 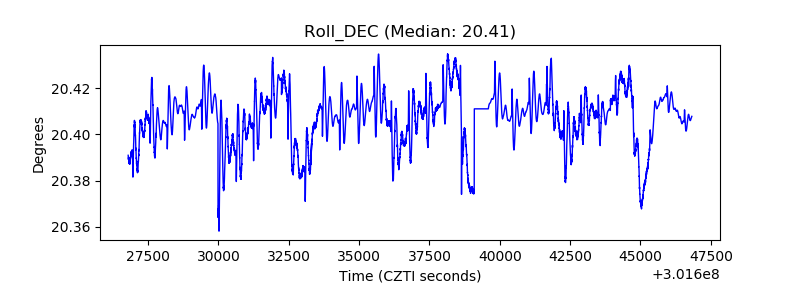 |
| _Roll_RA | 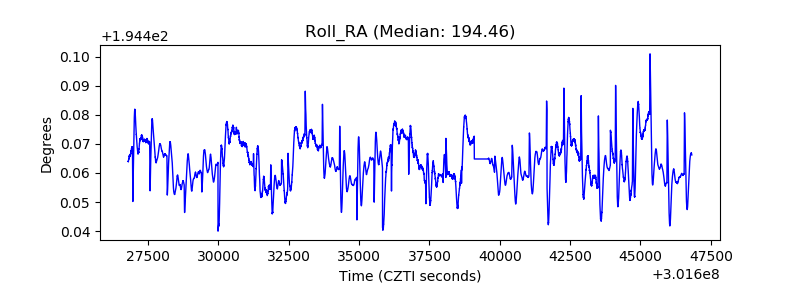 |
| Veto Counter | 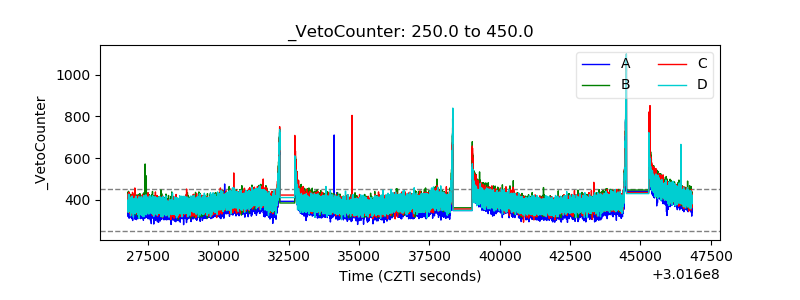 |